


Crypto Market Overview: Bitcoin holds firm at $65,000 – AAVE and ONDO gain traction
- Bitcoin hovers above $65,000 on Monday, testing its 50-day EMA at $65,086.
- Crypto market risk-off sentiment eases toward neutral as the US and Iran extend the pause in strikes.
- Aave and Ondo emerge as top performers over the last 24 hours.
The broader cryptocurrency market risk-off sentiment eases as the US and Iran extend the pause in missile strikes, while Oman holds peace talks. Bitcoin (BTC) holds firm above $65,000 on Monday, while DeFi tokens, including Aave (AAVE) and Ondo (ONDO), emerge as top performers over the last 24 hours.
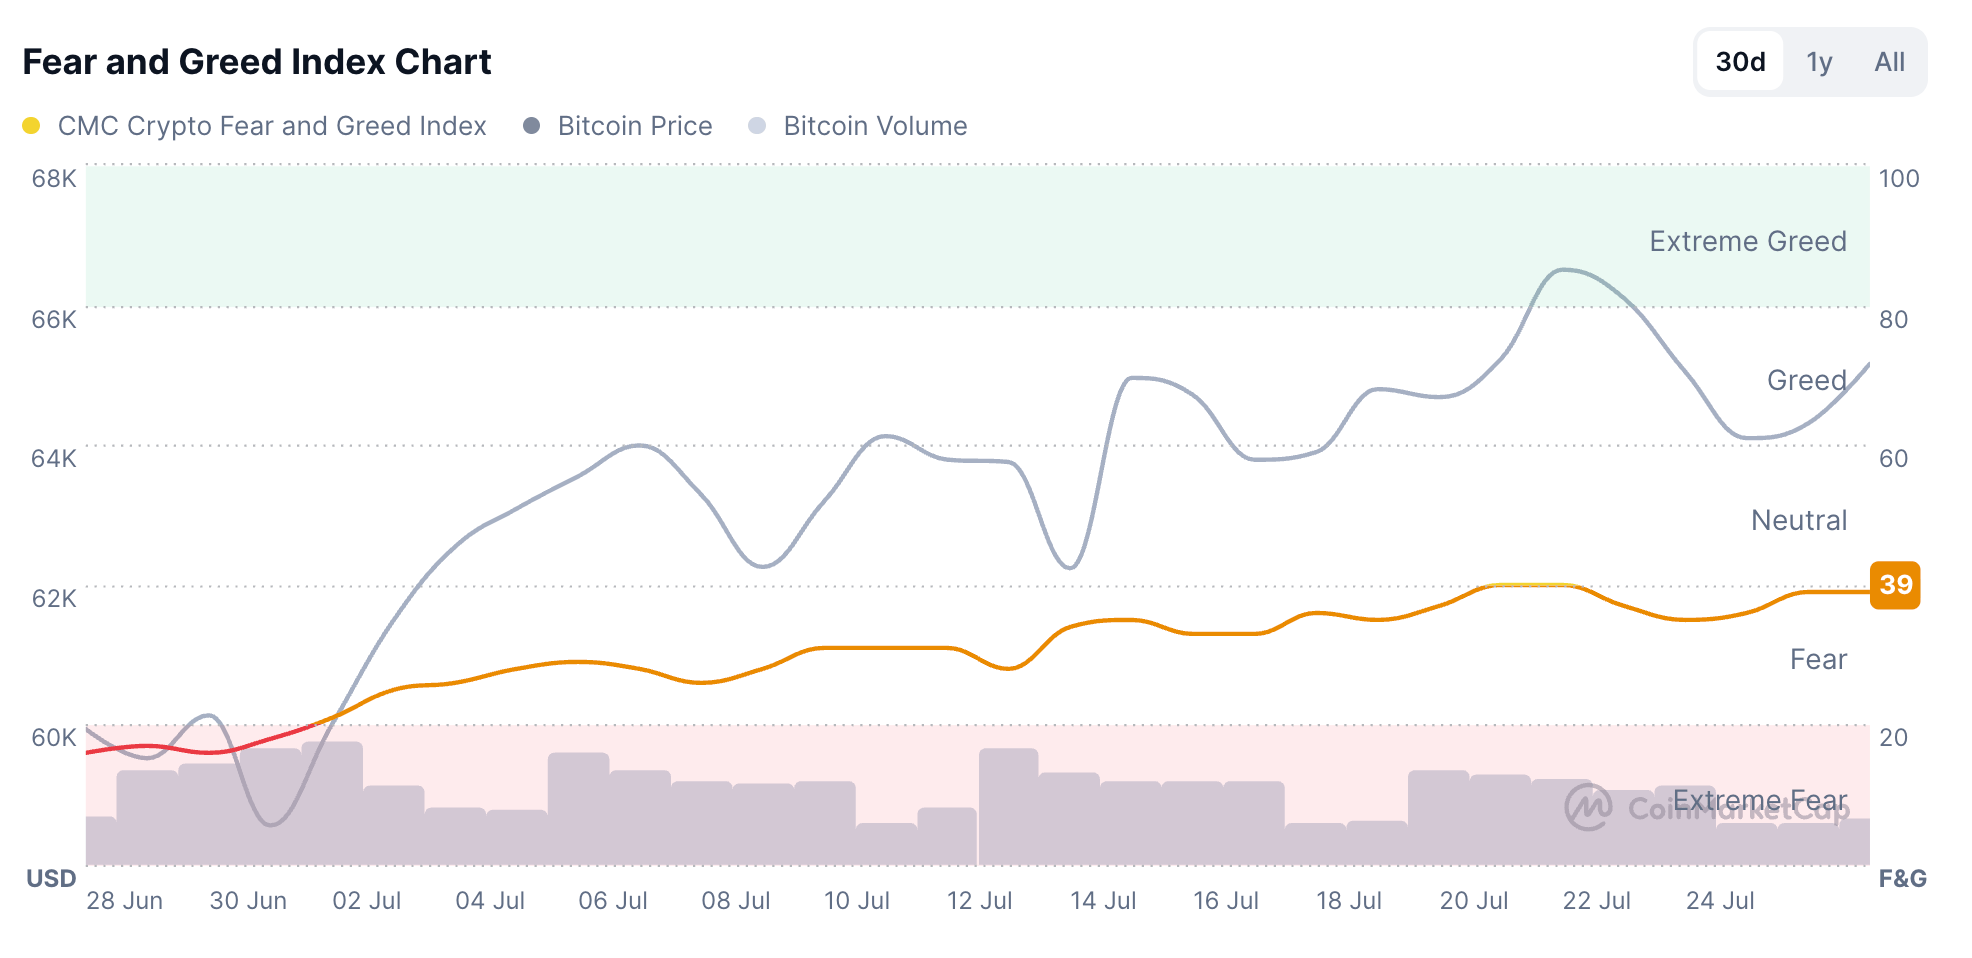
CoinMarketCap’s Fear and Greed Index at 39 on Monday reflects stability close to the neutral zone as risk-off sentiment wanes.
Bitcoin takes support at 50-day EMA
Bitcoin trades above $65,000 at press time on Monday, holding marginally above the 50-day Exponential Moving Average (EMA) at $65,086. BTC remains well beneath the 200-day EMA at $74,529, which keeps the broader outlook capped despite a mild constructive bias in the near term.
From a technical perspective, the key resistance for Bitcoin aligns with the June 3 high at $67,516. A sustained breakout above this level could target the $70,000 mark, followed by the 200-day EMA at $74,529.
The Relative Strength Index (RSI) at 53 hints at neutral-to-slightly positive momentum, while the Moving Average Convergence Divergence (MACD) holds marginally above its signal line in the positive territory, suggesting that upside pressure persists but lacks conviction.
On the downside, immediate support is defined by the 50-day EMA at $65,086; a clear drop back below this level would weaken the nascent constructive tone and open the door to a deeper correction toward the $60,000 mark.
Top performers: Aave and Ondo could extend gains
Aave trades near the $100 mark, with a constructive bullish bias, holding above the 50-day EMA at $89.48 and reclaiming the 50% retracement of the latest downswing from $131.98 to $57.83 at $94.90 as underlying demand. The 200-day EMA at $112.63 still looms overhead, so the broader recovery remains corrective for now.
Momentum has improved as the MACD is on the verge of crossing above its signal line while the RSI hovers near 61, hinting that buyers retain control without yet pushing the market into overbought territory.
On the topside, immediate resistance emerges at the 200-day EMA at $112.63, reinforced by the 78.6% retracement at $116.11. A breakout above this level would expose the prior swing high region near the 100% Fibonacci extension at $131.98.
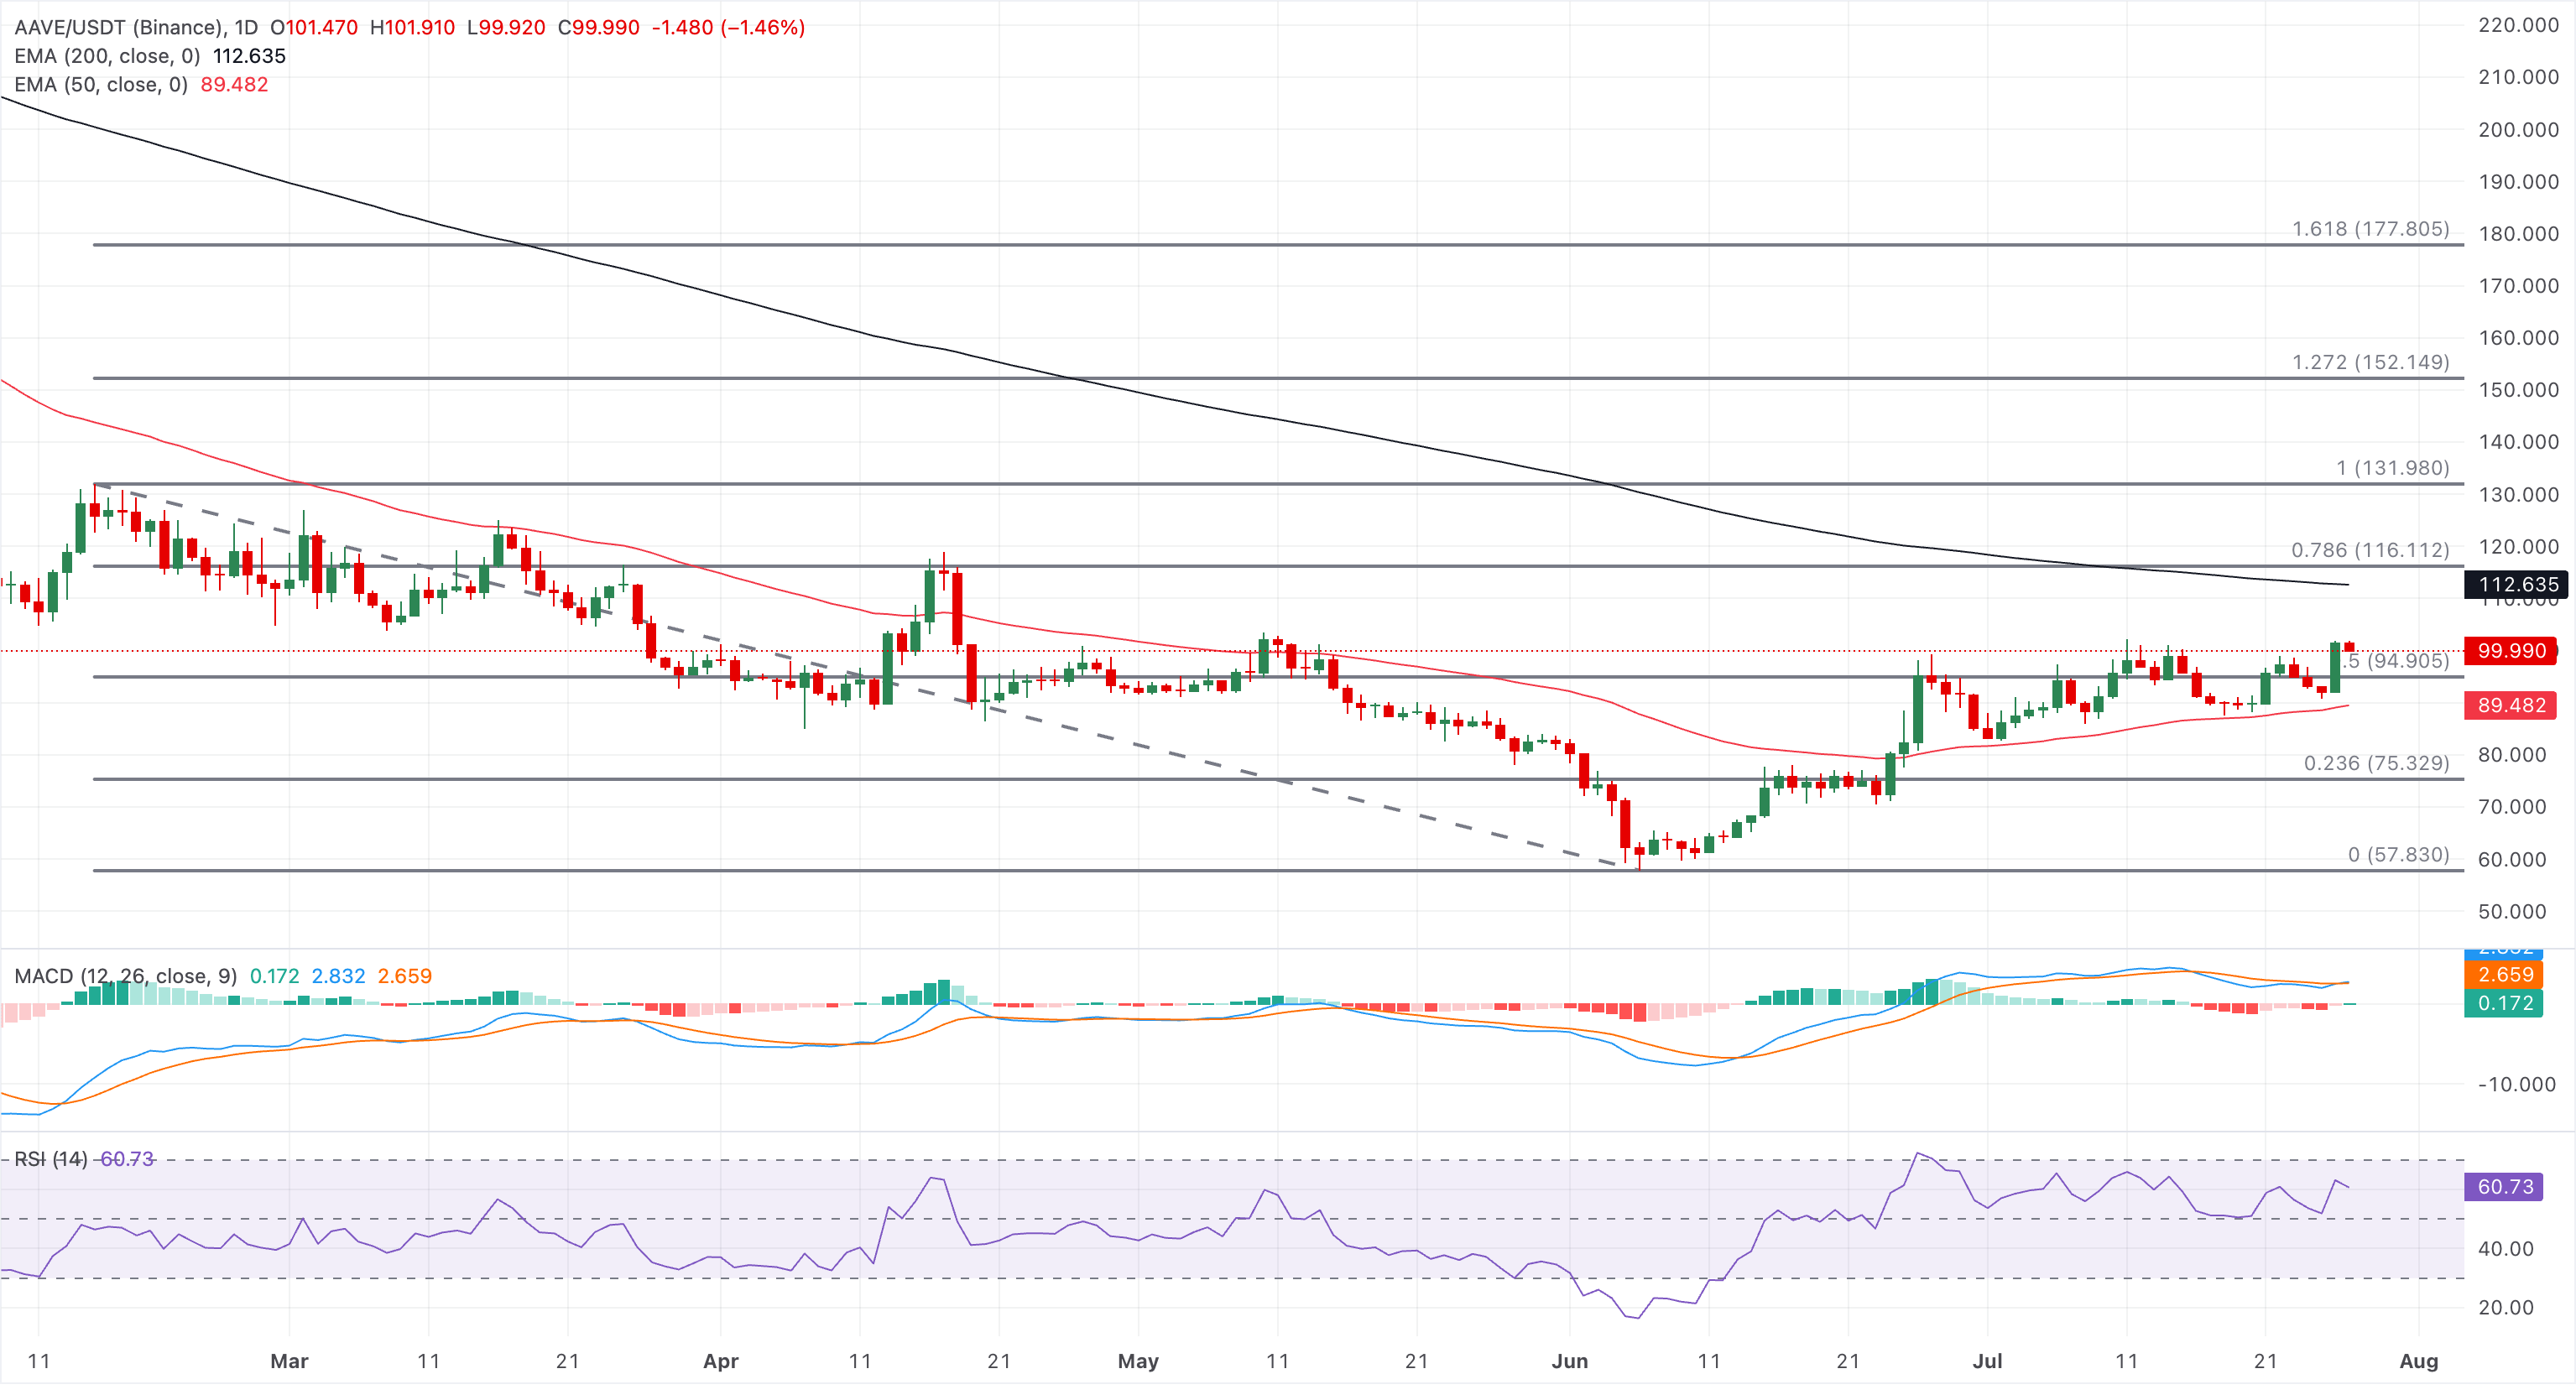
Looking down, initial support is seen at the 50% retracement at $94.90, ahead of the 50-day EMA at $89.50; a daily close below these layers would weaken the bullish structure and open the way toward deeper Fibonacci supports at $86.16 and $75.33.
Ondo maintains a constructive bullish bias as price holds above both the 50-day and 200-day EMAs at $0.3539 and $0.3776, respectively. The position of spot comfortably over these medium- and long-term averages suggests that recent gains are supported by underlying demand.
From a technical standpoint, $0.4524 remains the crucial overhead resistance, which has remained intact since early January. If buyers clear this zone, the price could reclaim the $0.5000 psychological threshold and target the November 5 low at $0.5625.
The RSI near 64 stays in positive territory without yet signaling outright overbought conditions, and the MACD and signal line continue to rise while the histogram remains positive, hinting that upside momentum is still intact although gradually stabilizing.
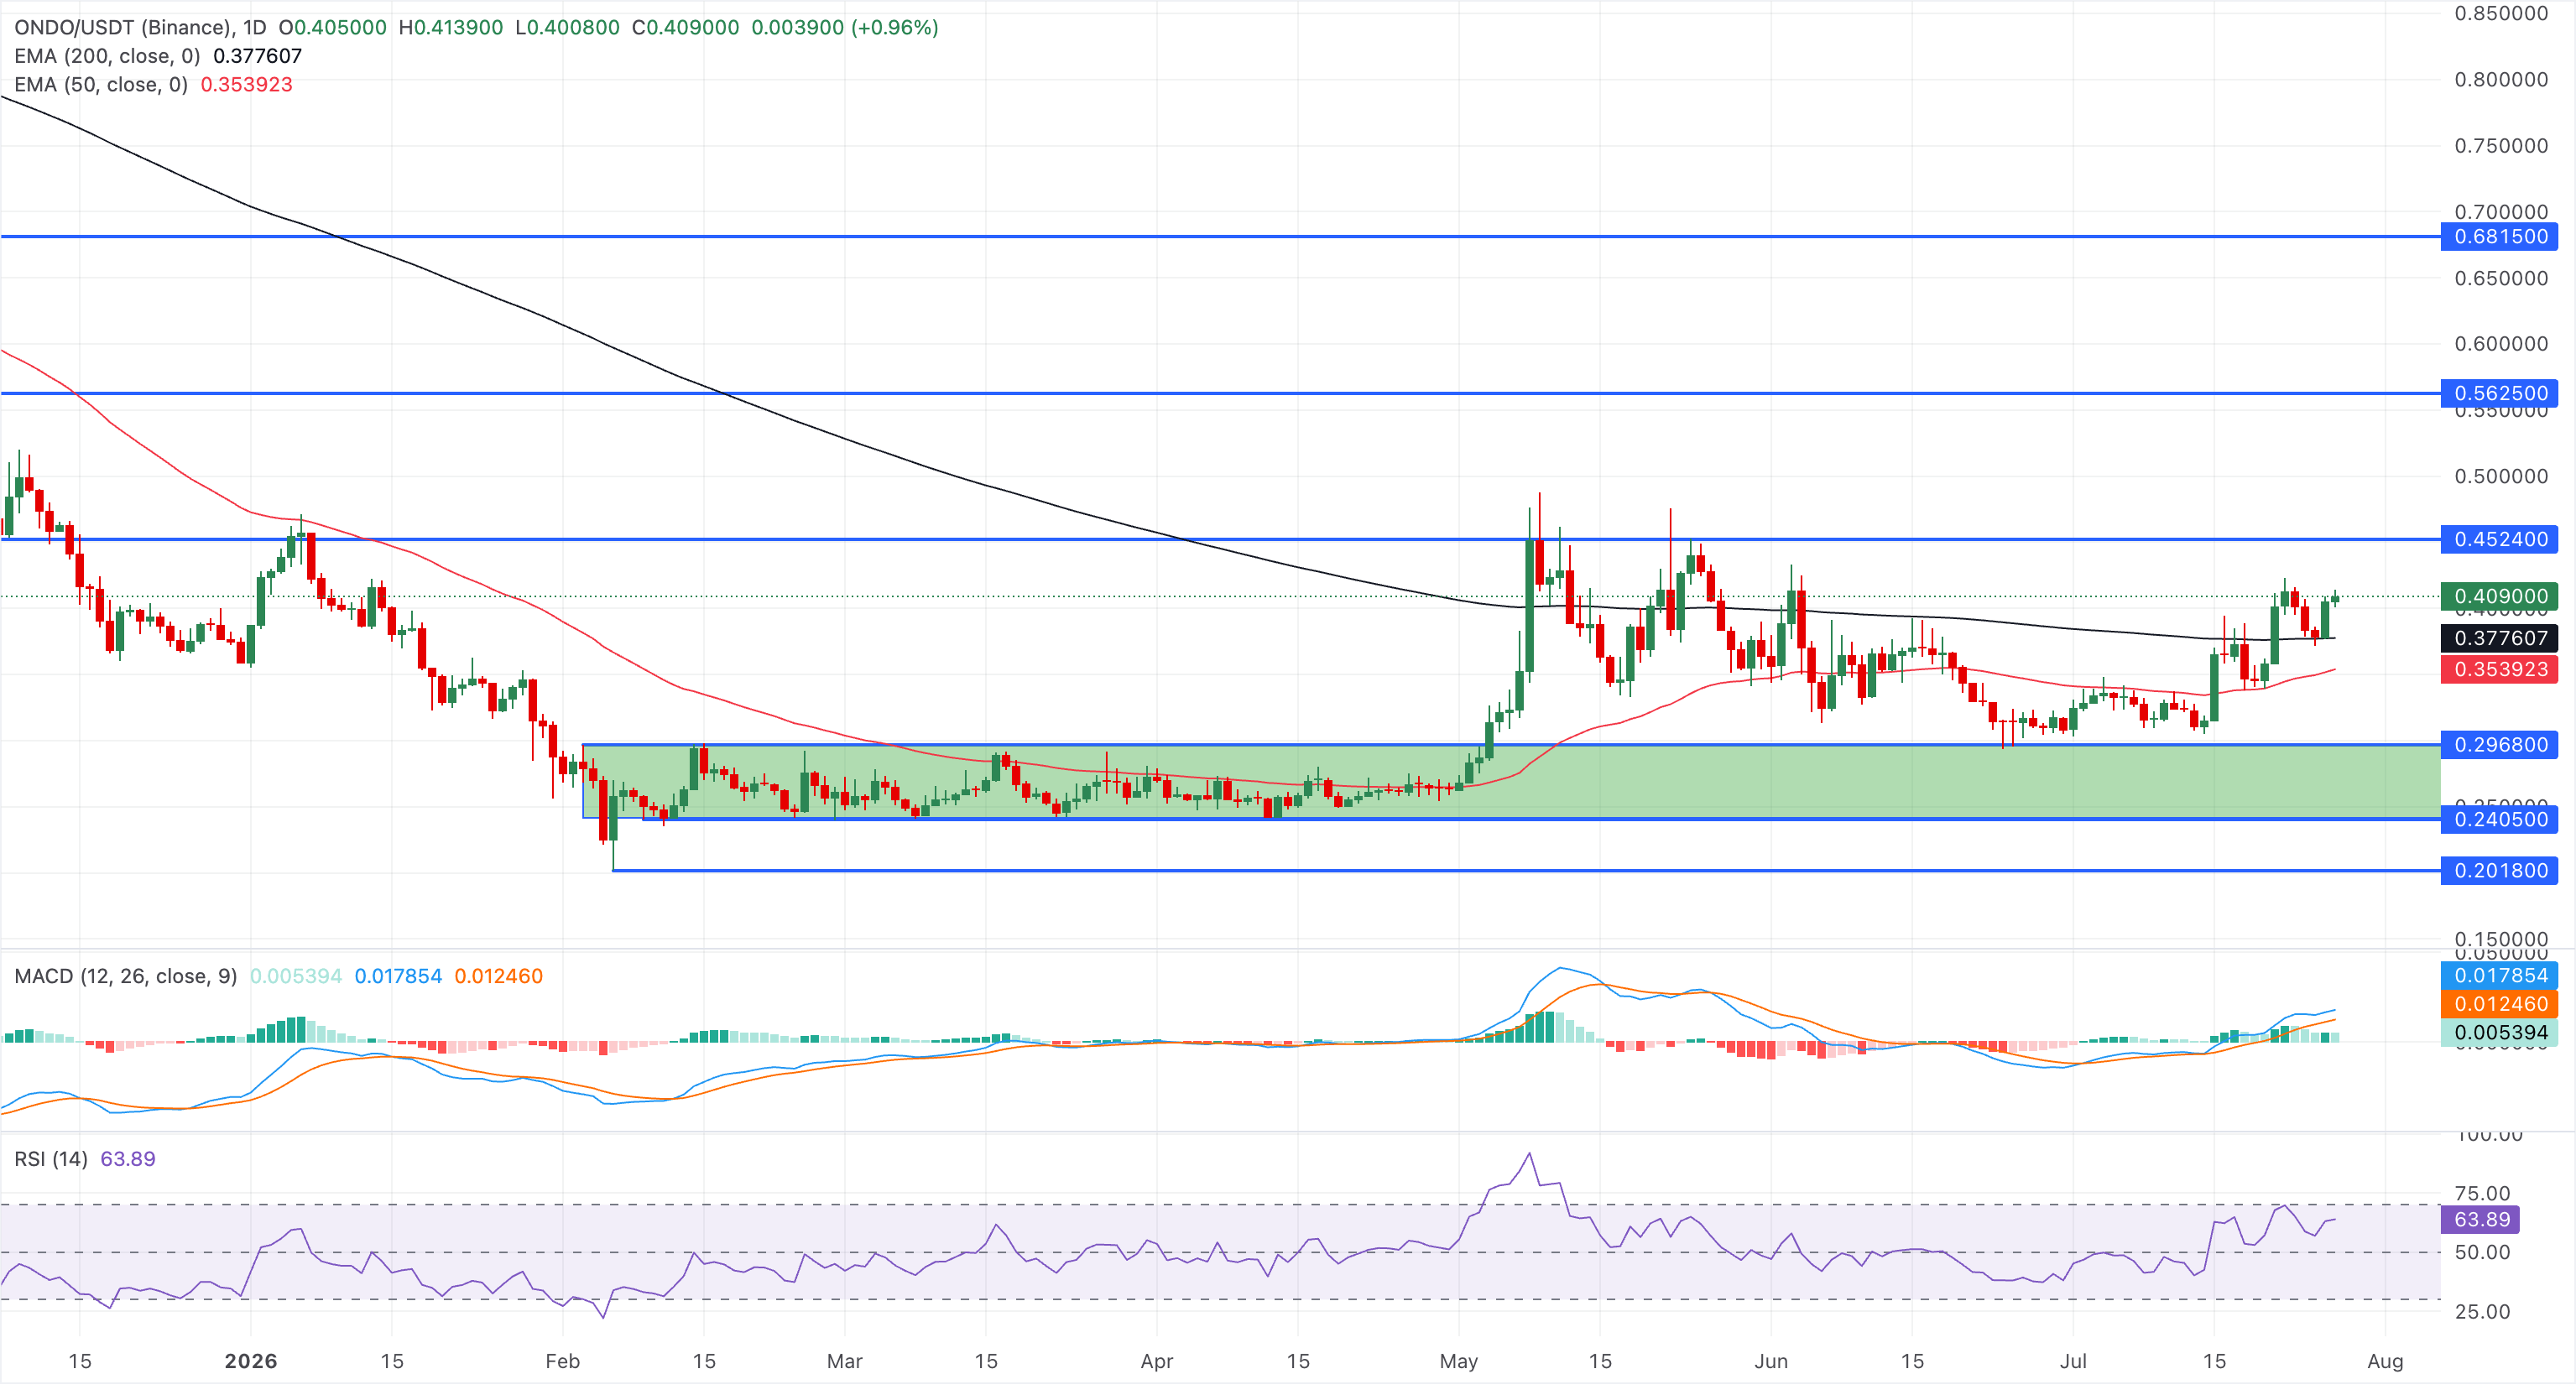
On the downside, initial support is seen at the 200-day EMA around $0.3776, with a deeper pullback likely attracting buyers near the 50-day EMA at $0.3539 as long as the broader uptrend structure remains in place.
(The technical analysis of this story was written with the help of an AI tool. Know more.)
Bài viết đề xuất


