

Three reasons why Bitcoin could drop below $60,000
- Bitcoin defends the $60,000 threshold for the third time this year amid firm bearish momentum.
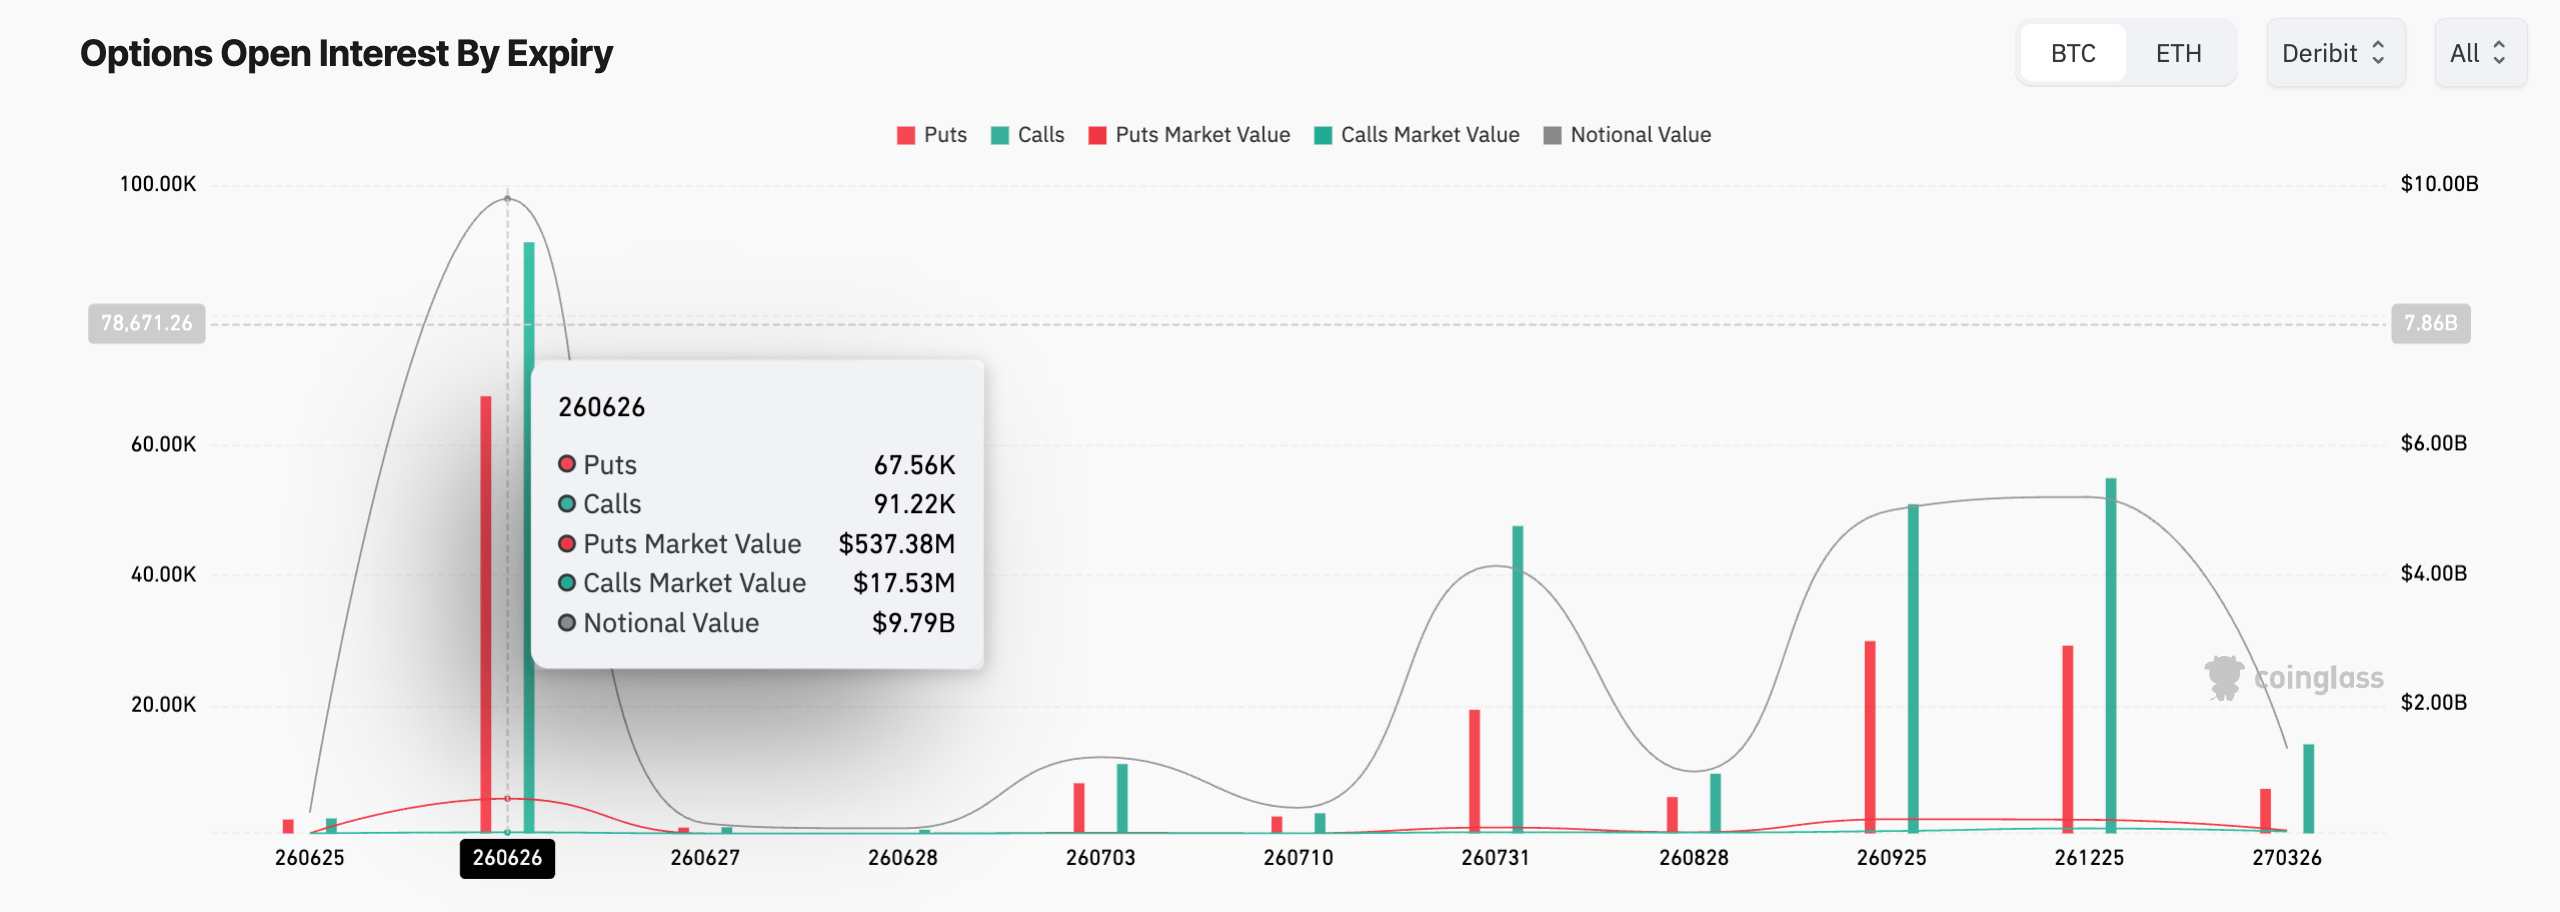
- Bitcoin options expiry of around $10 billion on Friday leans bearish, with $537 million of Puts outpacing $17.53 million of Calls.
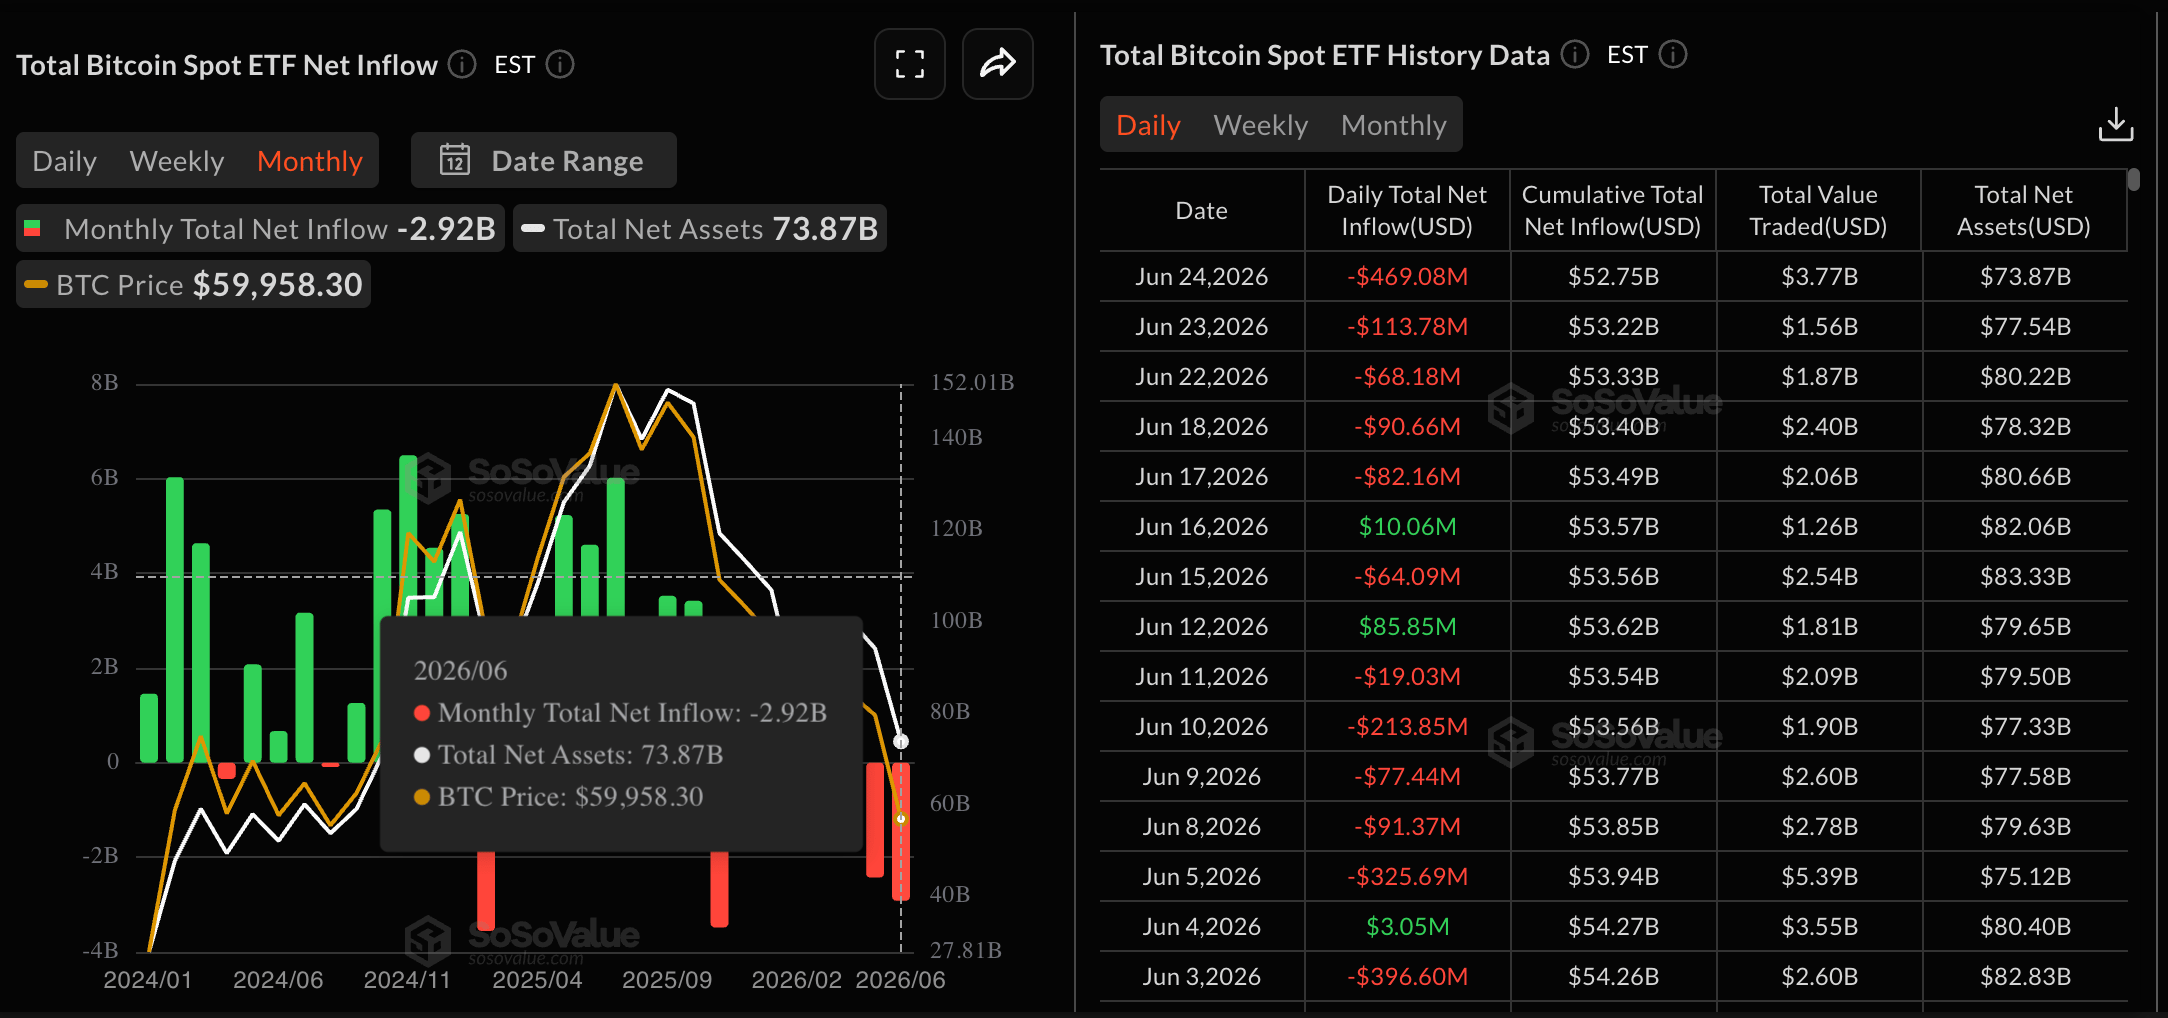
- Institutional demand could see further weakness as outflows cross $2.50 billion so far in June.
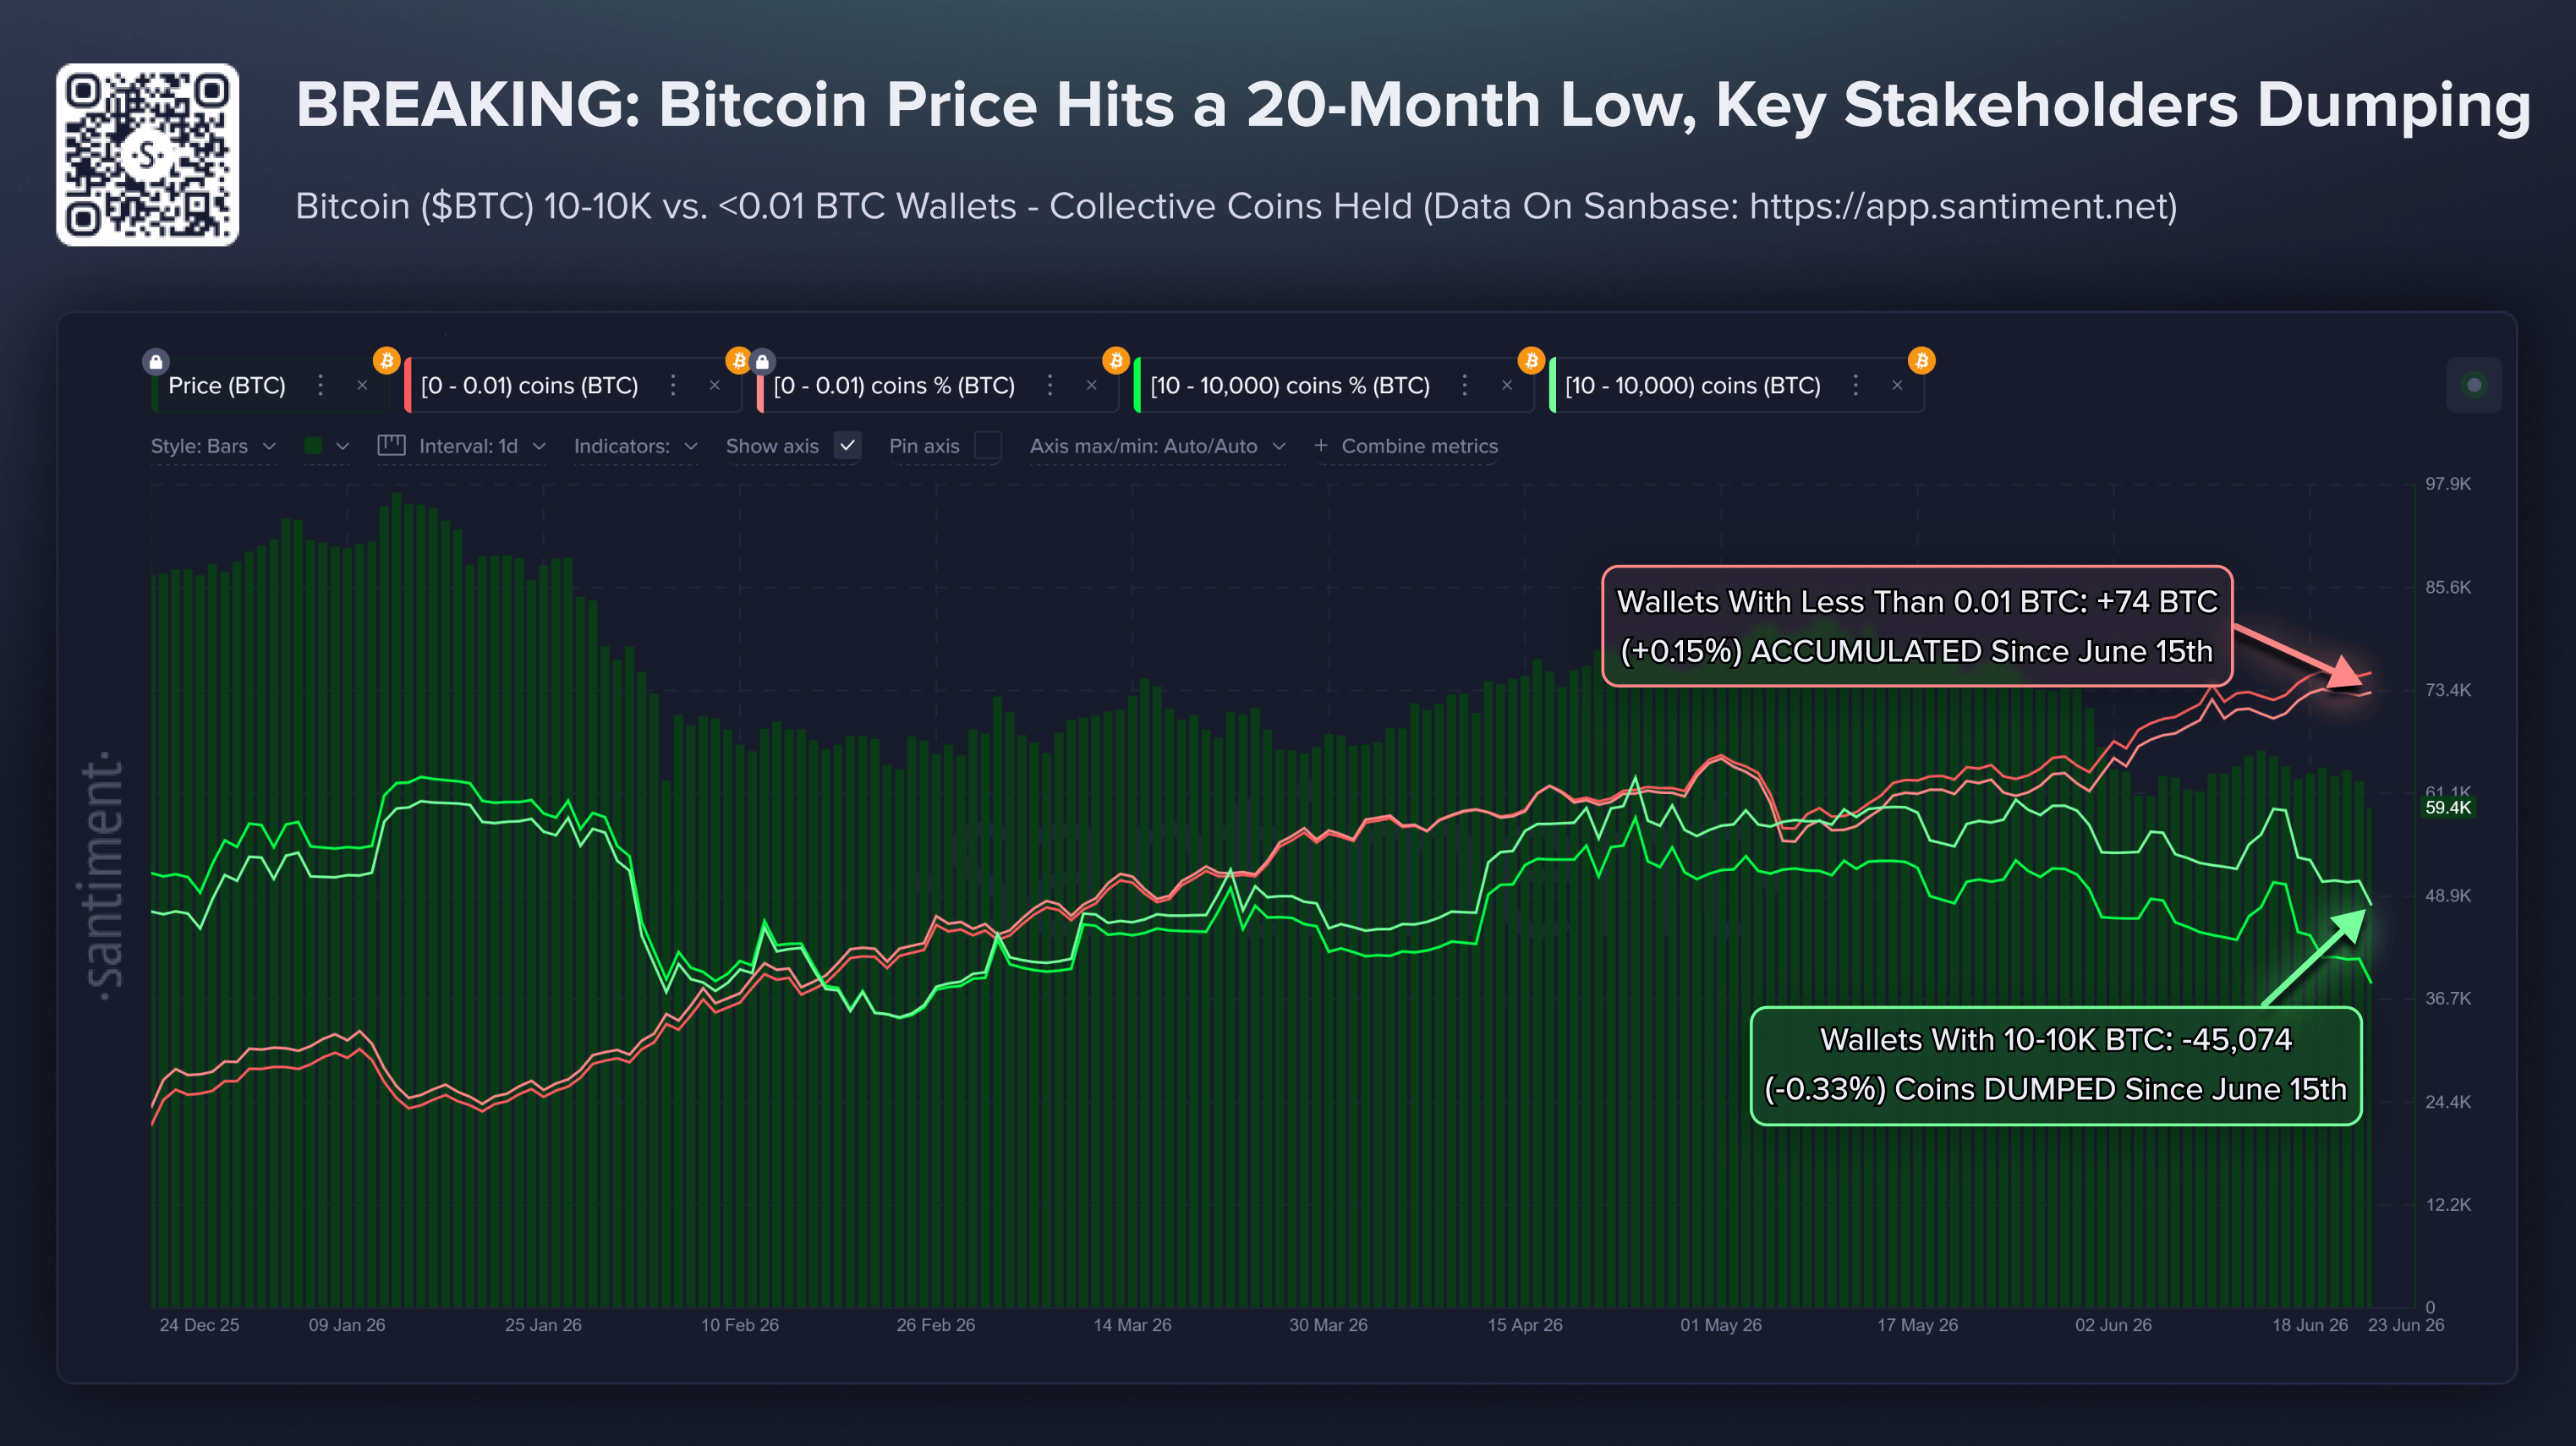
- Whales holding 10 to 10,000 BTC continue to trim their holdings, fueling the supply pressure.
Bitcoin (BTC) hovers around $62,000 on Thursday, recovering from a brief dip below $60,000 the previous day. Although dip buyers anticipate a rebound in BTC from its psychological support zone, bearish signals from the upcoming Bitcoin options expiry, Exchange Traded Funds (ETFs) outflows, and large-wallet investor activity warn that selling could snowball in the coming period.
Bitcoin’s technical strength at $60,000 remains firm for now
Bitcoin shows a minor intraday recovery toward $62,000 at press time on Thursday, despite a broader bearish bias. The 50-day and 200-day Exponential Moving Averages (EMAs) are at $68,267 and $77,233, respectively, reaffirming the longer-term downtrend. From a technical perspective, price has also slipped under a prior rising trendline that last guided closes around $66,377, suggesting that former dynamic support has turned into overhead supply.
That said, momentum is mixed on the daily chart, with the Moving Average Convergence Divergence (MACD) testing its signal line for a bearish crossover as positive histograms contract. Meanwhile, the Relative Strength Index (RSI) at 36 hovers below the midline, suggesting that upside attempts may continue to struggle as the broader structure remains capped.
A decisive close below $60,000 could expose Bitcoin to lower levels last seen in September 2024, with the July 5 low at $53,485 as the immediate support level.
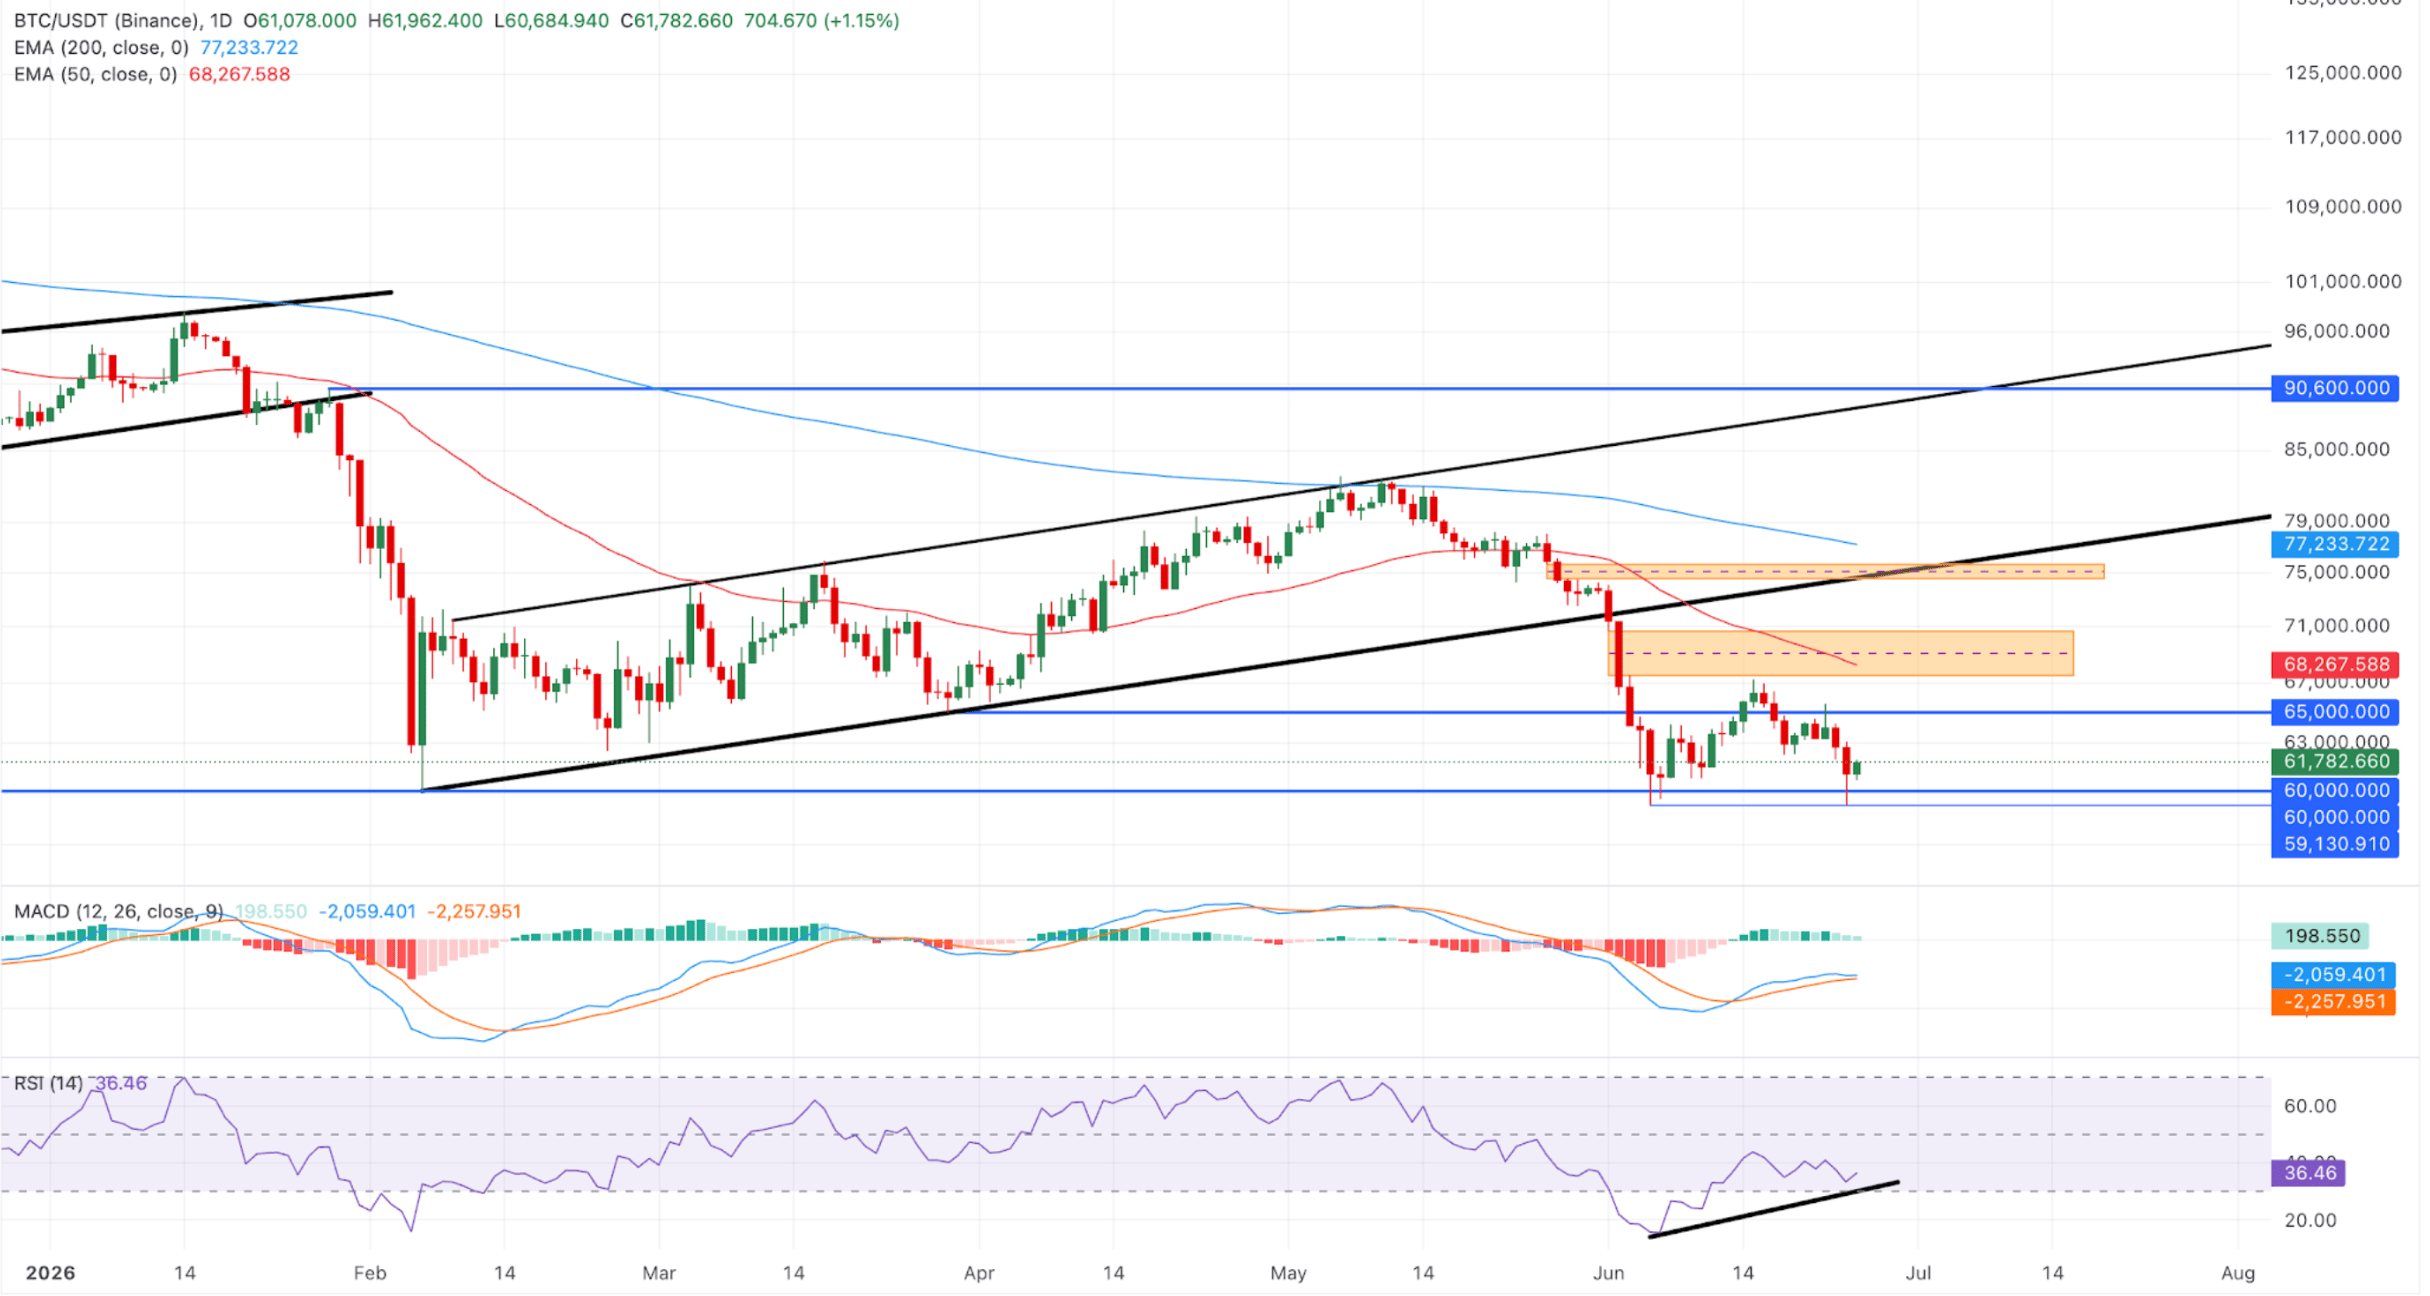
On the topside, the initial barrier emerges at the bearish Fair Value Gap, ranging from $67,516 to $70,686 and including the 50-day EMA at $68,267.
Although the short-term price action reflects bullish resilience around $60,000, options, on-chain, and institutional data signal weakening market conviction.
1. Around $10 billion in Bitcoin options expire on Friday
Bitcoin options expiry has emerged as an impactful short-term catalyst. CoinGlass data show 91,220 call contracts and 67,560 put contracts expiring on Friday on Deribit. Although the sheer number of contracts reflects a bullish bias, the volume reflects an underlying sell-side inclination.
The market value of the put contracts at $537.38 million is vastly higher than that of the call contracts at $17.53 million, indicating that open Call options carry lower premiums, implying that they are likely deep "out-of-the-money" (OTM). Meanwhile, open put options are closer to the current spot price, or "in-the-money" (ITM), and carry much higher premiums.
The BTC options expiry on Friday confirms a bearish bias in the short-term. However, once the roughly $10 billion expiry clears the books, Bitcoin could show a steadier directional trend on either side.
2. Institutional weakness leaves Bitcoin vulnerable to more downside risk
Bitcoin ETFs have emerged as large pools that influence price trends and broader market sentiment. Data shows $2.52 billion in outflows so far this month, extending the $2.43 billion of outflows from last month. A steady streak of outflows this week could approach the record outflows of $3.48 billion and $3.56 billion from November and February 2025, respectively.
3. Whales joining the selling spree
Large wallet investors, or whales, inspired by institutional offloading, are trimming their BTC holdings. Santiment data show that investors holding 10 to 10,000 BTC have dumped 45,074 BTC over the past 8 days. In the same period, retail investors with less than 0.01 BTC have accumulated 74 BTC, reflecting anticipation of a rebound from $60,000. However, retail hype at key support levels typically offers further downside room.
When and at what price will Bitcoin bottom out?
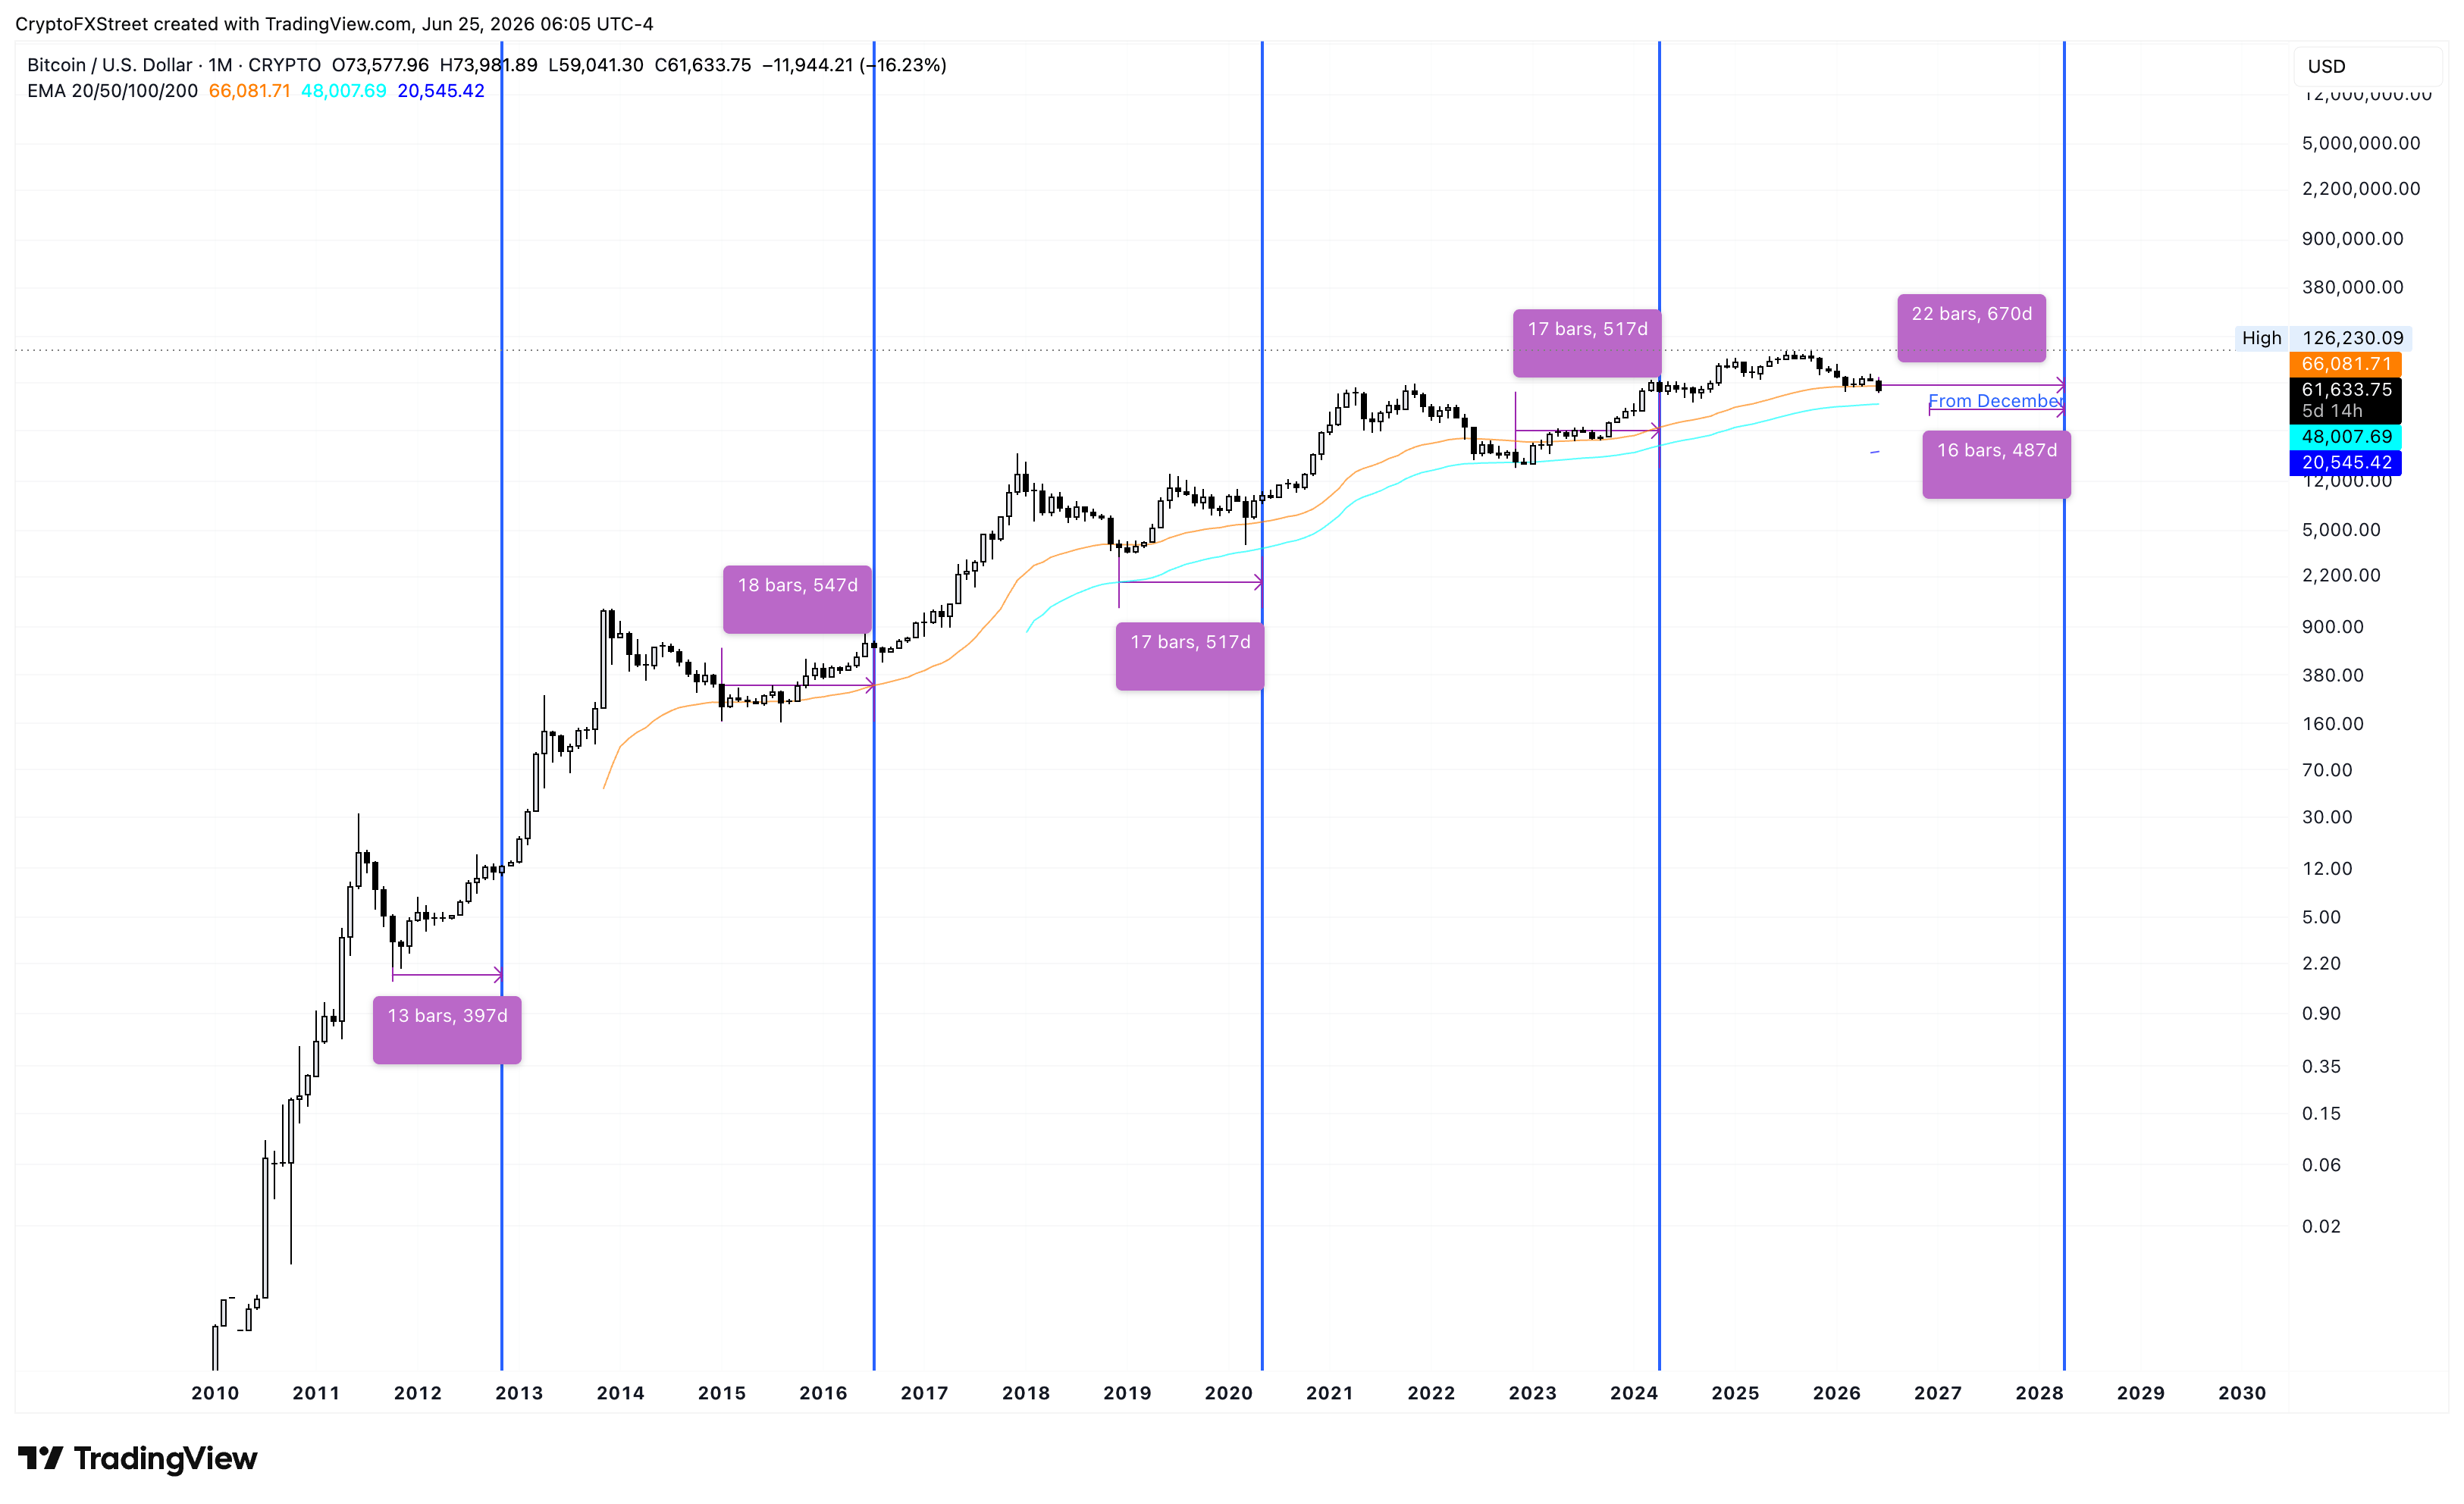
Although Bitcoin faces the risk of falling below $60,000, certain patterns suggest a rebound later this year. Jiang Zhuoer, a Chinese Bitcoin miner, expects the price to settle around $42,000 to $44,000 between October and December 2026 based on Strategy’s mNAV falling to 0.72, close to the 0.7 low seen during the previous bull-to-bear transition in May 2022. Jiang argued that an mNAV bottom could signal BTC hitting its final low in about six months based on MSTR’s mNAV bottom in the last cycle.
The estimated timeline aligns with the thesis that Bitcoin bottoms out 500 days before the next Halving event, with roughly 670 days left until the upcoming fifth Bitcoin halving. From Jiang’s estimated bottom in December, there would be fewer than 500 days left for a potential Bitcoin Halving in April, supporting the rebound theory.
(The technical analysis of this story was written with the help of an AI tool.)
Cryptocurrency metrics FAQs
The developer or creator of each cryptocurrency decides on the total number of tokens that can be minted or issued. Only a certain number of these assets can be minted by mining, staking or other mechanisms. This is defined by the algorithm of the underlying blockchain technology. On the other hand, circulating supply can also be decreased via actions such as burning tokens, or mistakenly sending assets to addresses of other incompatible blockchains.
Market capitalization is the result of multiplying the circulating supply of a certain asset by the asset’s current market value.
Trading volume refers to the total number of tokens for a specific asset that has been transacted or exchanged between buyers and sellers within set trading hours, for example, 24 hours. It is used to gauge market sentiment, this metric combines all volumes on centralized exchanges and decentralized exchanges. Increasing trading volume often denotes the demand for a certain asset as more people are buying and selling the cryptocurrency.
Funding rates are a concept designed to encourage traders to take positions and ensure perpetual contract prices match spot markets. It defines a mechanism by exchanges to ensure that future prices and index prices periodic payments regularly converge. When the funding rate is positive, the price of the perpetual contract is higher than the mark price. This means traders who are bullish and have opened long positions pay traders who are in short positions. On the other hand, a negative funding rate means perpetual prices are below the mark price, and hence traders with short positions pay traders who have opened long positions.
Bài viết đề xuất


