

Top 3 Price Prediction: Bitcoin, Ethereum, Ripple – BTC consolidates gains, ETH defends support, XRP nears breakout trigger
- Bitcoin steadies at $65,600 on Monday after recovering nearly 4% in the previous week.
- Ethereum remains resilient above the $1,700 support level, keeping the door open for further rebound.
- XRP nears the upper boundary of a falling channel, breakout suggests a bullish move.
Bitcoin (BTC), Ethereum (ETH) and Ripple (XRP) begin the week on a constructive note as the top three cryptocurrencies attempt to extend rebounds after recovering nearly 4%, 2% and 2.6%, respectively. BTC steadies around $65,600, ETH continues to hold firmly above the key $1,700 support, while XRP nears the upper boundary of the falling channel pattern. Momentum indicators of these top three cryptocurrencies suggest fading bearish strength, hinting at a recovery ahead.
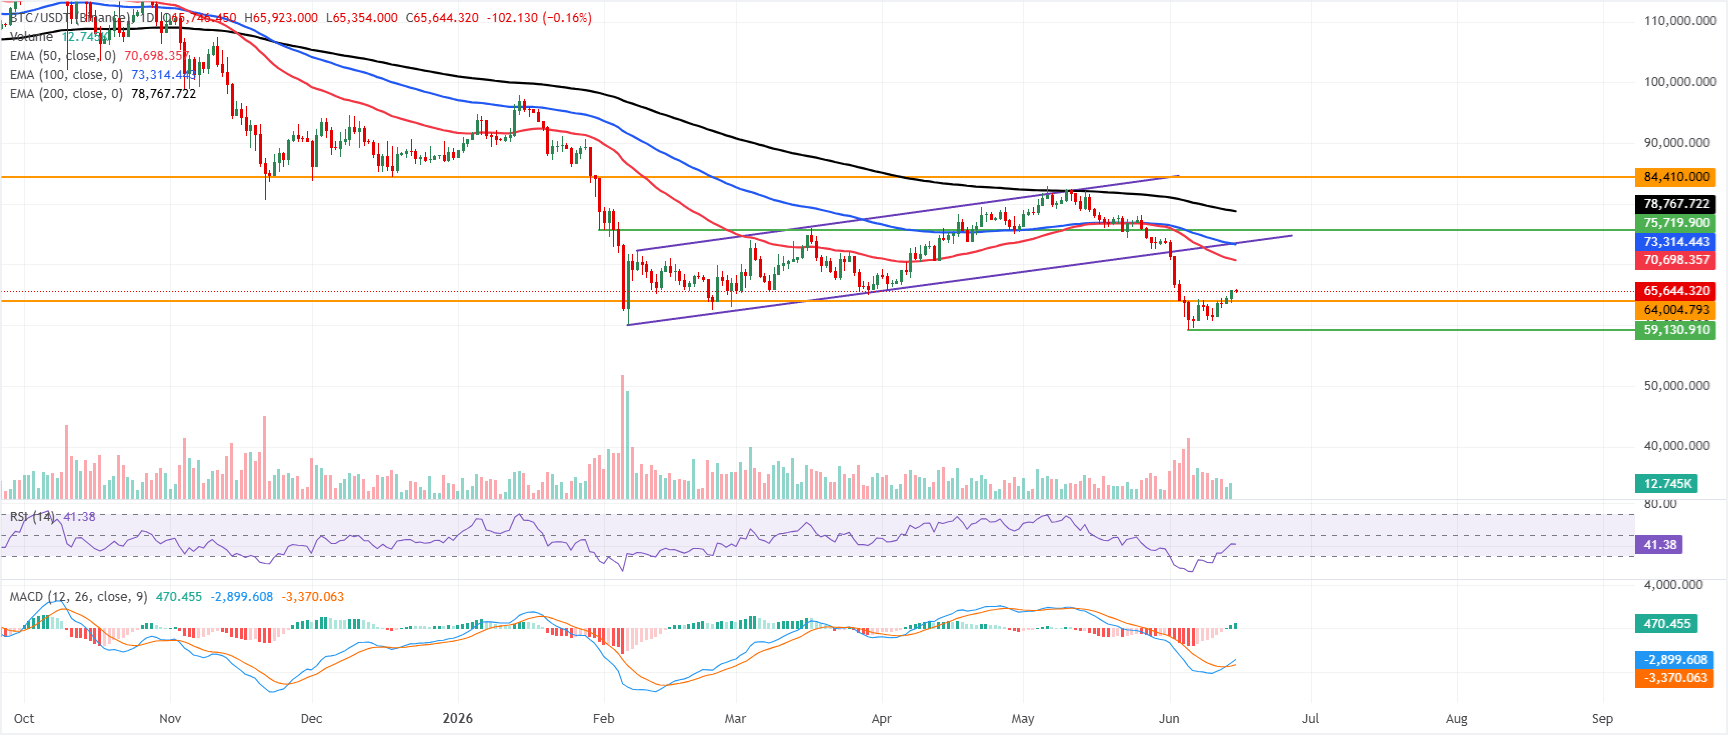
Bitcoin closes above the $64,000 resistance
Bitcoin price trades at $65,600 after recovering nearly 4% in the previous week. However, BTC maintains a bearish near-term bias as price remains well below the 50-day, 100-day, and 200-day Exponential Moving Averages (EMAs) and the previously broken ascending trendline. While the Moving Average Convergence Divergence (MACD) has flipped positive and the Relative Strength Index (RSI) on the daily chart hovers around 41, suggesting waning downside momentum, the dominant structure still points to a capped market under multiple layers of overhead resistance.
On the topside, initial resistance aligns with the 50-day EMA near $70,698, followed by the 100-day EMA at about $73,314 and the former uptrend support-turned-resistance around $73,505, forming a dense supply zone. Above that, the 200-day EMA at roughly $78,767 comes next, followed by a more distant horizontal barrier at $84,410.
On the downside, the first notable support is the horizontal level at $64,004, where a break would reopen the path toward deeper corrective losses despite the current attempts to stabilize momentum.
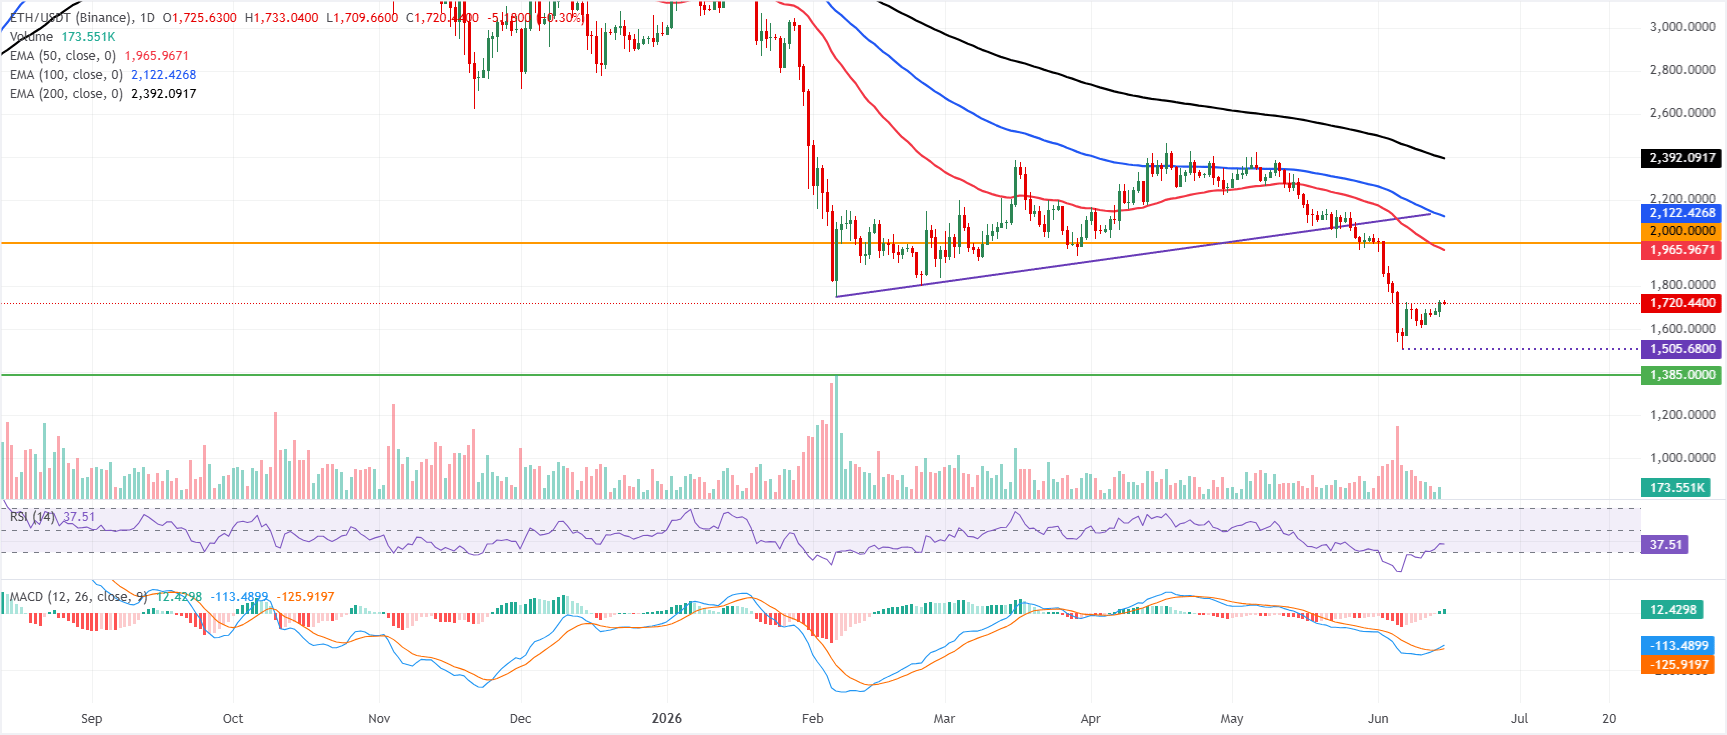
Ethereum momentum indicators show fading bearish strength
Ethereum price trades above $1,700 after rebounding over 2% in the previous week. However, ETH is maintaining a bearish near-term bias, as it remains well below the 50-day, 100-day, and 200-day EMAs, clustered between roughly $1,965 and $2,392. The horizontal barrier at $2,000 acts as the first cap above price, while the RSI on the daily chart around 37 still points to subdued buying pressure even as the MACD turns positive, hinting at an early rebound attempt within a broader downtrend.
On the topside, immediate resistance emerges at the horizontal level of $2,000, followed by the 50-day EMA near $1,965, the 100-day EMA around $2,122, and the 200-day EMA near $2,392, forming a broader supply band that would need to be cleared to ease the bearish structure.
On the downside, the next significant cushion sits at the prior horizontal support zone around $1,385, where a break would likely reopen the path toward lower lows despite the recent improvement in MACD.
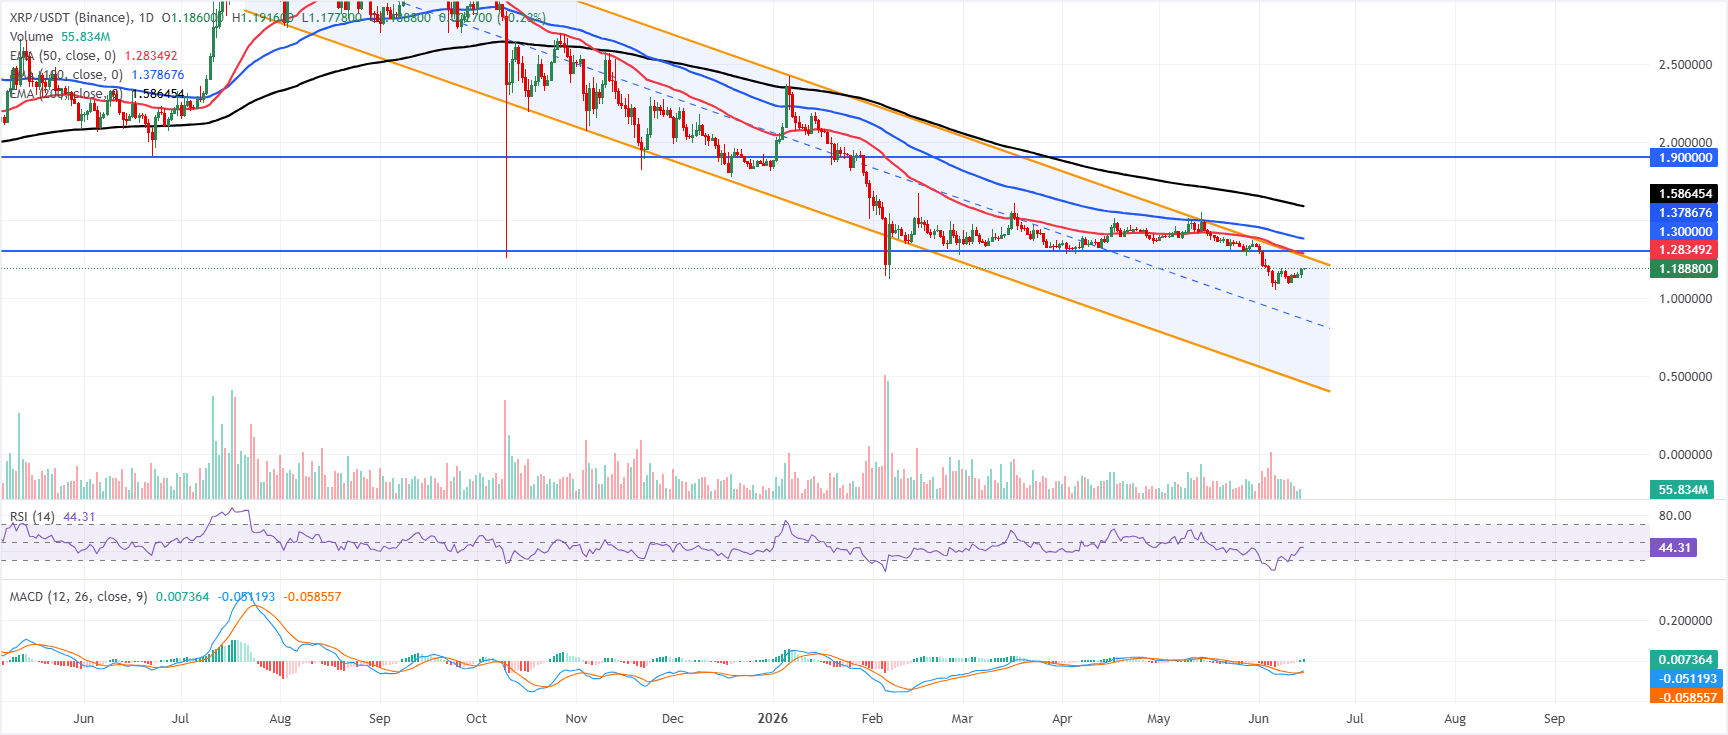
XRP could extend gains if it breaks above the falling channel pattern
XRP price trades at $1.188, maintaining a bearish near-term bias as it remains well below the 50-day, 100-day, and 200-day EMAs, clustered between roughly $1.280 and $1.590. The pair also trades under the upper boundary of a downward parallel channel around $1.270, underscoring a capped structure. At the same time, the RSI has recovered from oversold territory into the mid-40s, and the MACD has turned slightly positive but remains below zero, suggesting only tentative corrective strength within a broader downside context.
On the topside, initial resistance is aligned with the channel boundary near $1.270, followed by the 50-day EMA around $1.283 and the previously marked horizontal level at $1.300, which together form a dense supply zone that could limit rebounds. Above that, the 100-day EMA near $1.378 and the 200-day EMA around $1.586 act as successive bullish validation levels ahead of the more distant horizontal resistance at $1.900, while the absence of nearby structural support below the market leaves any fresh setback vulnerable to acceleration if selling pressure resumes.
(The technical analysis of this story was written with the help of an AI tool.)
Cryptocurrency metrics FAQs
The developer or creator of each cryptocurrency decides on the total number of tokens that can be minted or issued. Only a certain number of these assets can be minted by mining, staking or other mechanisms. This is defined by the algorithm of the underlying blockchain technology. On the other hand, circulating supply can also be decreased via actions such as burning tokens, or mistakenly sending assets to addresses of other incompatible blockchains.
Market capitalization is the result of multiplying the circulating supply of a certain asset by the asset’s current market value.
Trading volume refers to the total number of tokens for a specific asset that has been transacted or exchanged between buyers and sellers within set trading hours, for example, 24 hours. It is used to gauge market sentiment, this metric combines all volumes on centralized exchanges and decentralized exchanges. Increasing trading volume often denotes the demand for a certain asset as more people are buying and selling the cryptocurrency.
Funding rates are a concept designed to encourage traders to take positions and ensure perpetual contract prices match spot markets. It defines a mechanism by exchanges to ensure that future prices and index prices periodic payments regularly converge. When the funding rate is positive, the price of the perpetual contract is higher than the mark price. This means traders who are bullish and have opened long positions pay traders who are in short positions. On the other hand, a negative funding rate means perpetual prices are below the mark price, and hence traders with short positions pay traders who have opened long positions.
Bài viết đề xuất


