

Dogecoin Price Forecast: DOGE extends losses despite steady institutional support

Nguồn Fxstreet
  • Dogecoin edges lower on Tuesday, extending its third consecutive week of losses.
  • Institutional demand for DOGE holds steady, with four consecutive weeks of inflows.
  • The technical outlook is cautiously bearish, as DOGE risks slipping below the $0.1000 psychological support level.

Dogecoin (DOGE) is facing intense selling pressure, dragging toward its $0.1000 psychological support on Tuesday. DOGE leads the underperforming meme coin sector despite growing institutional inflows over the last four weeks. Dogecoin should remain buoyant above $0.1000 to avoid deeper corrections. 

Growing ETF inflows capture the Dogecoin dip

Dogecoin is attracting institutional inflows, while Bitcoin (BTC) and Ethereum (ETH) Exchange-Traded Funds (ETFs) recorded roughly $1.26 billion and $216 million in outflows last week. Typically, an increase in institutional activity drives up investors' confidence and demand. 

Sosovalue data show DOGE spot ETFs have recorded four straight weeks of positive flows, with $860,960 in inflows last week. The previous weekly inflows reflected a steady rise, reaffirming the institutional support. In the case of Dogecoin, a highly speculative cryptocurrency, such institutional backing implies its growth as a meme coin. 
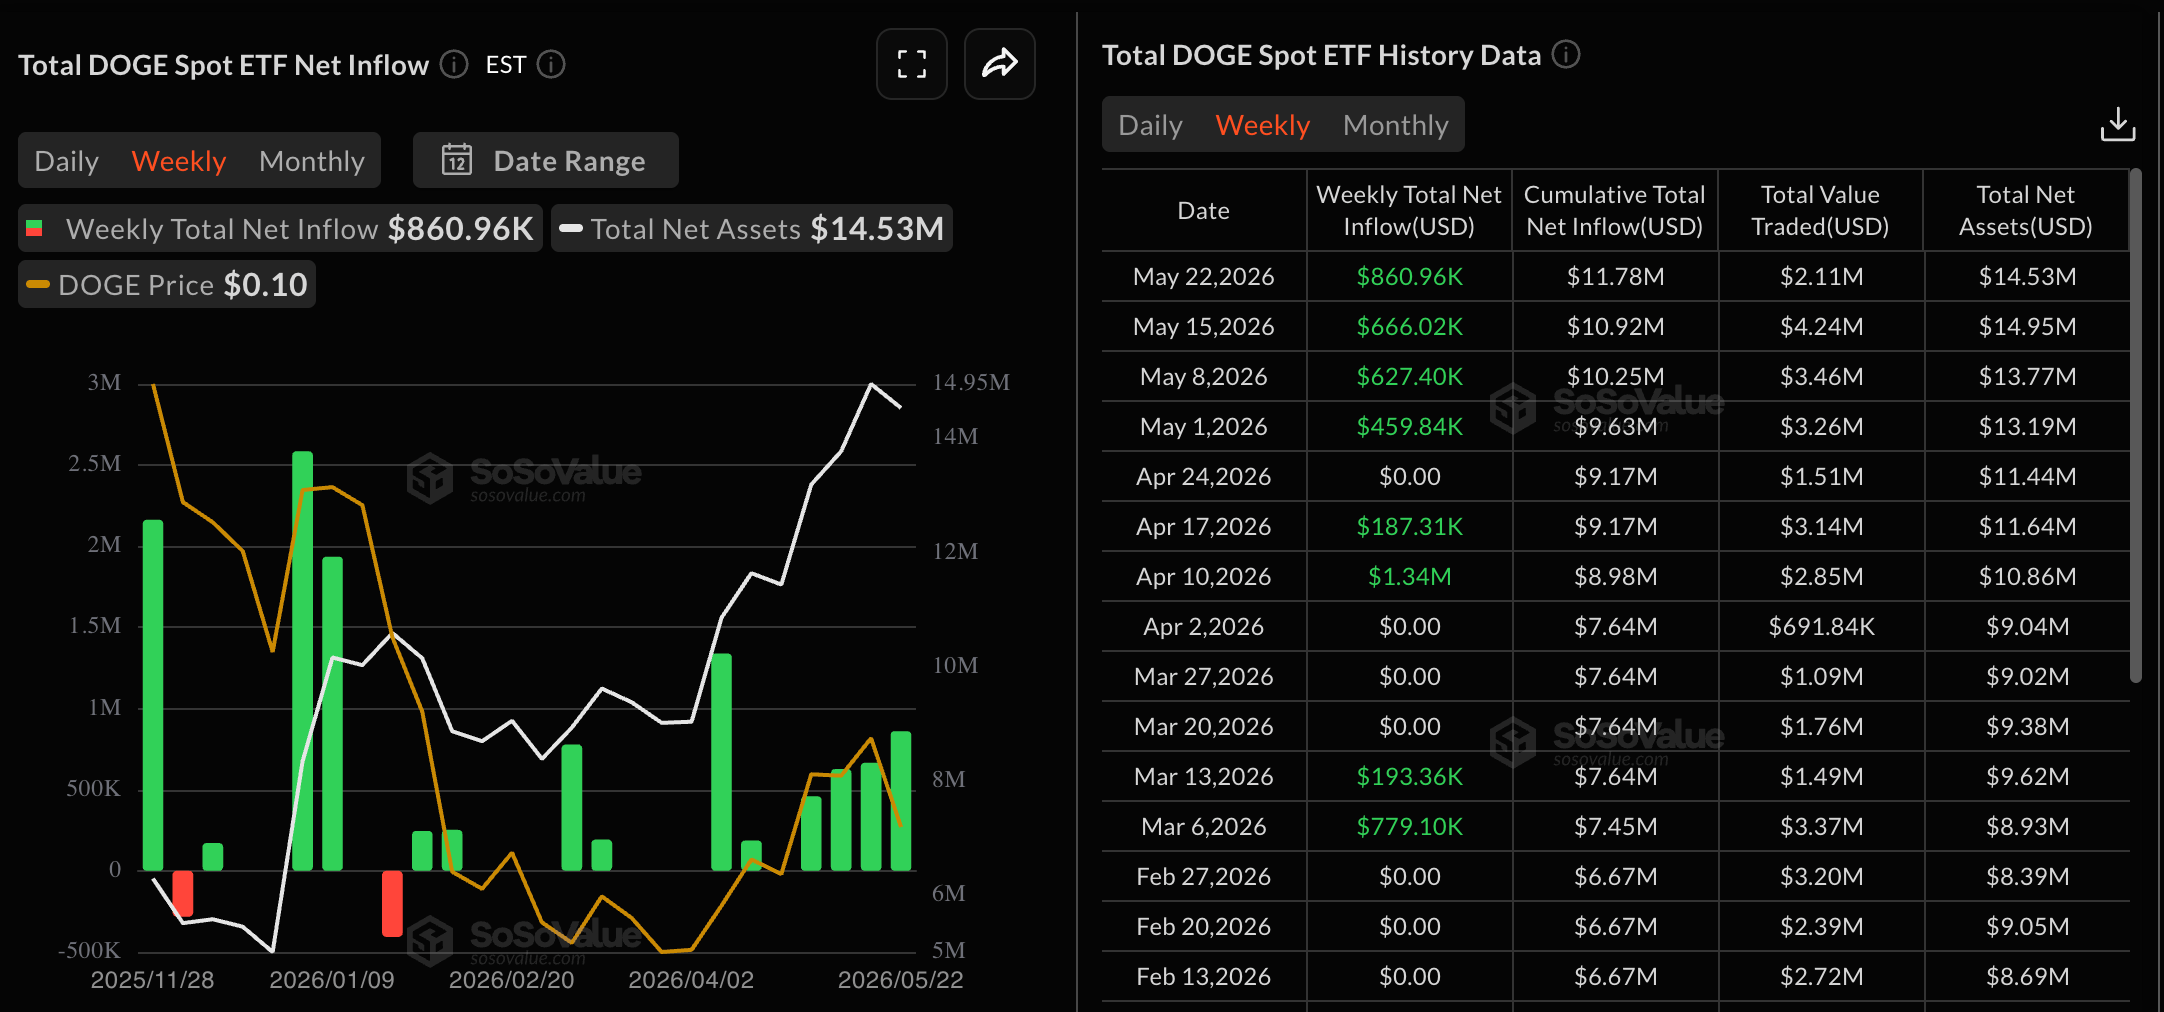
DOGE ETF data. Source: Sosovalue

On the derivatives side, the retail activity remains muted. CoinGlass data shows DOGE futures Open Interest (OI) is down to $1.31 billion on Tuesday, from its $1.77 billion peak on May 6, reaffirming a declining trend in leverage-driven activity amid cooling speculation.
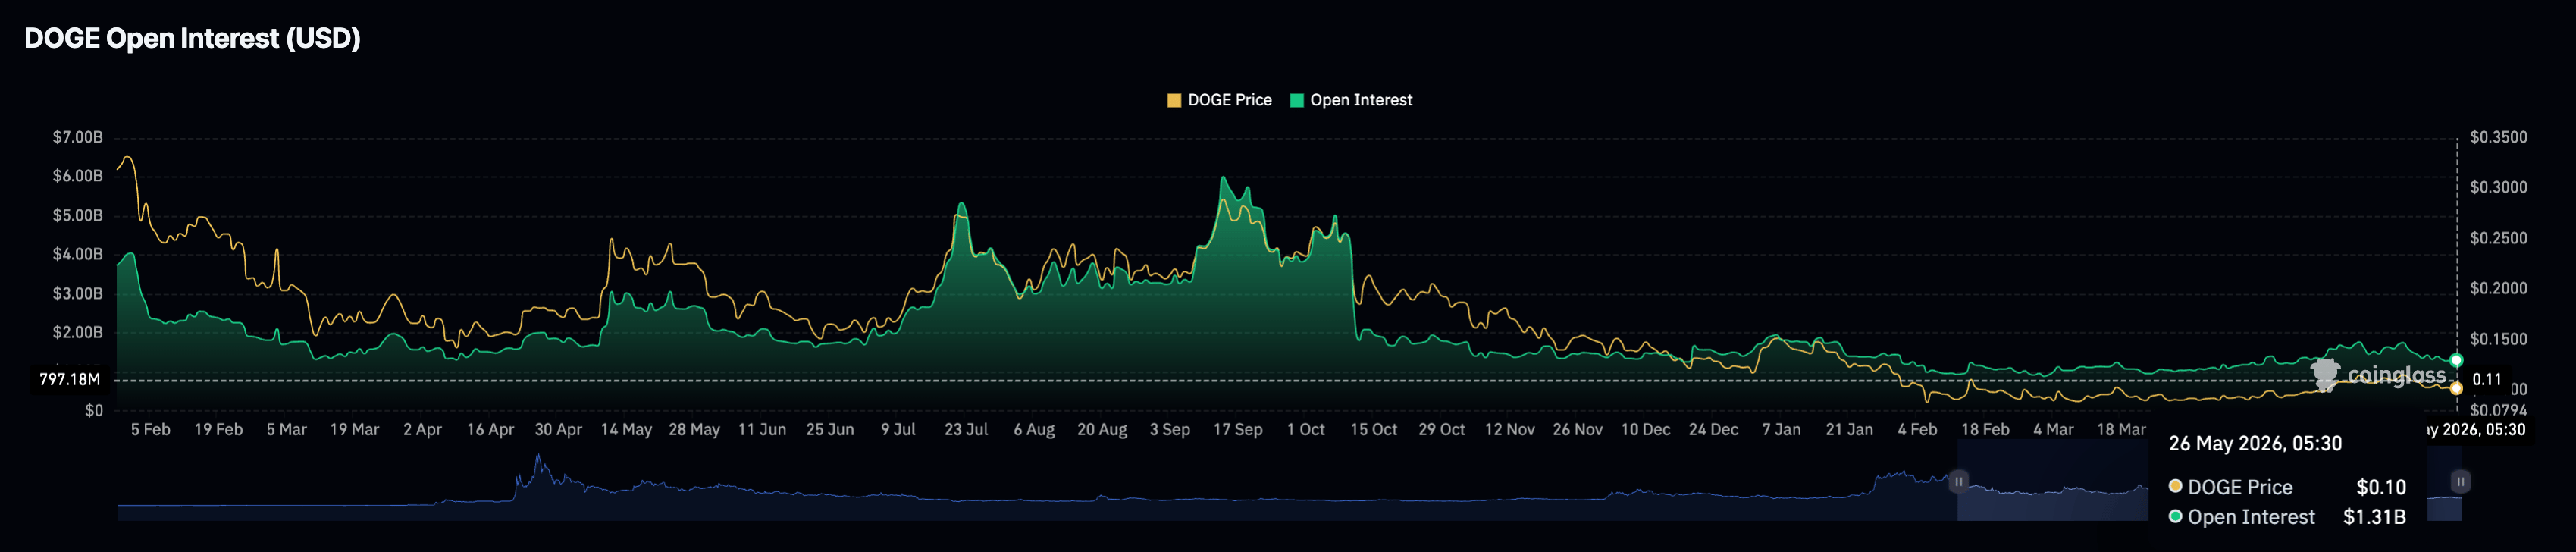
DOGE Open Interest chart. Source: CoinGlass

Dogecoin threatens a drop below $0.1000

Dogecoin hovers above $0.1000 at press time on Tuesday, keeping a bearish near-term bias. DOGE remains below the 50-, 100-, and 200-day Exponential Moving Average (EMA) at $0.1036, $0.1059, and $0.1205, respectively, reaffirming the bearish bias.

Momentum indicators support the soft tone in Dogecoin, with the Relative Strength Index (RSI) at 41 on the daily chart, declining below the midline and indicating further downside potential before reaching the oversold zone. Meanwhile, the Moving Average Convergence Divergence (MACD) and signal line slip into the negative territory, suggesting lingering downside pressure.

Looking down, the initial support sits at the psychological level of $0.1000. A sustained break beneath this floor would expose the pair to deeper losses, potentially targeting the February 11 low at $0.0879.

Chart Analysis DOGE/USDT (Binance)
DOGE/USDT daily price chart.

On the topside, immediate resistance is seen at the 50-day EMA around $0.1036, followed by the 100-day EMA at $0.1059.

(The technical analysis of this story was written with the help of an AI tool.)

Tuyên bố miễn trừ trách nhiệm: Chỉ dành cho mục đích thông tin. Hiệu suất trong quá khứ không đảm bảo cho kết quả trong tương lai.
placeholder
NZD/USD bám sát mức tăng mạnh do dữ liệu CPI của New Zealand/Trung Quốc; vẫn dưới mức giữa 0,5700sCặp NZD/USD ghi nhận một số động lực tích cực vào đầu tuần mới sau khi công bố các số liệu lạm phát tiêu dùng mới nhất từ New Zealand. Tuy nhiên, giá giao ngay thiếu lực mua tiếp theo và vẫn dưới mức giữa 0,5700 trong phiên giao dịch châu Á.
Tác giả  FXStreet
ngày20 tháng 10 năm 2025
Cặp NZD/USD ghi nhận một số động lực tích cực vào đầu tuần mới sau khi công bố các số liệu lạm phát tiêu dùng mới nhất từ New Zealand. Tuy nhiên, giá giao ngay thiếu lực mua tiếp theo và vẫn dưới mức giữa 0,5700 trong phiên giao dịch châu Á.
placeholder
Forex hôm nay: Trọng tâm chuyển sang đàm phán Mỹ-Iran, dữ liệu Chỉ số người quản trị mua hàng (PMI) từ các nền kinh tế lớnDưới đây là những điều bạn cần biết vào thứ Năm, ngày 21 tháng 5
Tác giả  FXStreet
5 tháng 21 ngày Thứ Năm
Dưới đây là những điều bạn cần biết vào thứ Năm, ngày 21 tháng 5
placeholder
Dự báo giá bạc: XAG/USD giữ đà tăng gần mức 78,50$ nhờ lạc quan về thỏa thuận Mỹ-IranGiá bạc (XAG/USD) tăng gần 4% sau khi ghi nhận mức lỗ vào ngày trước đó, giao dịch quanh mức 78,50$/ounce troy trong phiên giao dịch châu Á vào thứ Hai
Tác giả  FXStreet
Hôm qua 02: 21
Giá bạc (XAG/USD) tăng gần 4% sau khi ghi nhận mức lỗ vào ngày trước đó, giao dịch quanh mức 78,50$/ounce troy trong phiên giao dịch châu Á vào thứ Hai
placeholder
Giá dầu WTI giảm 6% trong một ngày: Giá dầu WTI lao dốc do hy vọng mở cửa trở lại HormuzWest Texas Intermediate (WTI), hợp đồng tương lai trên NYMEX, giảm 6% xuống gần 90$ trong phiên giao dịch châu Âu hôm thứ Hai, mức thấp nhất trong hơn hai tuần qua
Tác giả  FXStreet
22 giờ trước
West Texas Intermediate (WTI), hợp đồng tương lai trên NYMEX, giảm 6% xuống gần 90$ trong phiên giao dịch châu Âu hôm thứ Hai, mức thấp nhất trong hơn hai tuần qua
placeholder
WTI phục hồi lên mức 91,00$ khi lực lượng Mỹ tiến hành các cuộc không kích ở miền nam IranGiá dầu West Texas Intermediate (WTI) tăng trở lại sau bốn ngày giảm, giao dịch quanh mức 90,60$/thùng trong giờ châu Á vào thứ Ba. Giá dầu thô tăng do lo ngại về nguồn cung tái diễn sau khi lực lượng Hoa Kỳ (Mỹ) tiến hành các cuộc tấn công tự vệ ở miền nam Iran vào thứ Hai.
Tác giả  FXStreet
4 giờ trước
Giá dầu West Texas Intermediate (WTI) tăng trở lại sau bốn ngày giảm, giao dịch quanh mức 90,60$/thùng trong giờ châu Á vào thứ Ba. Giá dầu thô tăng do lo ngại về nguồn cung tái diễn sau khi lực lượng Hoa Kỳ (Mỹ) tiến hành các cuộc tấn công tự vệ ở miền nam Iran vào thứ Hai.
sản phẩm liên quan
goTop
quote