

Zcash Price Forecast: ZEC’s pullback targets $300 despite steady retail interest
- Zcash trades lower toward $300 support as the US-Iran ceasefire edginess keeps the broader crypto market in defensive mode.
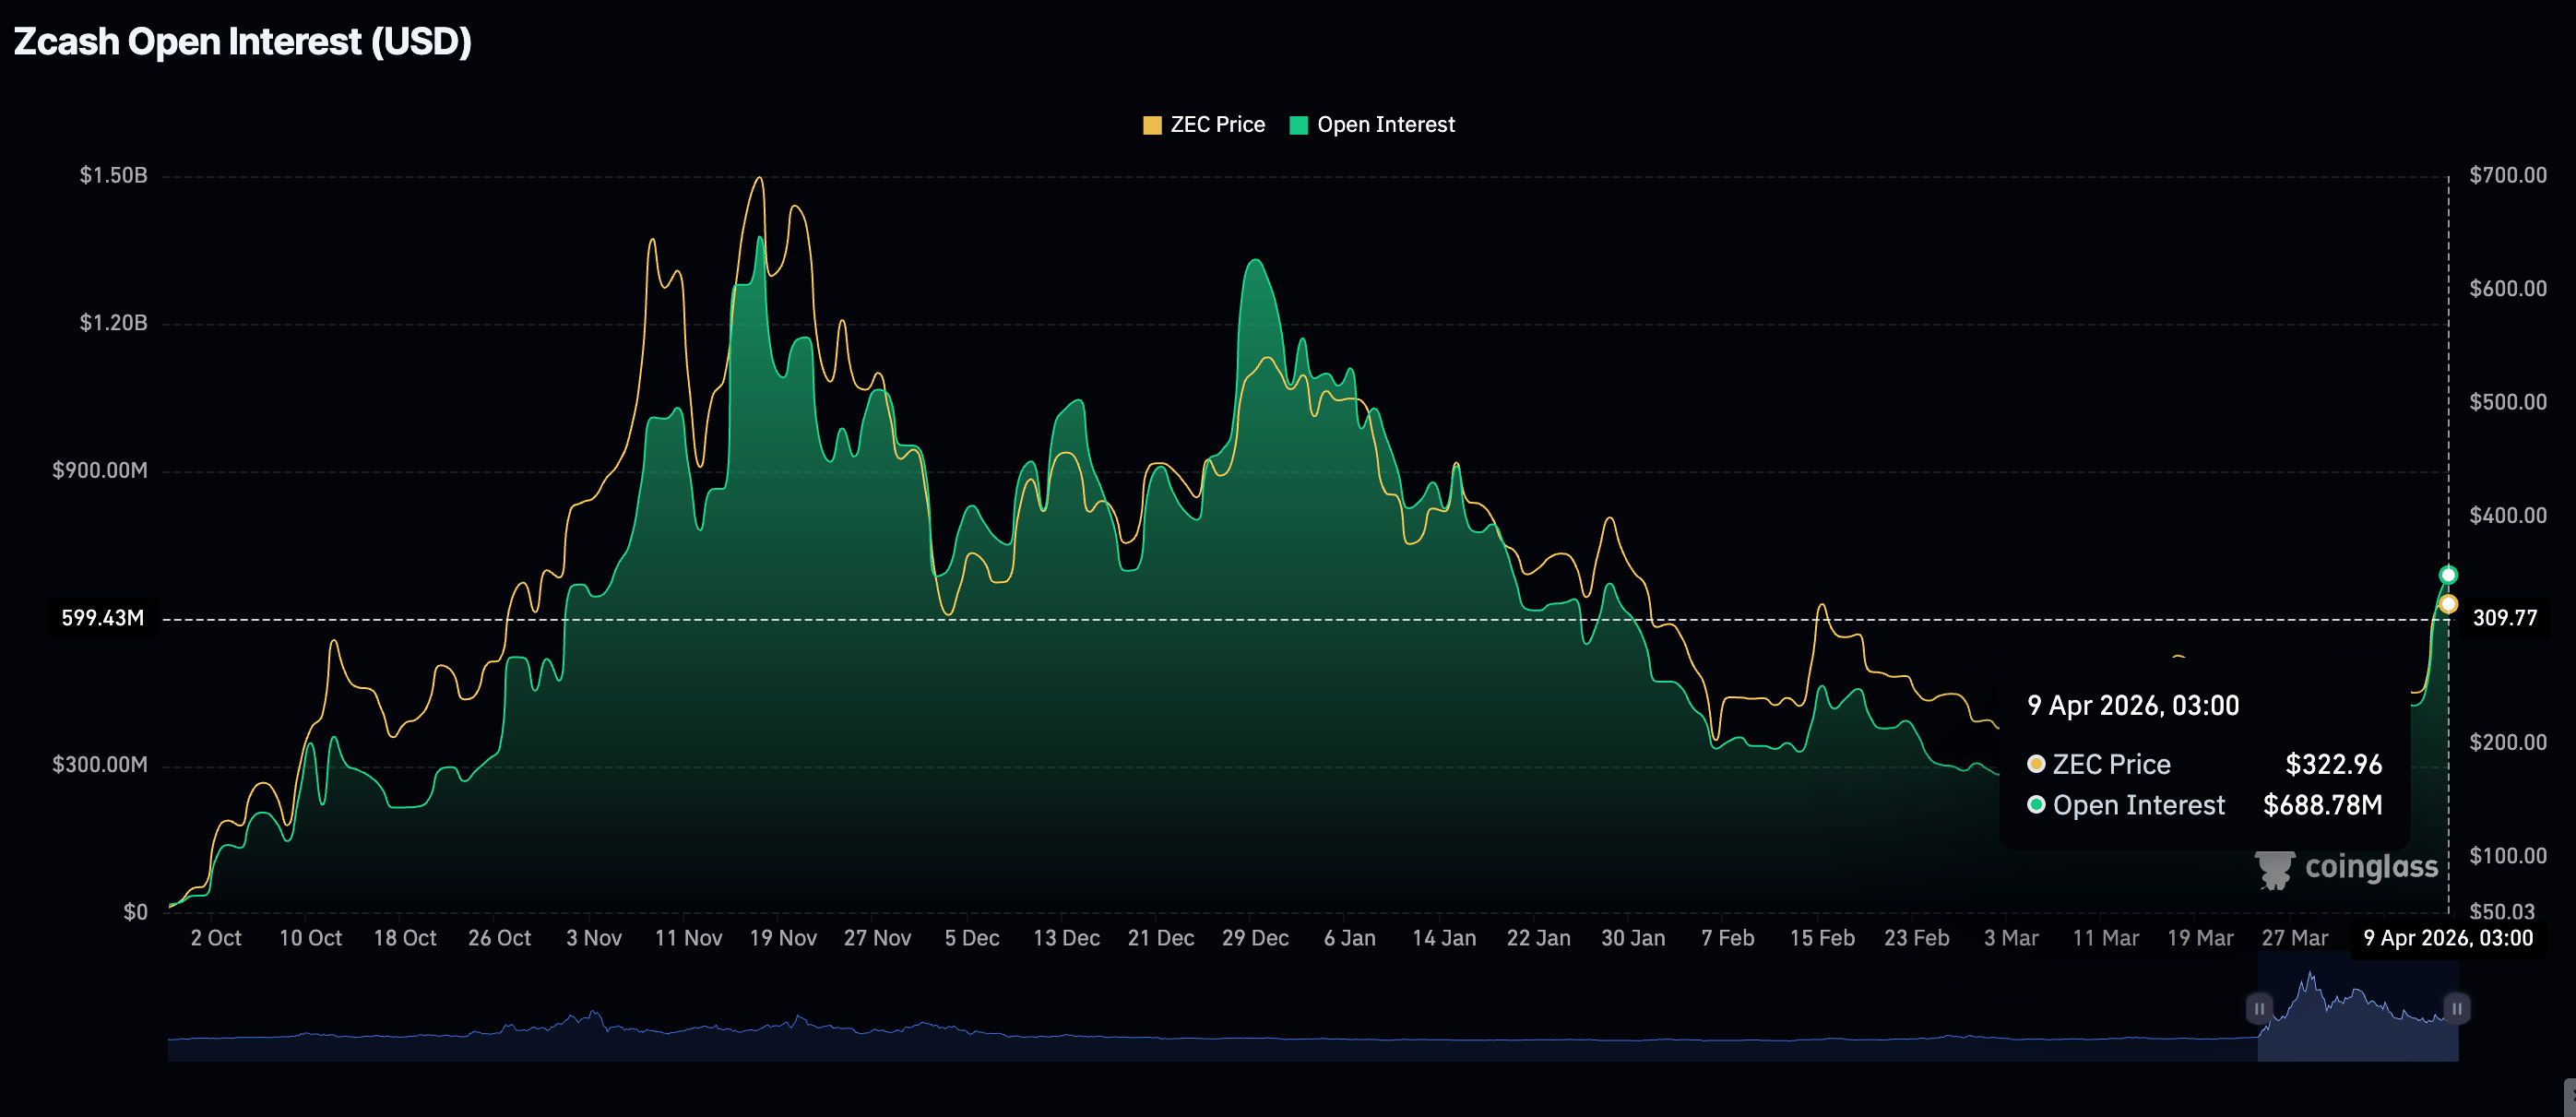
- ZEC’s retail demand remains elevated, with futures Open Interest steady near $689 million.
- The RSI falls from overbought territory, suggesting early profit-taking as major moving averages hold as support levels.
Zcash (ZEC), the privacy-oriented token, is trading lower at $312 at the time of writing on Thursday, weighed down by deteriorating sentiment across the crypto market due to an uneasy ceasefire between the United States (US) and Iran.
ZEC peaked at a weekly high of $340 on Wednesday before succumbing to selling pressure, largely driven by profit-taking as investors reduced their risk exposure. If the risk-off mood persists, ZCash could extend its correction toward the $300 psychological level.
Zcash sees sustained retail demand
Retail interest in Zcash continued to grow over the last few days, driving futures Open Interest (OI) to $689 million on Thursday, up from roughly $628 million the previous day. CoinGlass data reinforces the bullish outlook, as the OI averaged $422 million on Monday. If demand continues to expand, Zcash will likely resume its uptrend, targeting a breakout above $400 for the first time since late January.
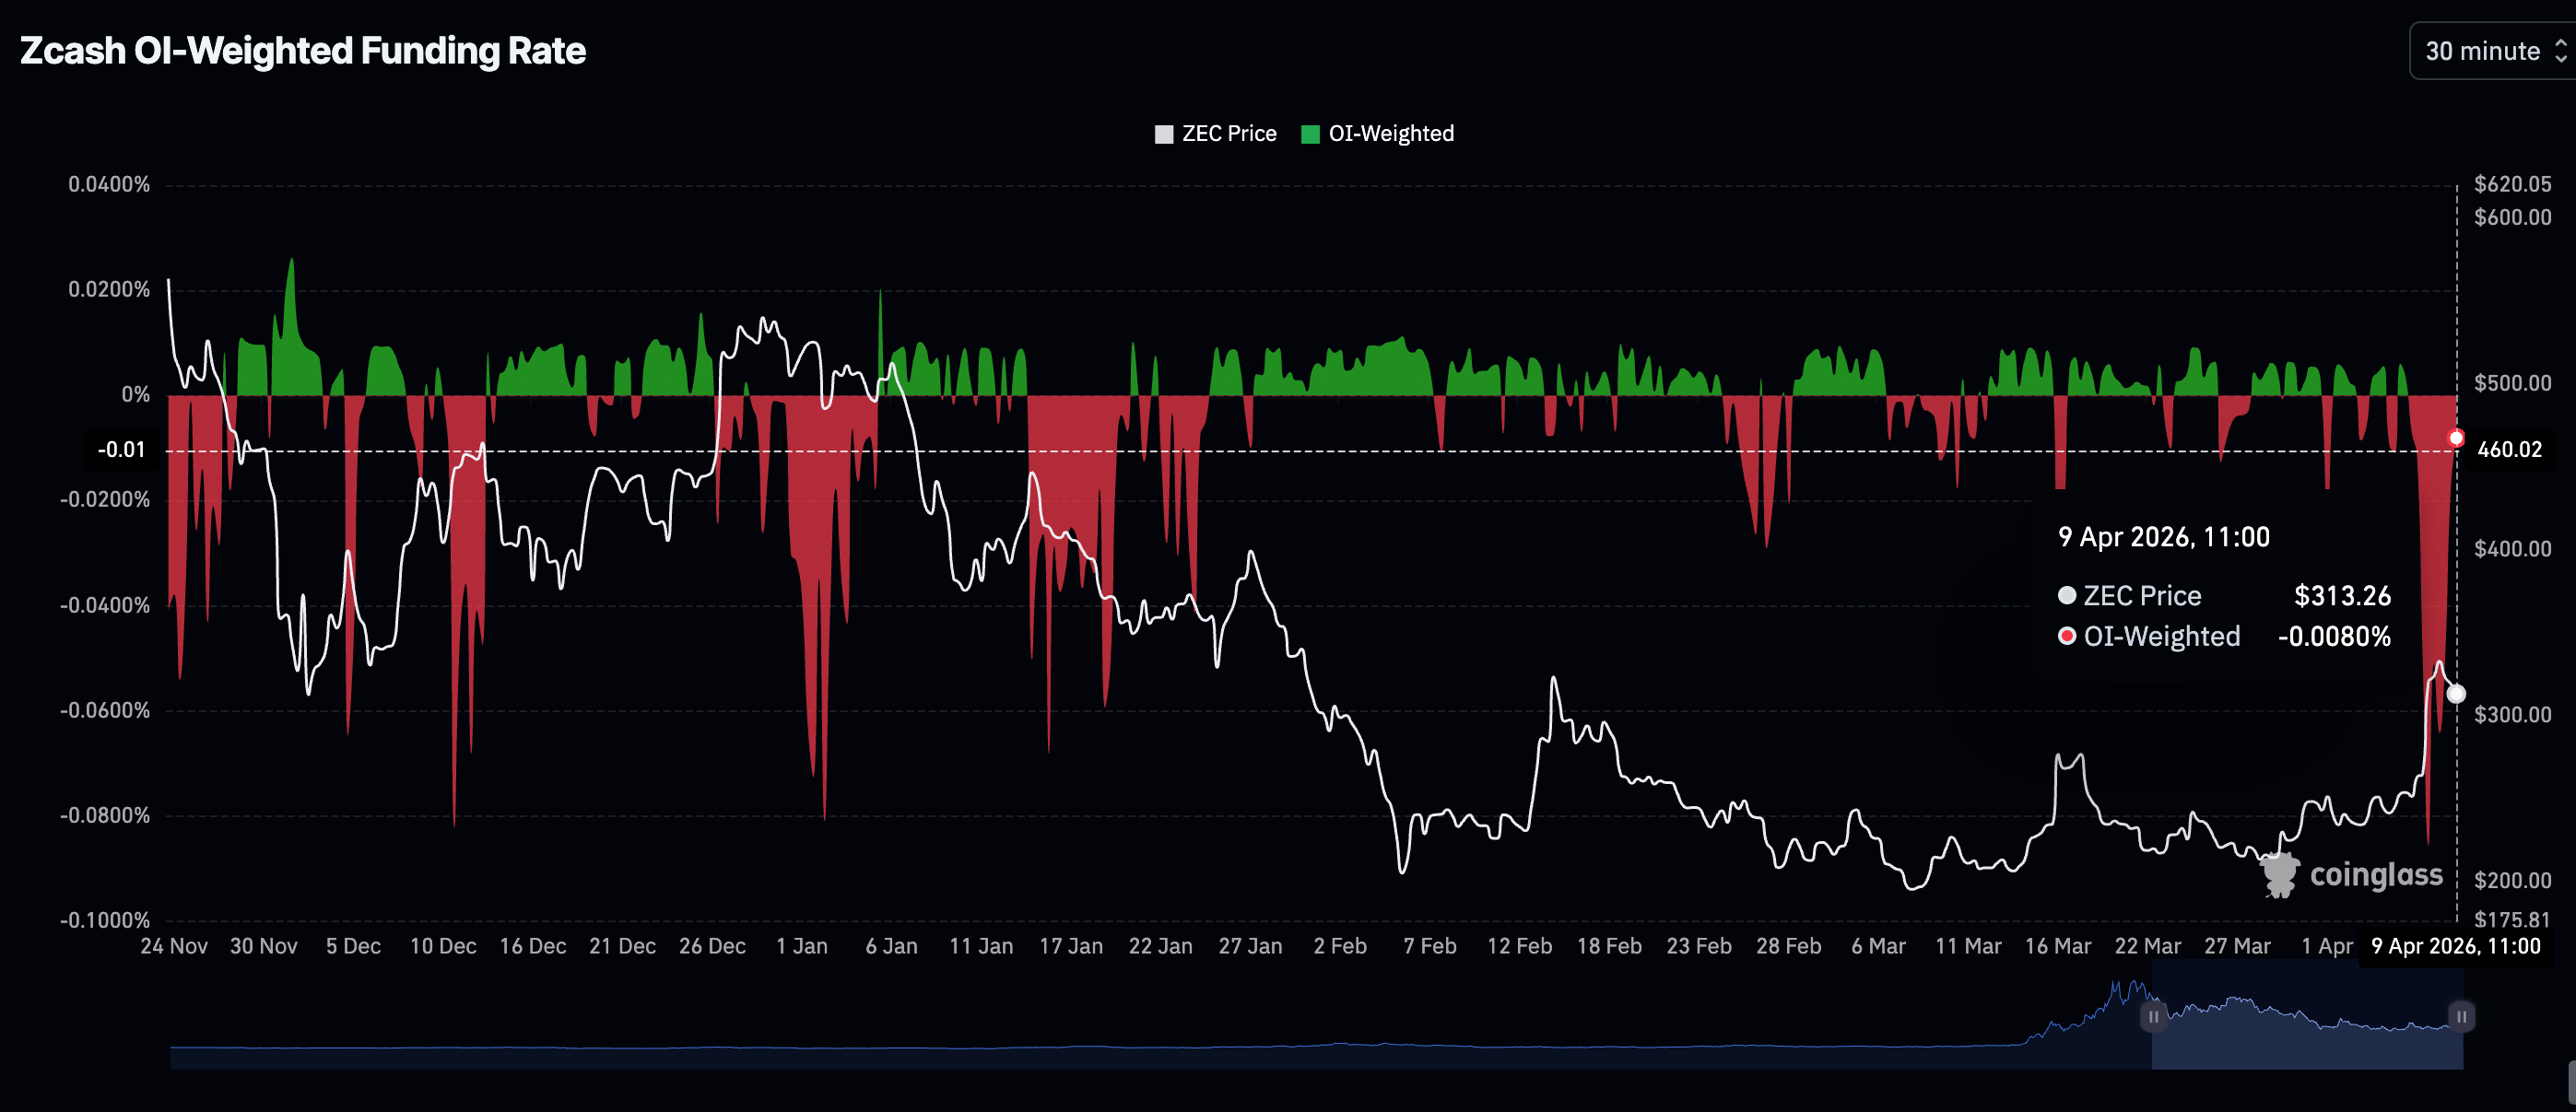
Meanwhile, traders appear to be losing conviction in ZEC’s ability to sustain its upswing, which may explain the surge in bearish bets, keeping the futures Open Interest (OI) weighted funding rate negative at -0.0080% on Thursday, down from 0.0064% the previous day. If the outlook fails to improve, pressure will continue to weigh on Zcash, risking confinement in a broader downtrend.
Technical outlook: Zcash eyes higher support amid pressure
Zcash is trading around $312, extending a bullish near-term bias as price holds well above the 50-day, 100-day, and 200-day Exponential Moving Averages (EMAs), clustered between roughly $256 and $280. The break and subsequent advance above the long-running downward resistance trend line, whose break point sits near $207, reinforces a constructive structural backdrop, while the Relative Strength Index (RSI) at about 67 on the daily chart shows strong but not yet extreme momentum.
At the same time, the Moving Average Convergence Divergence (MACD) indicator remains firmly positive on the same chart, with its latest reading elevated, suggesting that bullish pressure remains dominant despite the recent overextended surge.
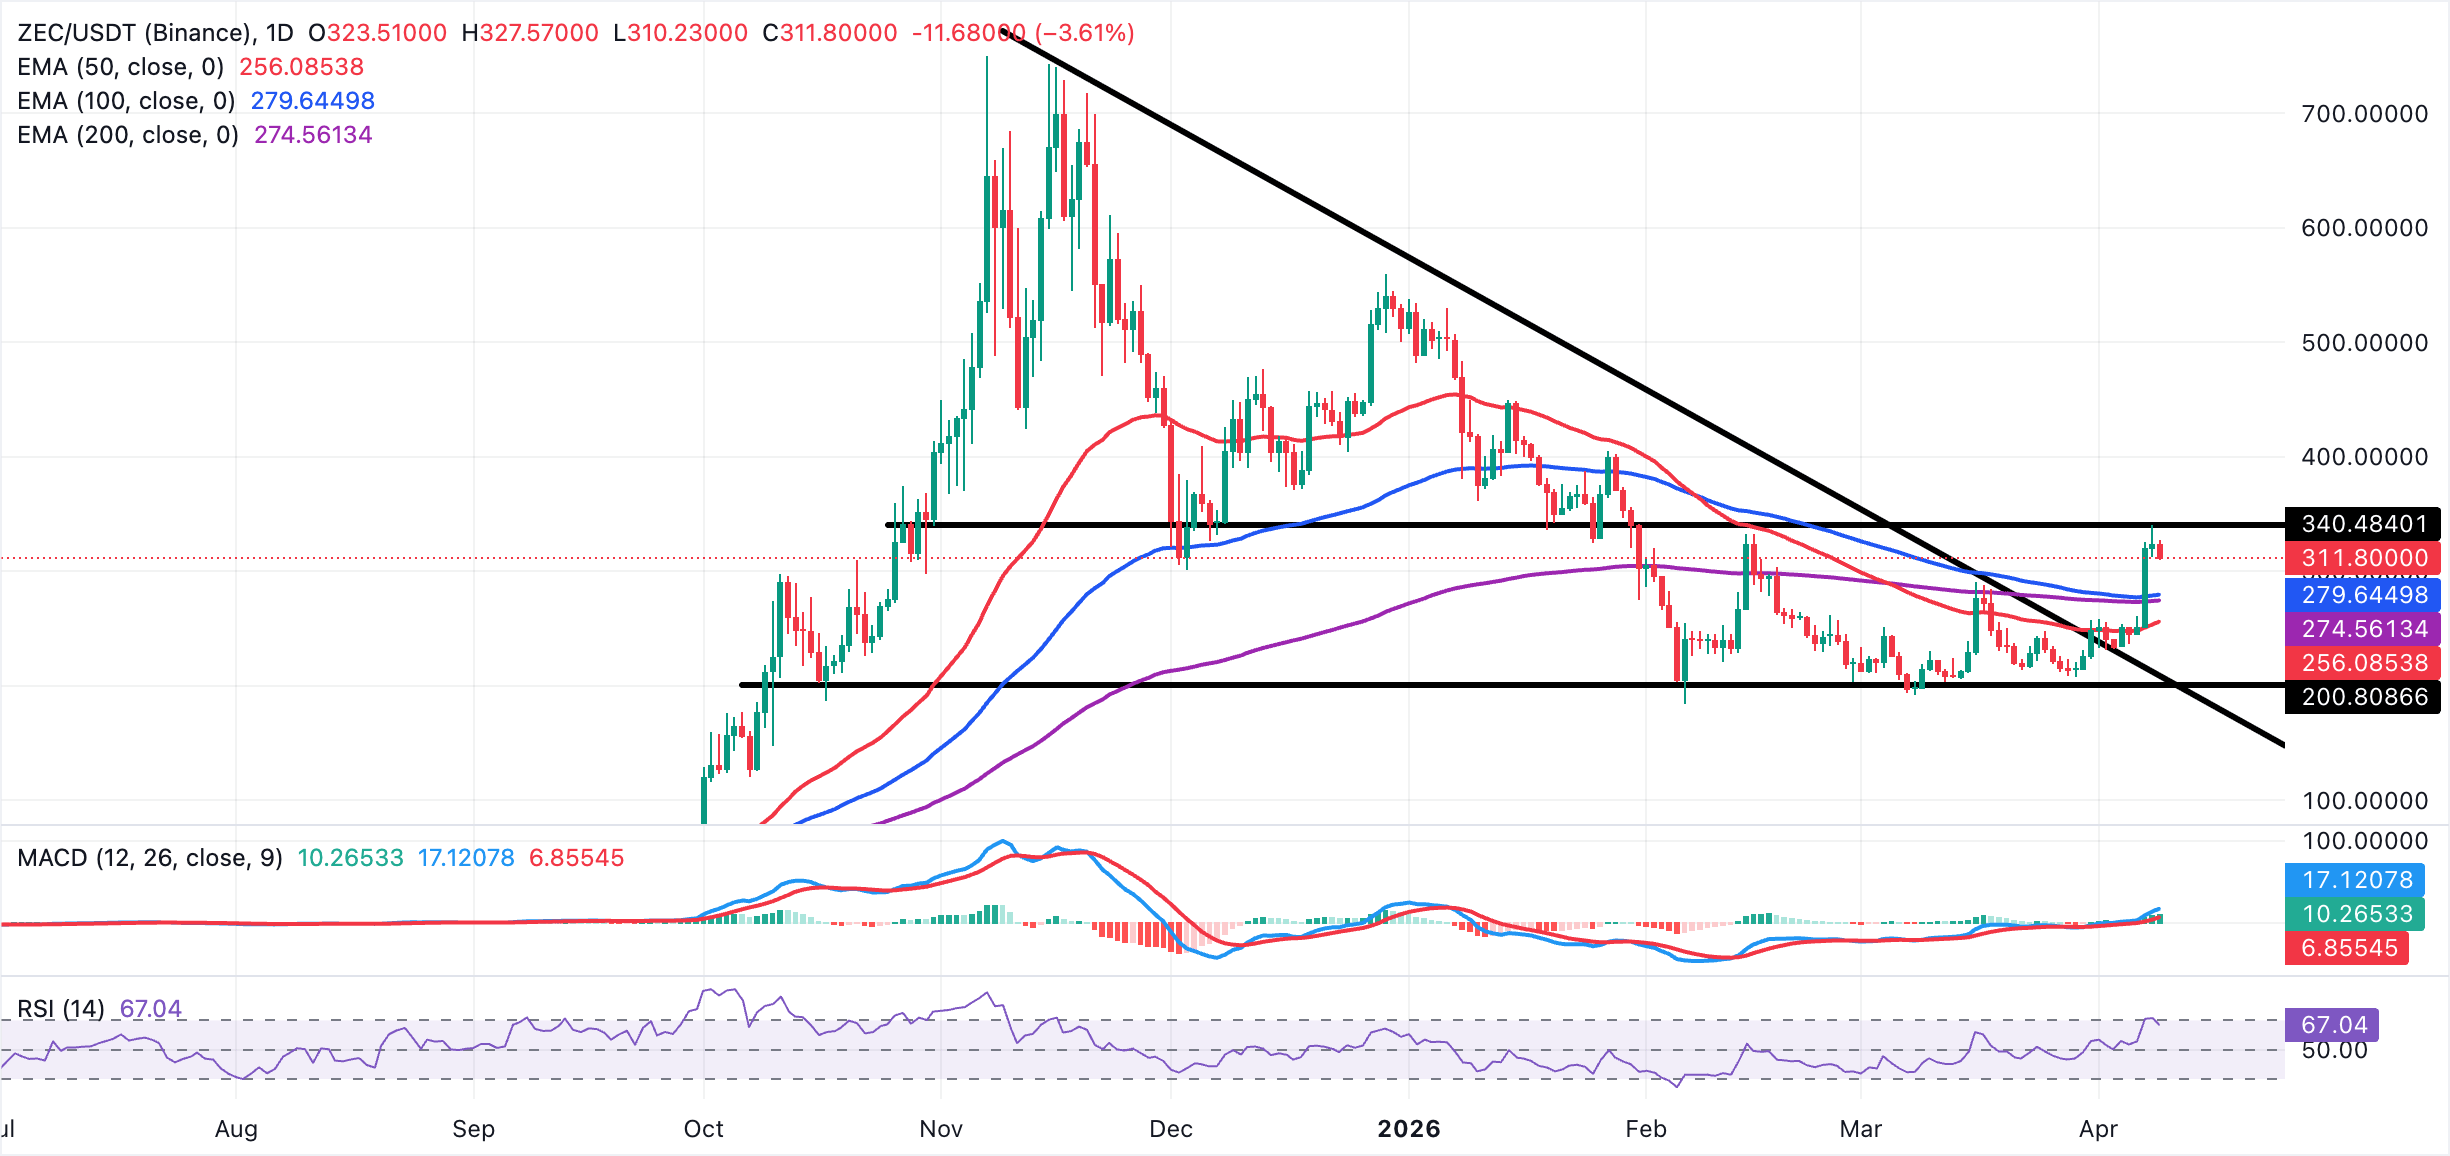
On the downside, ZEC's initial support is now seen at the recent price pivot around $300, where any shallow pullback could attempt to stabilize. Below that, a more meaningful support zone emerges from the 100-day EMA near $280 down to the 200-day EMA around $275, with the 50-day EMA lower at $256 offering an additional dynamic floor. Losing this broader band would expose the broken downward trendline area near $207 as the next major support region.
With no nearby technical resistance levels defined by the current dataset, the Zcash’s topside remains open, leaving any fresh highs to be shaped by market appetite rather than pre-established chart barriers.
Open Interest, funding rate FAQs
Higher Open Interest is associated with higher liquidity and new capital inflow to the market. This is considered the equivalent of increase in efficiency and the ongoing trend continues. When Open Interest decreases, it is considered a sign of liquidation in the market, investors are leaving and the overall demand for an asset is on a decline, fueling a bearish sentiment among investors.
Funding fees bridge the difference between spot prices and prices of futures contracts of an asset by increasing liquidation risks faced by traders. A consistently high and positive funding rate implies there is a bullish sentiment among market participants and there is an expectation of a price hike. A consistently negative funding rate for an asset implies a bearish sentiment, indicating that traders expect the cryptocurrency’s price to fall and a bearish trend reversal is likely to occur.
(The technical analysis of this story was written with the help of an AI tool.)
Bài viết đề xuất


