Cardano Price Forecast: ADA derivatives flag bull trap risk

Nguồn Fxstreet
  • Cardano recovers on Wednesday, extending a consolidating move near $0.2500.
  • Derivatives data shows an increase in Open Interest, while funding rates and heightened long liquidations reflect bearish sentiment.
  • The technical outlook is mildly bearish, as the RSI and MACD indicators continue to signal downside pressure.

Cardano (ADA) extends gains at press time on Wednesday as the broader cryptocurrency market carries the weight of the US-Iran war. Derivatives data signals a bearish incline among traders anticipating a reversal of the near-term recovery. Technically, ADA is at risk of a steeper correction as the RSI and MACD indicators flag persistent downside momentum.

Bearish sentiment dominates ADA derivatives

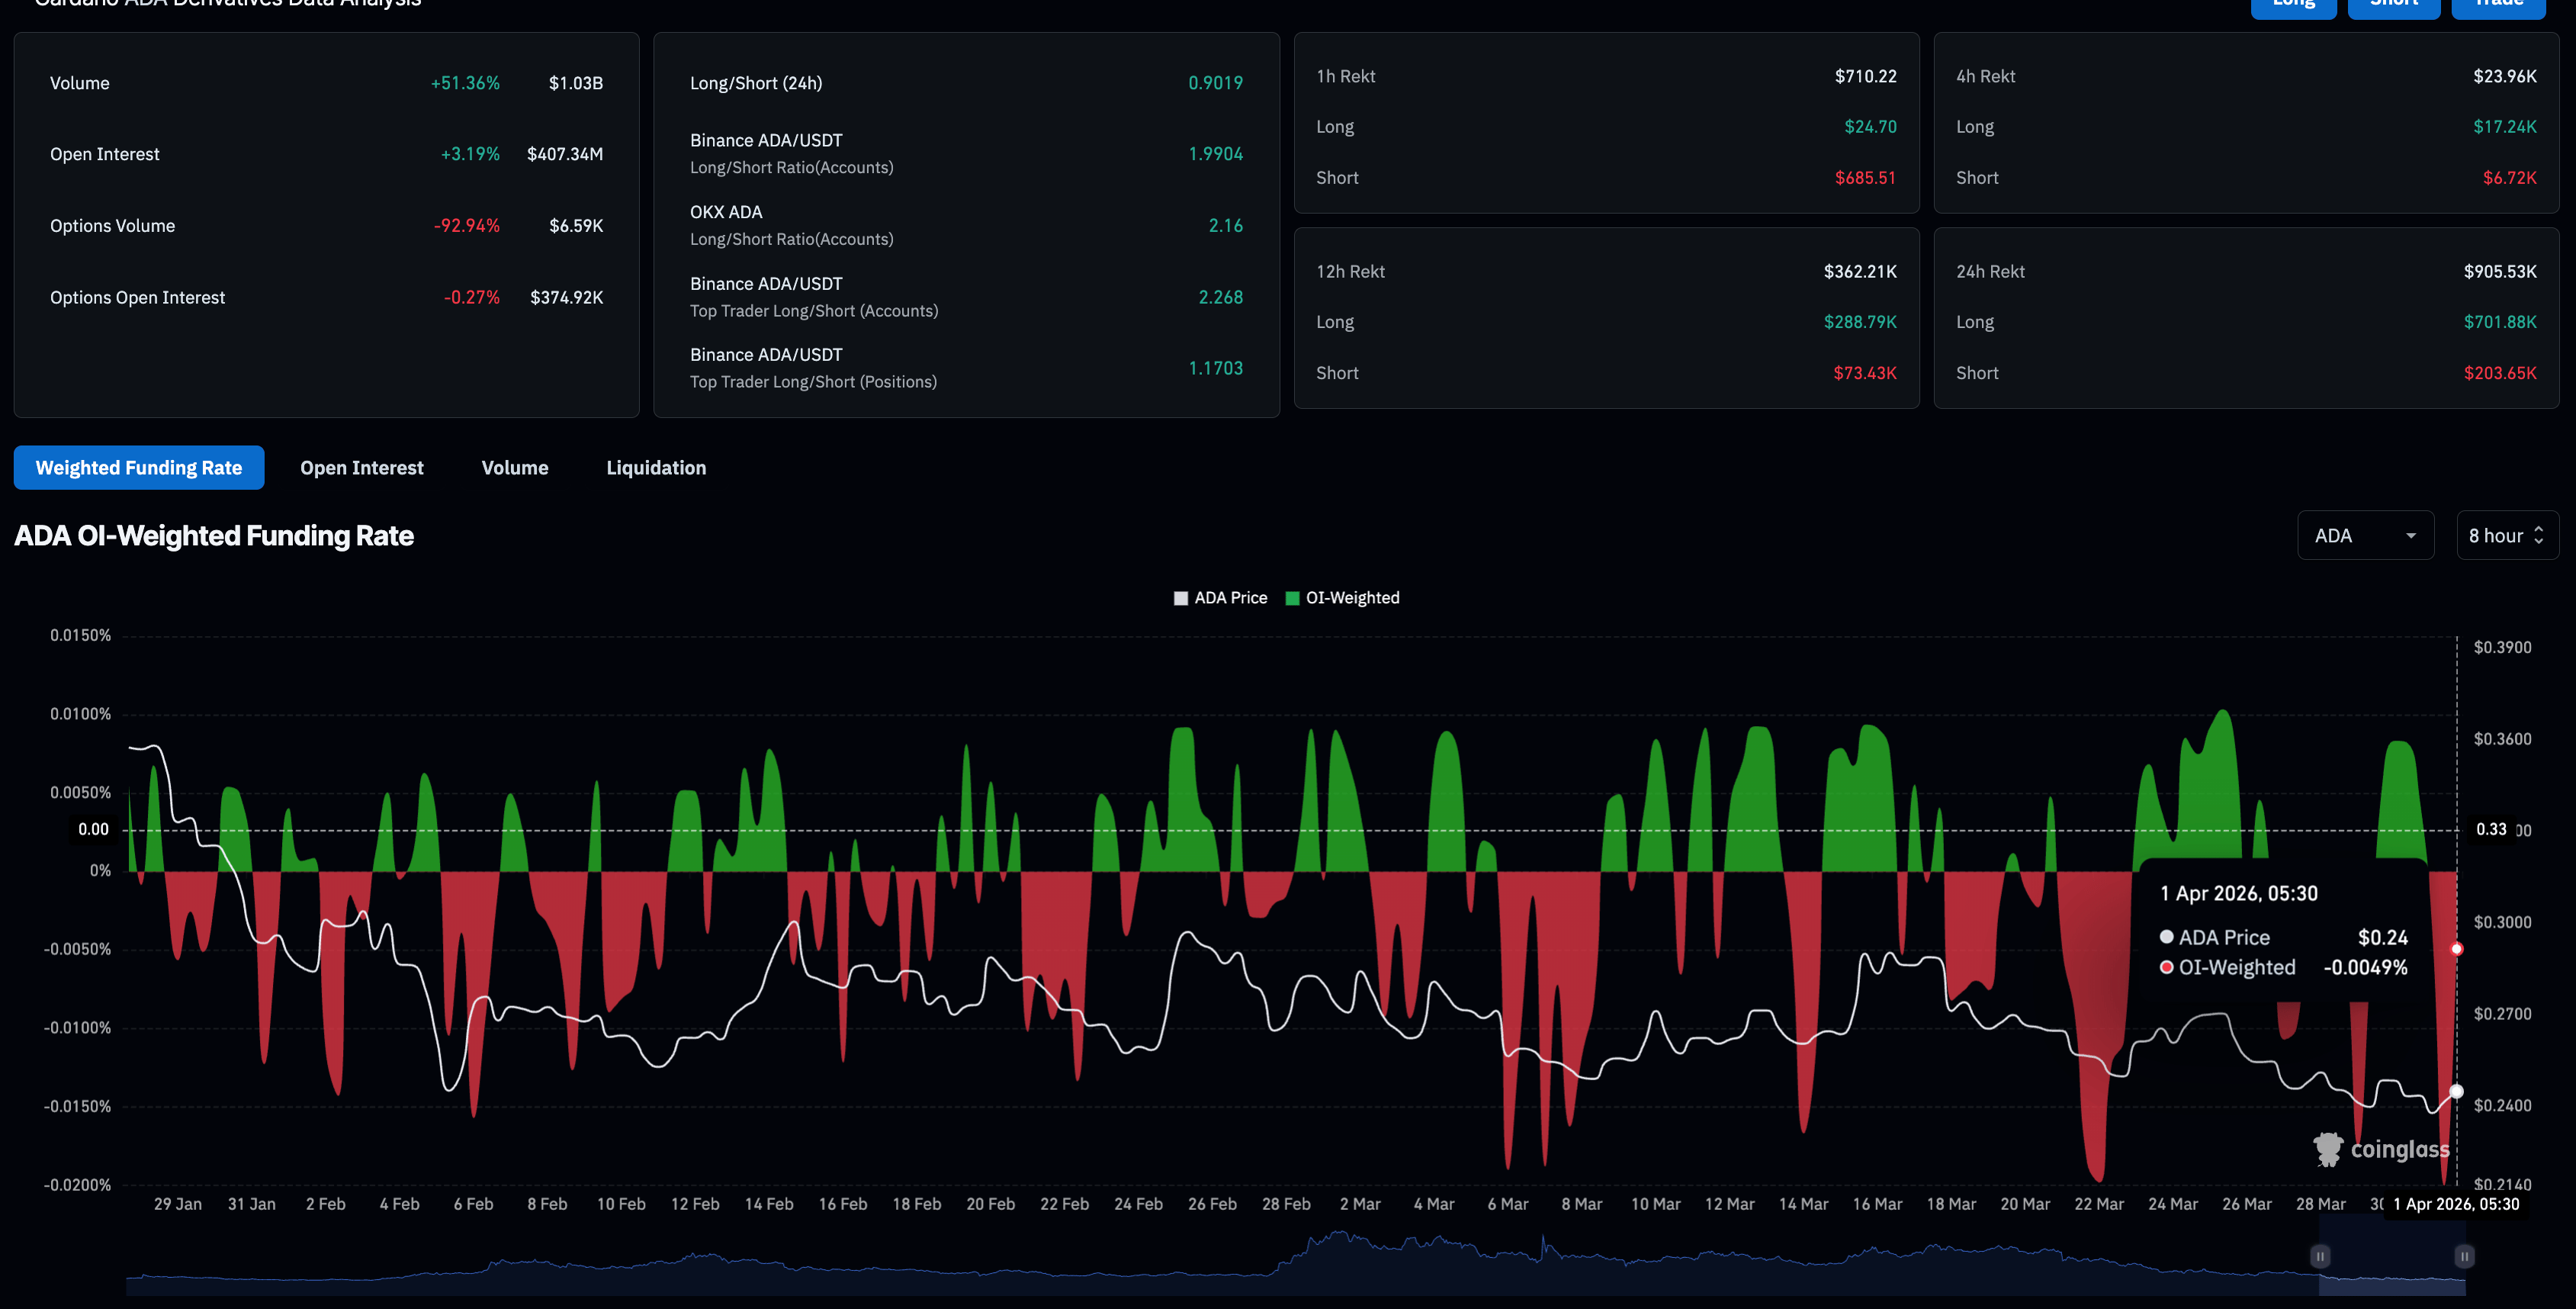
Cardano derivatives have seen a surge in capital inflows over the last 24 hours, but market conditions flag bearish pressure. CoinGlass data shows an over 3% increase in ADA futures Open Interest (OI) over the same period, reaching $407.34 million, indicating a rise in the notional value of outstanding perpetual contracts. 

However, this positional buildup lacks a directional signal. The negative funding rate of -0.0049% and liquidations over the past 24 hours totaling $905,530, led by $701,880 in long liquidations, reveal a bearish tilt in the derivatives market.

Despite the intraday recovery, the bearish buildup in ADA derivatives suggests traders anticipate a further correction, which could trap near-term bulls.

ADA derivatives data. Source: CoinGlass

Technical outlook: Will Cardano sustain its recovery?

Cardano extends a broadly sideways trend after the 2% decline on Sunday. At the time of writing, Cardano is up over 1% on Wednesday, approaching the $0.2500 level.

Still, the near-term bias is mildly bearish as price holds below the declining 50-, 100- and 200-day Exponential Moving Averages (EMAs), reinforcing a dominant downtrend.

The Moving Average Convergence Divergence (MACD) slips below the signal line, extending the negative histogram bars, suggesting persistent but not aggressive selling pressure. The Relative Strength Index (RSI) at 41 stays below the 50 mark, aligning with subdued bullish momentum and favoring downside risk while this configuration persists.

Looking down, a bearish close to the day would likely extend ADA's decline to the February 6 low at $0.2205, close to the S1 Pivot Point at $0.2179. A decisive close below this cluster would open the door to the S2 Pivot Point at $0.1940.

Chart Analysis ADA/USDT (Binance)
ADA/USDT daily price chart.

Immediate resistance for ADA emerges at the 50-day EMA at $0.2738, close to the R1 Pivot Point at $0.2806. Beyond this supply zone, the crucial resistance level caps the upside structure, keeping rallies contained below the February 2 close at $0.2991.

(The technical analysis of this story was written with the help of an AI tool.)

Tuyên bố miễn trừ trách nhiệm: Chỉ dành cho mục đích thông tin. Hiệu suất trong quá khứ không đảm bảo cho kết quả trong tương lai.
placeholder
Dự báo xu hướng giá vàng: Các cuộc đàm phán hòa bình Mỹ-Iran thúc đẩy giá vàng phục hồi, liệu đợt sụt giảm của giá vàng đã kết thúc? Tính đến phiên giao dịch châu Á ngày 12/6, giá vàng ( XAUUSD) dao động giảm quanh ngưỡng 4.180 USD. Hôm qua, giá vàng đã có lúc giảm nhẹ về vùng 4.000 USD trước khi bật tăng mạnh trở lại
Tác giả  FXStreet
12 giờ trước
Tính đến phiên giao dịch châu Á ngày 12/6, giá vàng ( XAUUSD) dao động giảm quanh ngưỡng 4.180 USD. Hôm qua, giá vàng đã có lúc giảm nhẹ về vùng 4.000 USD trước khi bật tăng mạnh trở lại
placeholder
WTI ổn định quanh 85,00$ khi Trump chỉ ra khả năng đạt thỏa thuận với IranGiá dầu West Texas Intermediate (WTI) vẫn duy trì ở mức thấp sau khi ghi nhận mức lỗ trên 5,5% trong ngày trước đó, giao dịch quanh mức 85,00$/thùng trong giờ châu Á vào thứ Sáu
Tác giả  FXStreet
20 giờ trước
Giá dầu West Texas Intermediate (WTI) vẫn duy trì ở mức thấp sau khi ghi nhận mức lỗ trên 5,5% trong ngày trước đó, giao dịch quanh mức 85,00$/thùng trong giờ châu Á vào thứ Sáu
placeholder
Niêm yết SpaceX đang cận kề. Dòng vốn ồ ạt chảy vào các token on-chain của SpaceX, đà phục hồi của Bitcoin có thể bị suy yếu Các hợp đồng vĩnh cửu và token tiền thị trường của SpaceX đang thu hút thanh khoản từ thị trường tiền điện tử, gây cản trở cho đà hồi phục tiếp theo của Bitcoin.Vào ngày 11/6, Bitcoin ( B
Tác giả  TradingKey
Hôm qua 08: 35
Các hợp đồng vĩnh cửu và token tiền thị trường của SpaceX đang thu hút thanh khoản từ thị trường tiền điện tử, gây cản trở cho đà hồi phục tiếp theo của Bitcoin.Vào ngày 11/6, Bitcoin ( B
placeholder
Giá vàng duy trì mong manh ngưỡng 4.000 USD, khi nào đợt bán tháo kim loại quý sẽ dừng lại?Vào ngày 10/6 theo giờ miền Đông, giá vàng giao ngay ( XAUUSD) đã giảm xuyên thủng mốc 4.100 USD trong phiên giao dịch sau bốn phiên bán ra liên tiếp, tiến sát ngưỡng tâm lý 4.000 USD; đợ
Tác giả  TradingKey
Hôm qua 02: 30
Vào ngày 10/6 theo giờ miền Đông, giá vàng giao ngay ( XAUUSD) đã giảm xuyên thủng mốc 4.100 USD trong phiên giao dịch sau bốn phiên bán ra liên tiếp, tiến sát ngưỡng tâm lý 4.000 USD; đợ
placeholder
Vàng lao dốc xuống dưới 4.200$ khi căng thẳng Mỹ-Iran thúc đẩy kỳ vọng lãi suất diều hâu trước thềm CPI của MỹVàng (XAU/USD) tiếp tục đà phá vỡ gần đây dưới Đường trung bình động giản đơn (SMA) 200 ngày có ý nghĩa kỹ thuật và giảm xuống mức thấp mới kể từ ngày 23 tháng 3, thấp hơn nữa mốc 4.200$ trong phiên giao dịch châu Á vào thứ Tư
Tác giả  FXStreet
6 tháng 10 ngày Thứ Tư
Vàng (XAU/USD) tiếp tục đà phá vỡ gần đây dưới Đường trung bình động giản đơn (SMA) 200 ngày có ý nghĩa kỹ thuật và giảm xuống mức thấp mới kể từ ngày 23 tháng 3, thấp hơn nữa mốc 4.200$ trong phiên giao dịch châu Á vào thứ Tư
sản phẩm liên quan
goTop
quote