

AI Tokens Price Predictions: FET, RENDER, TAO rally amid the rise of agentic AI systems
- Artificial Superintelligence Alliance rises 6% on Friday, extending its rally for the fifth consecutive day.
- Render is up 6% on Friday, bringing its weekly gains to more than 30% so far.
- Bittensor scales nearly 5% higher on Friday, extending its rally above $200.
Artificial Intelligence (AI) tokens in the cryptocurrency market have staged a sharp recovery so far this week, mainly driven by Artificial Superintelligence Alliance (FET), Render (RENDER), and Bittensor (TAO). The renewed demand for these AI tokens aligns with the rise of agentic systems worldwide, including the OpenClaw mania in China and new agent-based models from Anthropic, Google, and OpenAI.
The technical outlook for FET, RENDER, and TAO is optimistically bullish as the broader cryptocurrency market holds firm amid the US-Iran war and rising AI demand.
FET recovery run targets $0.20
FET is up 6% at press time on Friday, extending its weekly gains to roughly 35% so far. The near-term bias turns mildly bullish as FET rebounds from the recent swing low near $0.1400 and surpasses the 50-day Exponential Moving Average (EMA) at $0.1768.
Still, the 100- and 200-day EMAs remain well above spot and slope lower, so the broader trend stays under pressure. The Moving Average Convergence Divergence (MACD) line has moved above its signal in positive territory, and the histogram is expanding, pointing to improving upside momentum. The Relative Strength Index is at 64, rising toward the overbought zone, but still supports ongoing recovery rather than exhaustion for now.
Initial resistance aligns at the 50% retracement at $0.2054, measured from the January 6 high of $0.3149 to the February 6 low of $0.1340. A break above this barrier would expose the 100-day EMA at $0.2175, followed by the 78.6% Fibonacci retracement level at $0.2622 if buyers maintain control.
On the downside, the immediate support sits at $0.1639, where the 23.6% retracement underpins the latest bounce. A daily close back below this level would weaken the bullish bias and open the door toward the $0.1400 area.
Render shows a promising rally, targeting $2
Render extends gains for the fifth consecutive day, bringing total gains to over 30% so far. At the time of writing, RENDER is up 6% on Friday, scaling above the 100-day EMA at $1.71, which skews the near-term bias bullish.
Still, the AI token is trading beneath the declining 100-day and 200-day EMAs, suggesting an emerging recovery within a broader corrective phase.
The RSI at 69 approaches overbought territory and signals strong upside momentum, while the MACD line holds above its signal line and the zero line, with an expanding positive histogram, reinforcing short-term buying pressure.
A decisive close above the 100-day EMA at $1.71 could confirm the upside bias and extend the rally to the $2.00 psychological level.
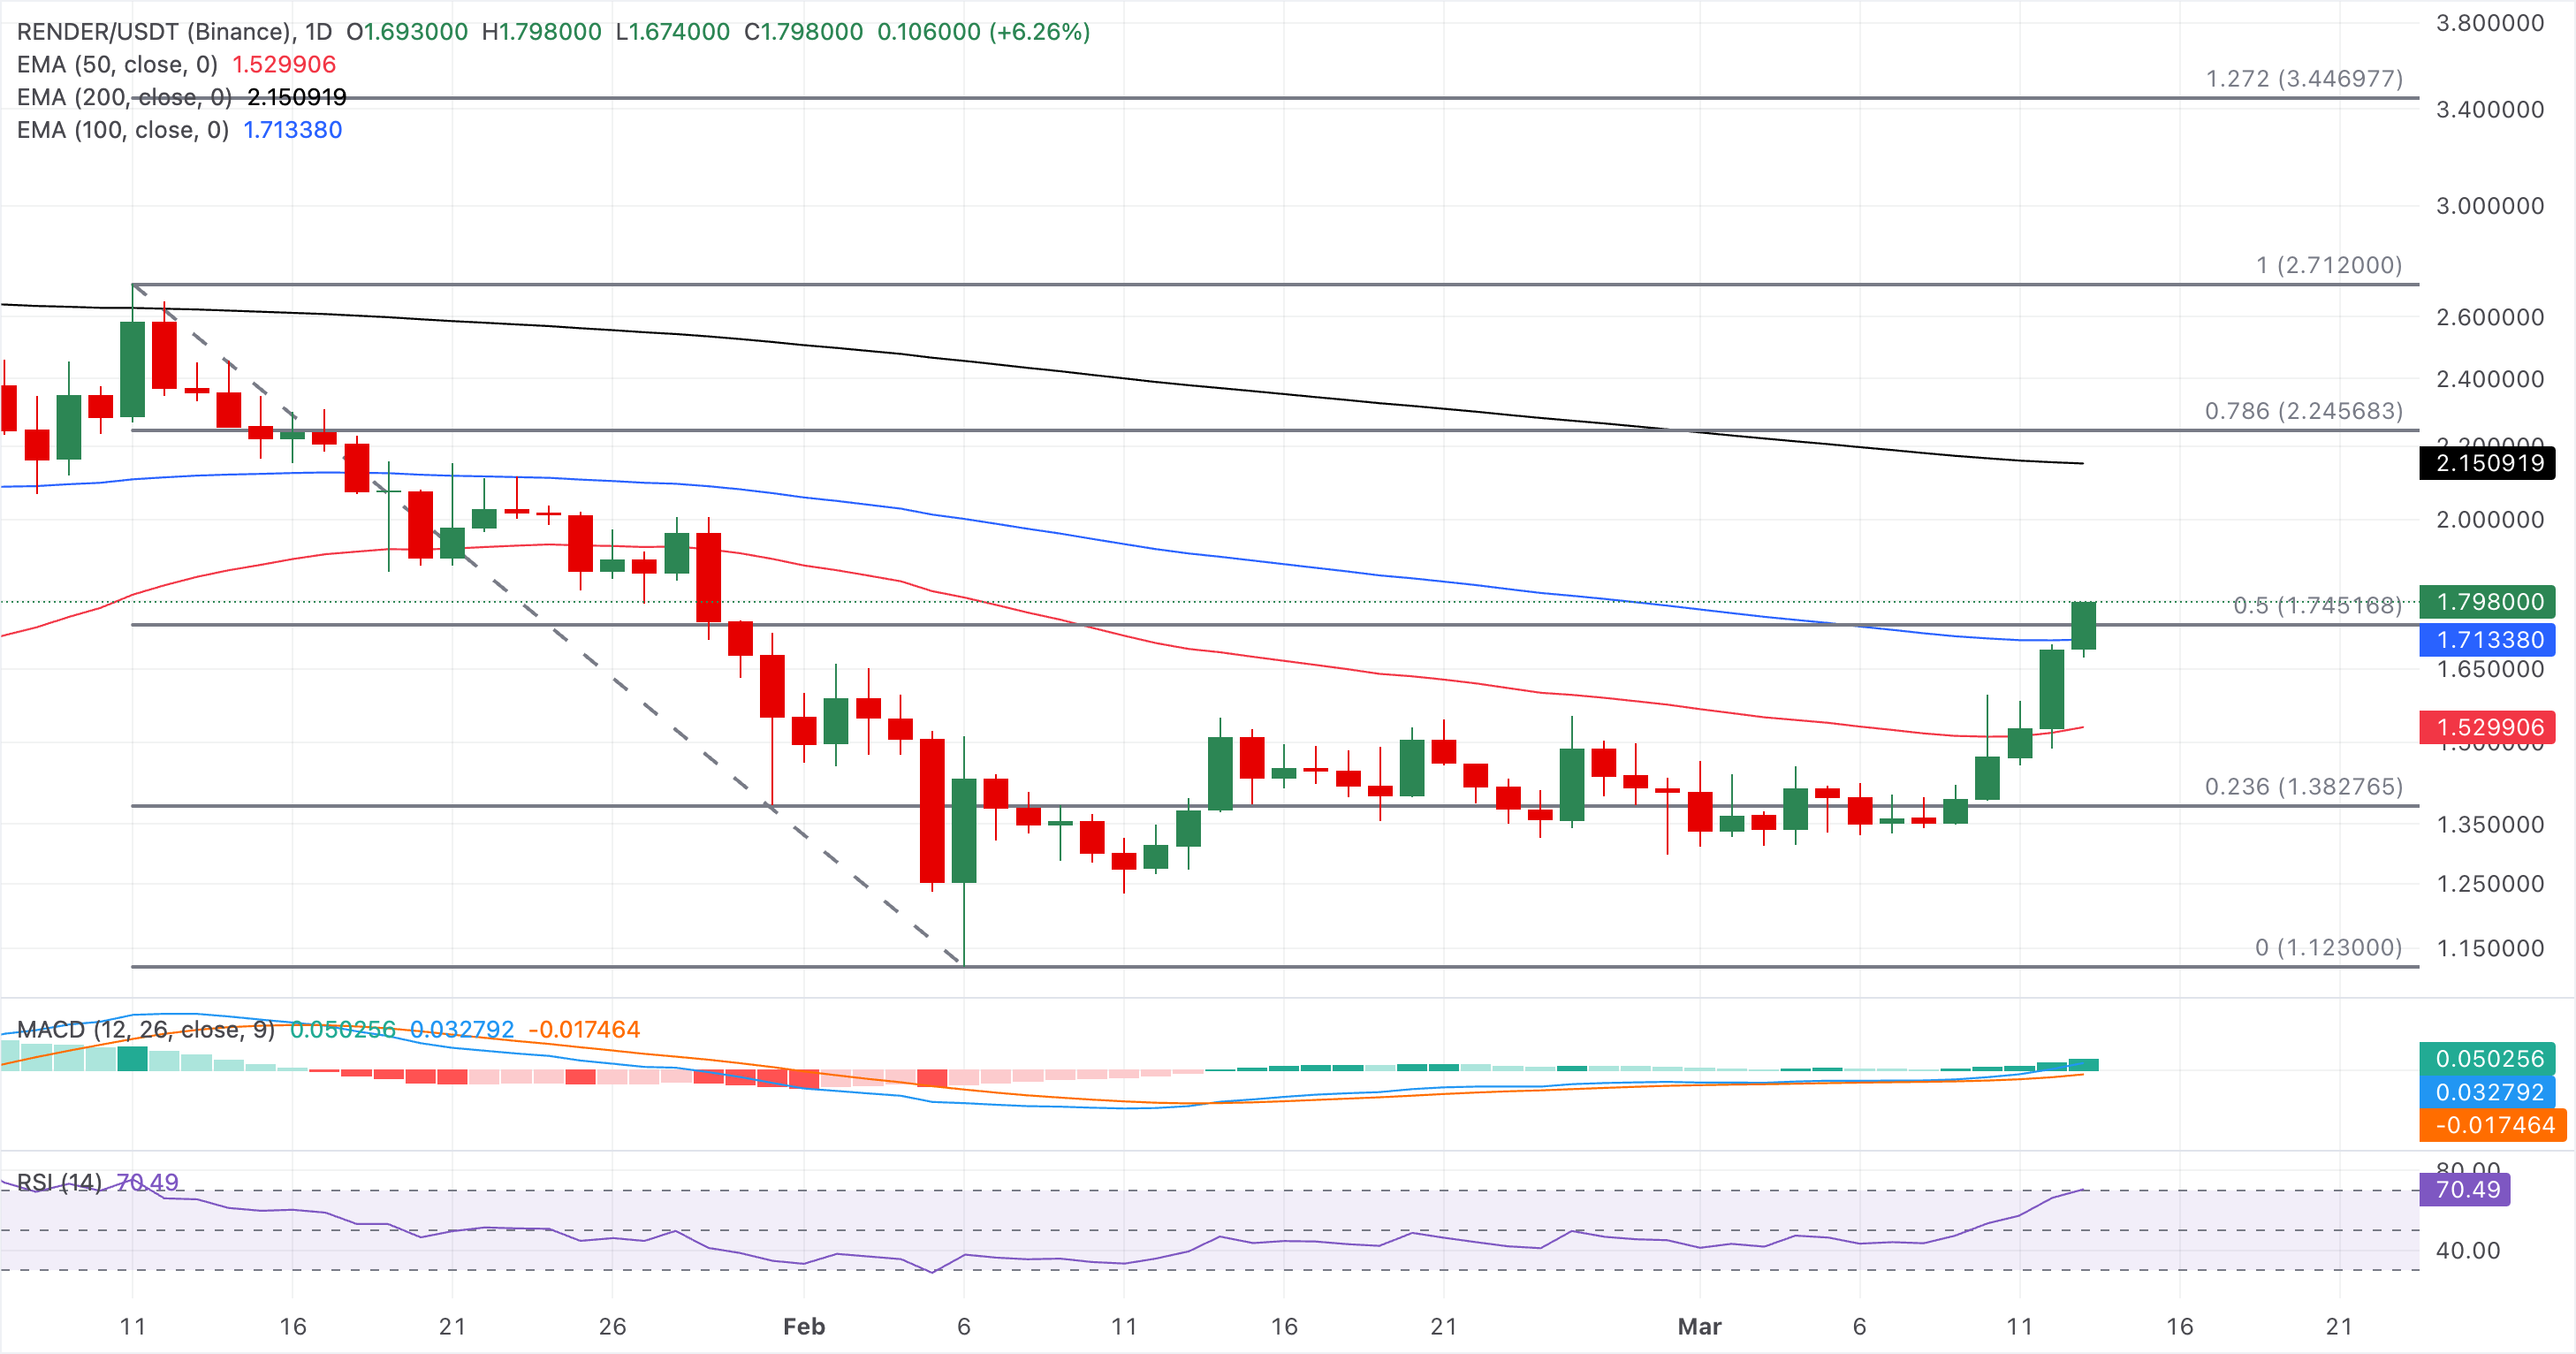
However, a reversal below the 100-day EMA at $1.71 could signal a local top, risking a pullback to the 50-day EMA at $1.52.
Bittensor eyes further upside to the 200-day EMA
Bittensor shows a steady recovery above the $200 mark this week, marking its sixth consecutive day of gains. TAO is up 5% at press time on Friday, testing the 100-day EMA at $226.
The near-term bias is bullish after TAO broke above the descending resistance trendline of the falling channel pattern and the 50-day EMA, close to the $200 psychological level, as anticipated by FXStreet.
A daily close above $226 could extend the upward trend to the 200-day EMA at $267.
Momentum supports the upside tone, with the MACD line extending above its signal in positive territory and a widening histogram, as the RSI at 69 pushes toward overbought territory, signaling strong buying pressure.
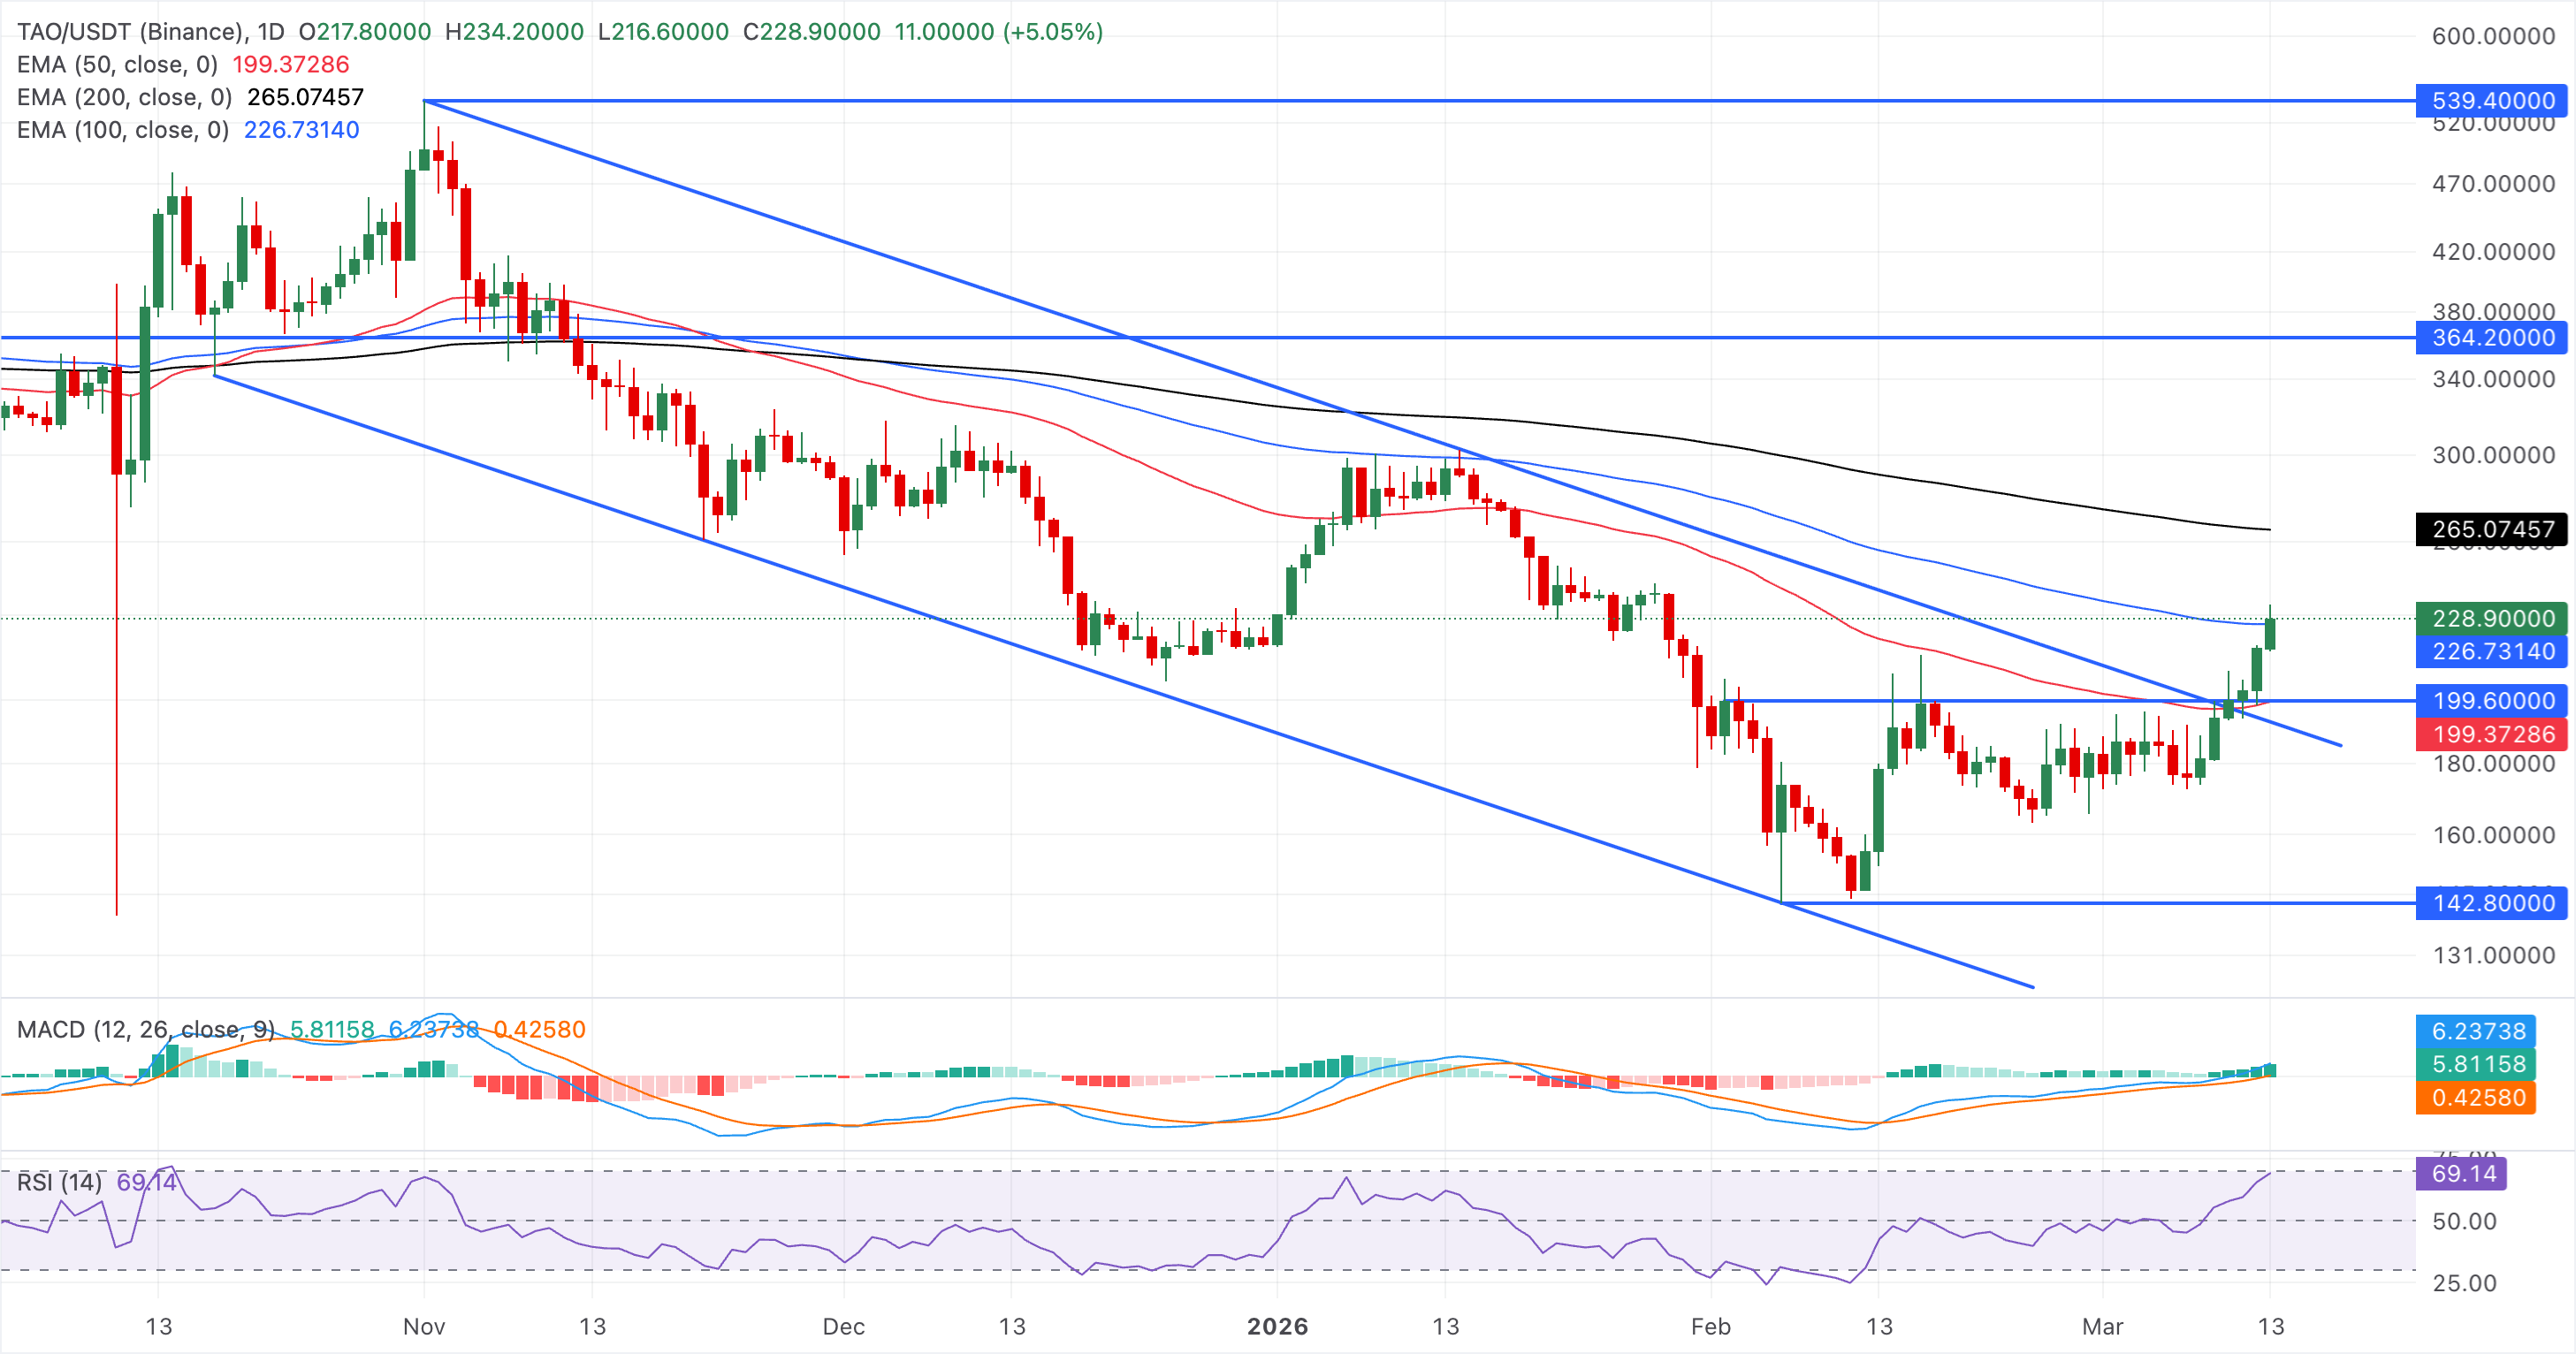
A reversal from $226 could push Bittensor down to test the former breakout area around the $200 psychological support level.
(The technical analysis of this story was written with the help of an AI tool.)
Bài viết đề xuất


