

Pi Network Price Forecast: PI extends recovery as 20 million token unlock looms
- Pi Network extends gains above the 50-day EMA on Thursday, building on the previous day's 7% rise.
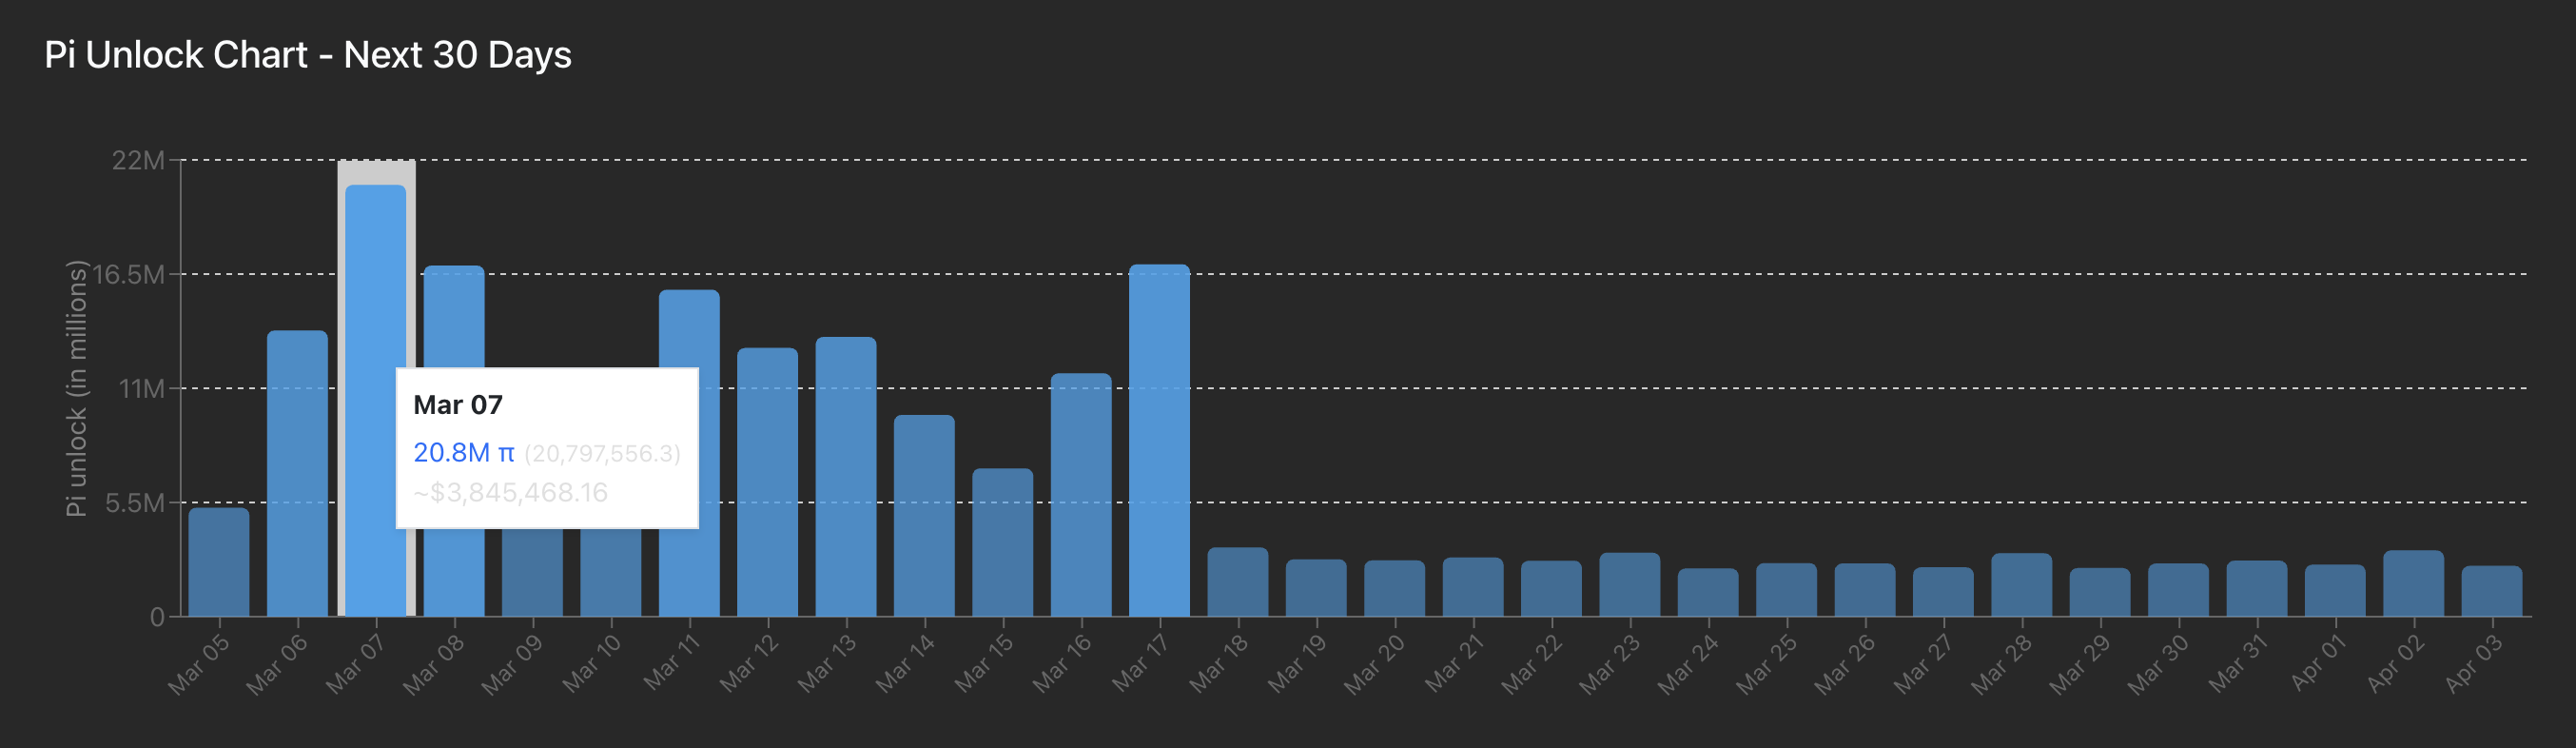
- Over 20 million PI tokens are to be unlocked on Saturday, the largest in the next 30 days, which could cap the recovery.
- The technical outlook for PI is bullish as the short-term recovery tests a crucial resistance trendline.
Pi Network (PI) price extends gains above $0.1900 at press time on Thursday, following a 7% increase the previous day. The upcoming token unlock of more than 20 million PI tokens on Saturday looms over the short-term recovery. Technically, the Pi Network tests a crucial resistance trendline, with bulls anticipating a breakout rally.
Pi Network gains strength ahead of 20 million token unlock
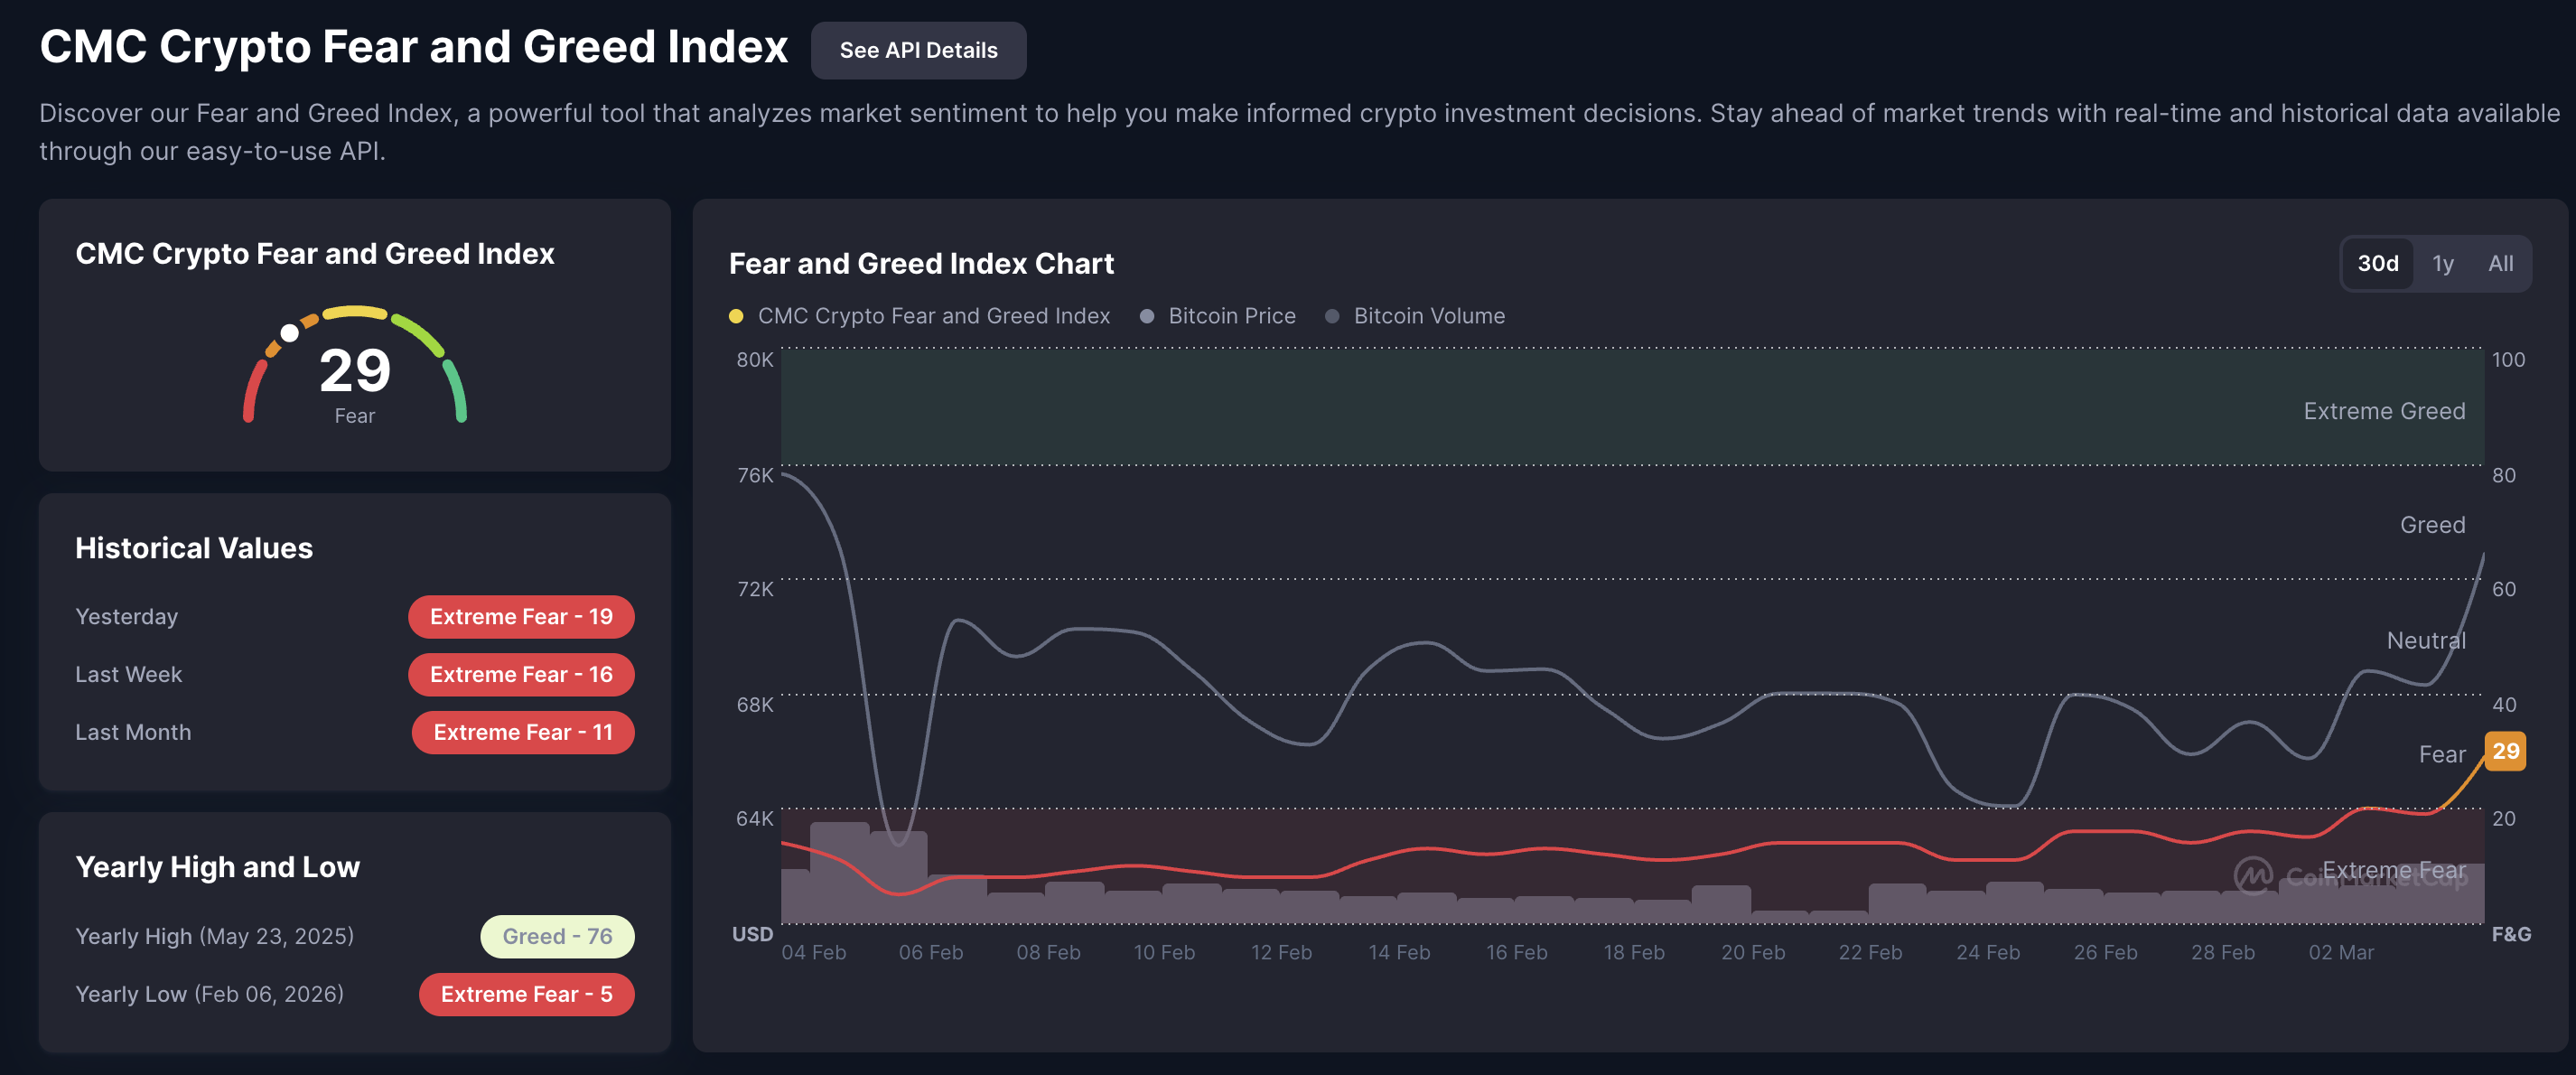
Pi Network is up roughy 15% so far this week as the broader market risk-off sentiment fades. CoinMarketCap’s Crypto Fear and Greed Index rises to 29 on Thursday, from 19 the previous day, indicating that the investor's sentiment recovers from Extreme Fear conditions, as previously reported by FXStreet.
However, the daily token unlocks continue to weigh down on PI recovery. PiScan data shows 20.8 million PI tokens are scheduled to be unlocked on Saturday, marking the largest release in the next 30 days. Typically, token unlock leads to increased downside pressure, capping the recovery.
Technical outlook: Will Pi Network extend gains above $0.20?
Pi Network is up 5% at press time on Thursday, marking its fourth consecutive day of recovery. The PI token holds gains above the 50-day Exponential Moving Average (EMA) at $0.1749, signaling a boost in short-term bullish momentum.
Pi Network tests a supply cluster of the 100-day EMA at $0.1959 and a descending trendline, connecting the August 30 and November 28 highs, near the October 11 low at $0.1919. A decisive close above $0.1959 could extend the upside toward the $0.2613 resistance level, marked by the September 23 low.
The momentum indicators on the daily chart confirm a bullish bias in the short-term. The Moving Average Convergence Divergence (MACD) rises above its signal line as both extend above the zero line while the positive histogram widens, reflecting increased bullish momentum. At the same time, the Relative Strength Index (RSI) is at 65, pointing upwards and inching closer to the overbought zone as buying pressure strengthens.
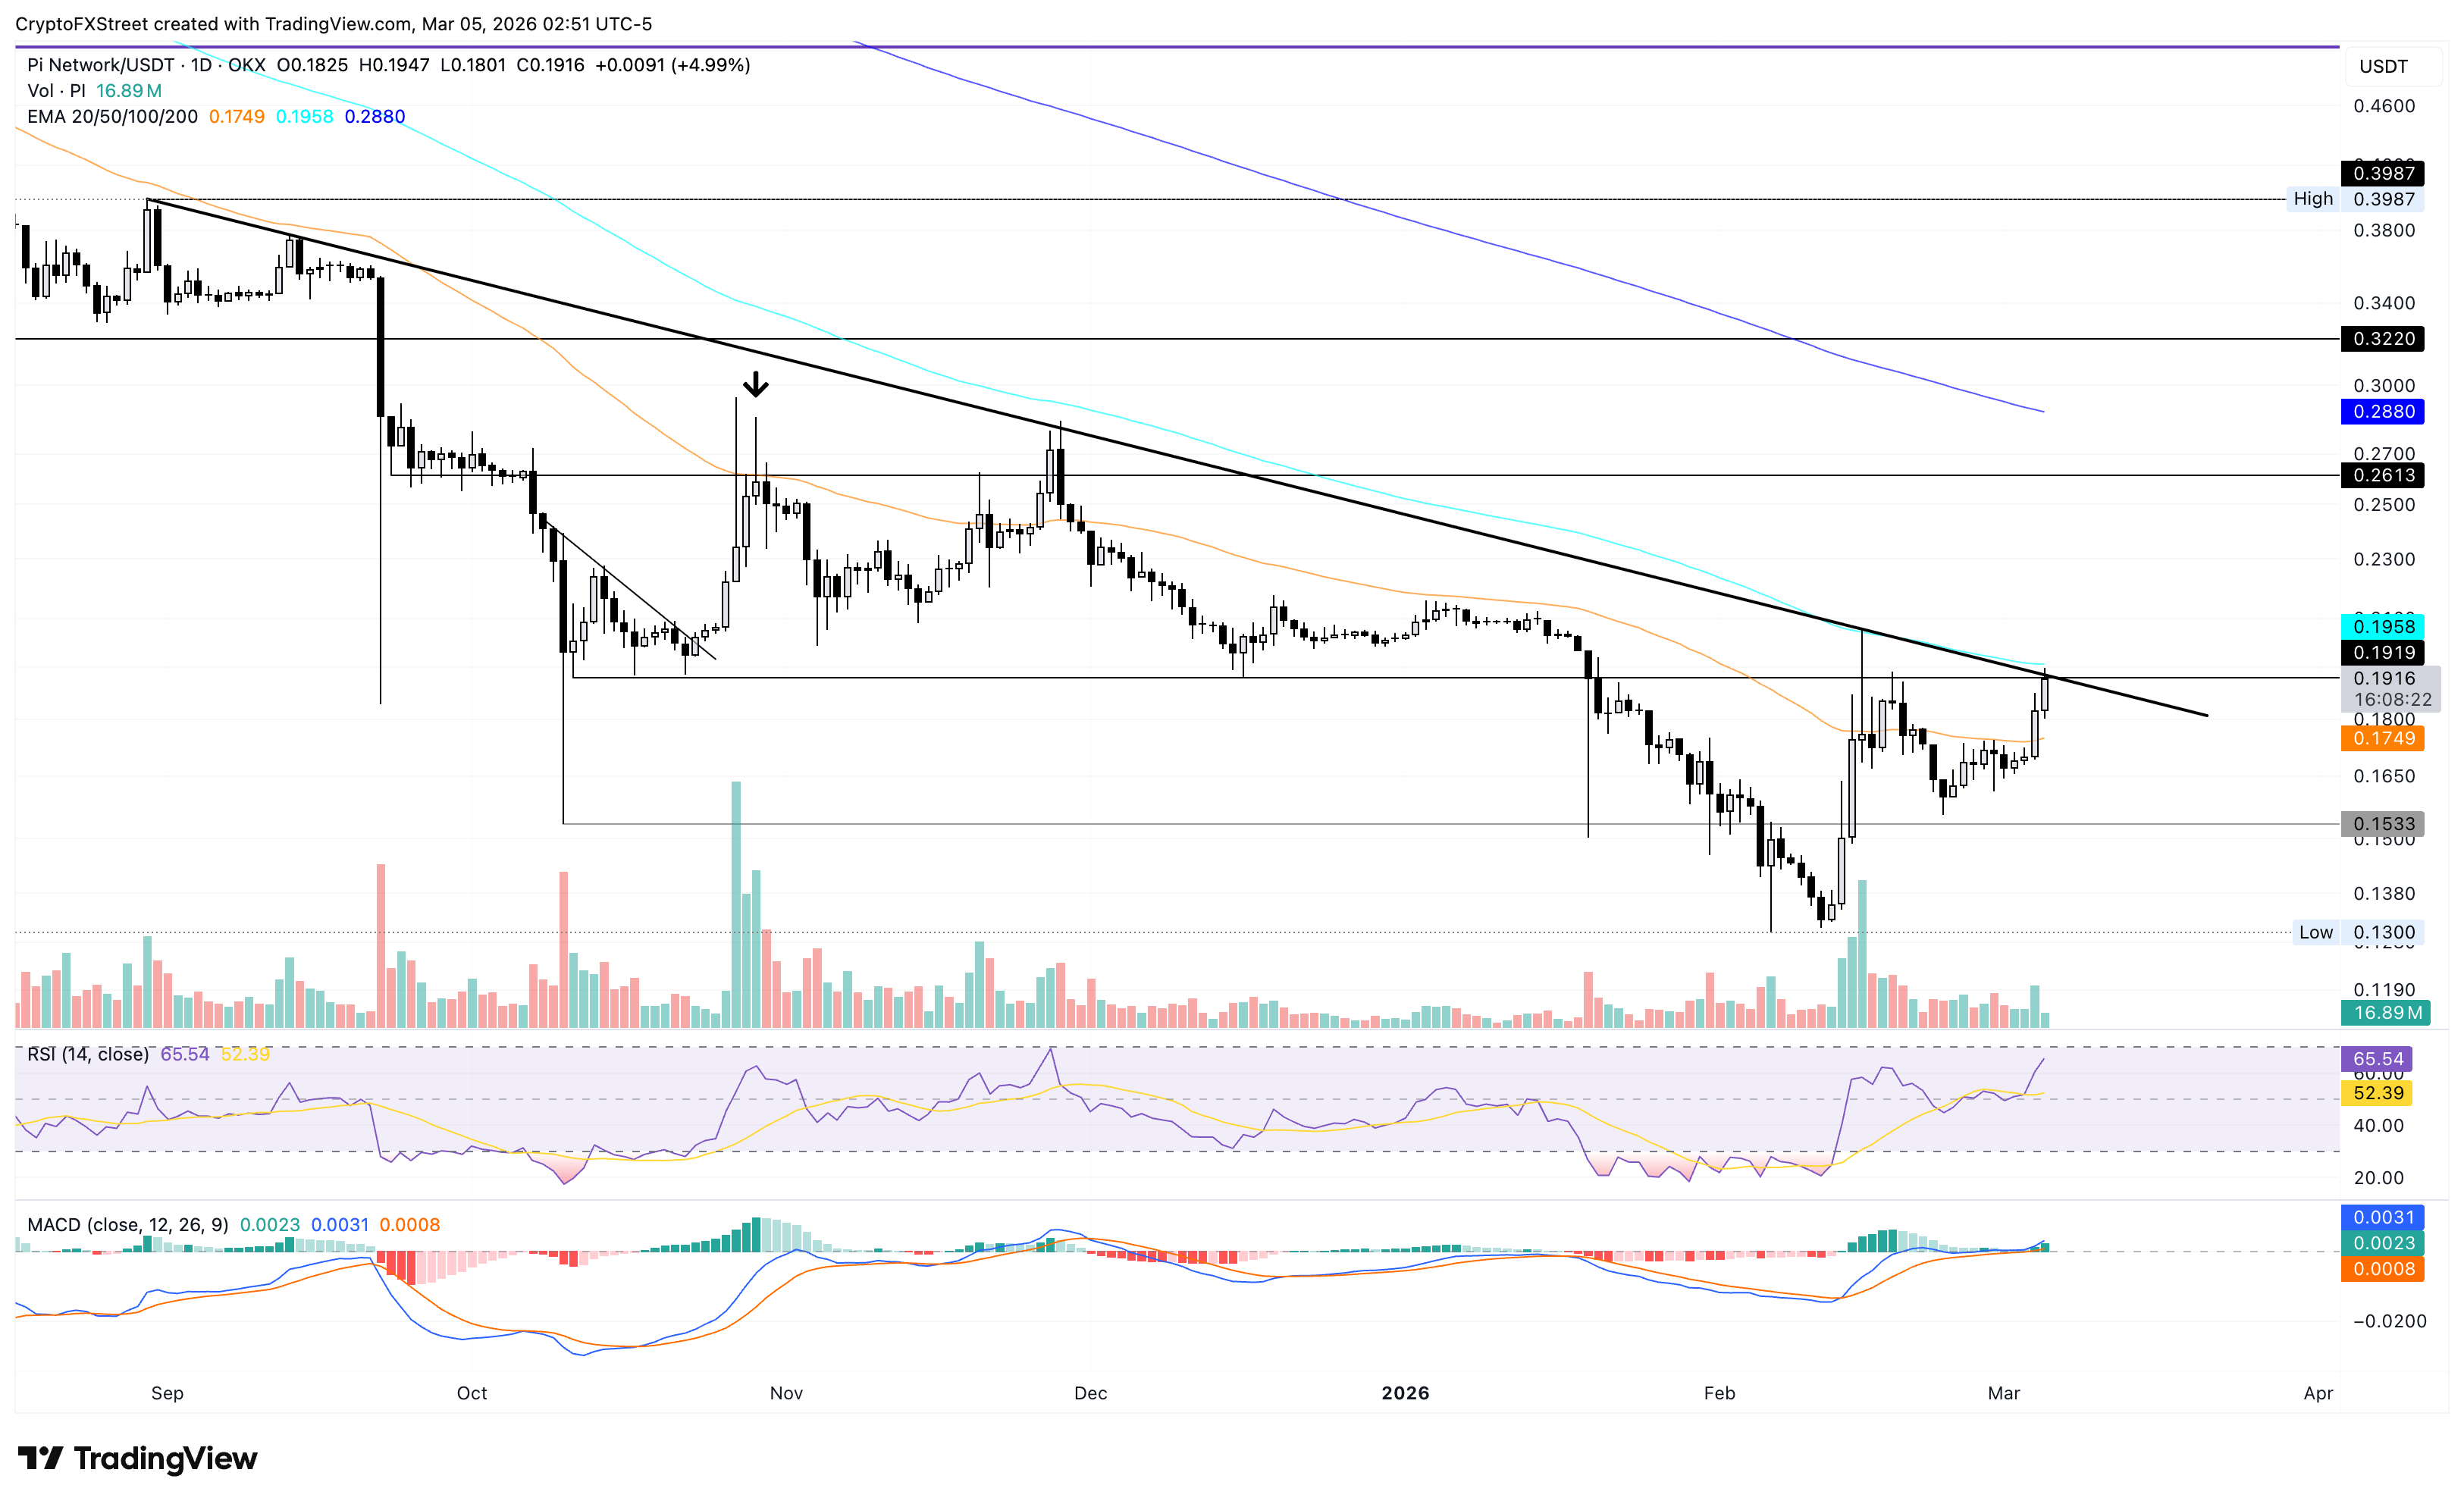
Looking down, the 50-day EMA at $0.1749 remains a crucial support level, capping the downside risk to the October 10 low at $0.1533.
Bitcoin, altcoins, stablecoins FAQs
Bitcoin is the largest cryptocurrency by market capitalization, a virtual currency designed to serve as money. This form of payment cannot be controlled by any one person, group, or entity, which eliminates the need for third-party participation during financial transactions.
Altcoins are any cryptocurrency apart from Bitcoin, but some also regard Ethereum as a non-altcoin because it is from these two cryptocurrencies that forking happens. If this is true, then Litecoin is the first altcoin, forked from the Bitcoin protocol and, therefore, an “improved” version of it.
Stablecoins are cryptocurrencies designed to have a stable price, with their value backed by a reserve of the asset it represents. To achieve this, the value of any one stablecoin is pegged to a commodity or financial instrument, such as the US Dollar (USD), with its supply regulated by an algorithm or demand. The main goal of stablecoins is to provide an on/off-ramp for investors willing to trade and invest in cryptocurrencies. Stablecoins also allow investors to store value since cryptocurrencies, in general, are subject to volatility.
Bitcoin dominance is the ratio of Bitcoin's market capitalization to the total market capitalization of all cryptocurrencies combined. It provides a clear picture of Bitcoin’s interest among investors. A high BTC dominance typically happens before and during a bull run, in which investors resort to investing in relatively stable and high market capitalization cryptocurrency like Bitcoin. A drop in BTC dominance usually means that investors are moving their capital and/or profits to altcoins in a quest for higher returns, which usually triggers an explosion of altcoin rallies.
Bài viết đề xuất


