

Bitcoin Price Forecast: BTC slips below $70,000 as ETF outflows, realized losses fuel bearish outlook
- Bitcoin price trades in red below $70,000 on Monday after correcting nearly 9% in the previous week.
- US-listed spot ETFs recorded a $318 million weekly outflow, marking the third consecutive week of withdrawals.
- On-chain data shows that the bearish regime started on BTC, with the 30-day realized loss exceeding 263,000 BTC.
Bitcoin (BTC) trades in the red below $70,000 at the time of writing on Monday, after sliding nearly 9% last week. The institutional demand continues to weaken with spot Exchange Traded Funds (ETFs) recording a third consecutive week of outflows, signaling fading institutional investor interest. Meanwhile, on-chain data suggests a bearish regime has taken hold for the Crypto King, signaling growing caution among traders.
Fading institutional demand weighs on BTC
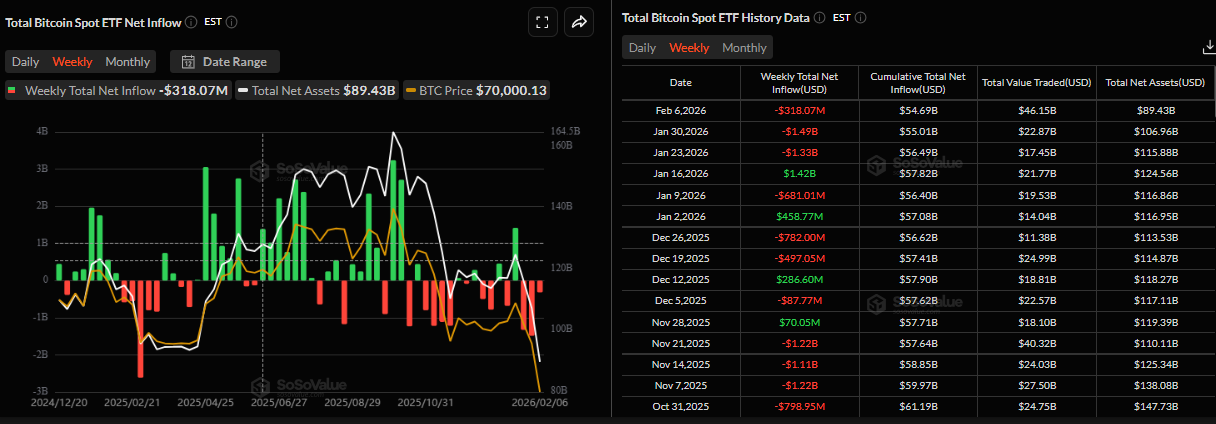
Institutional demand for Bitcoin continued to weaken last week. SoSoValue data shows that spot Bitcoin ETFs recorded total outflows of $318.07 million last week, marking the third consecutive week of withdrawals. If this trend continues and intensifies, BTC could see further correction.
Bearish regime for Bitcoin
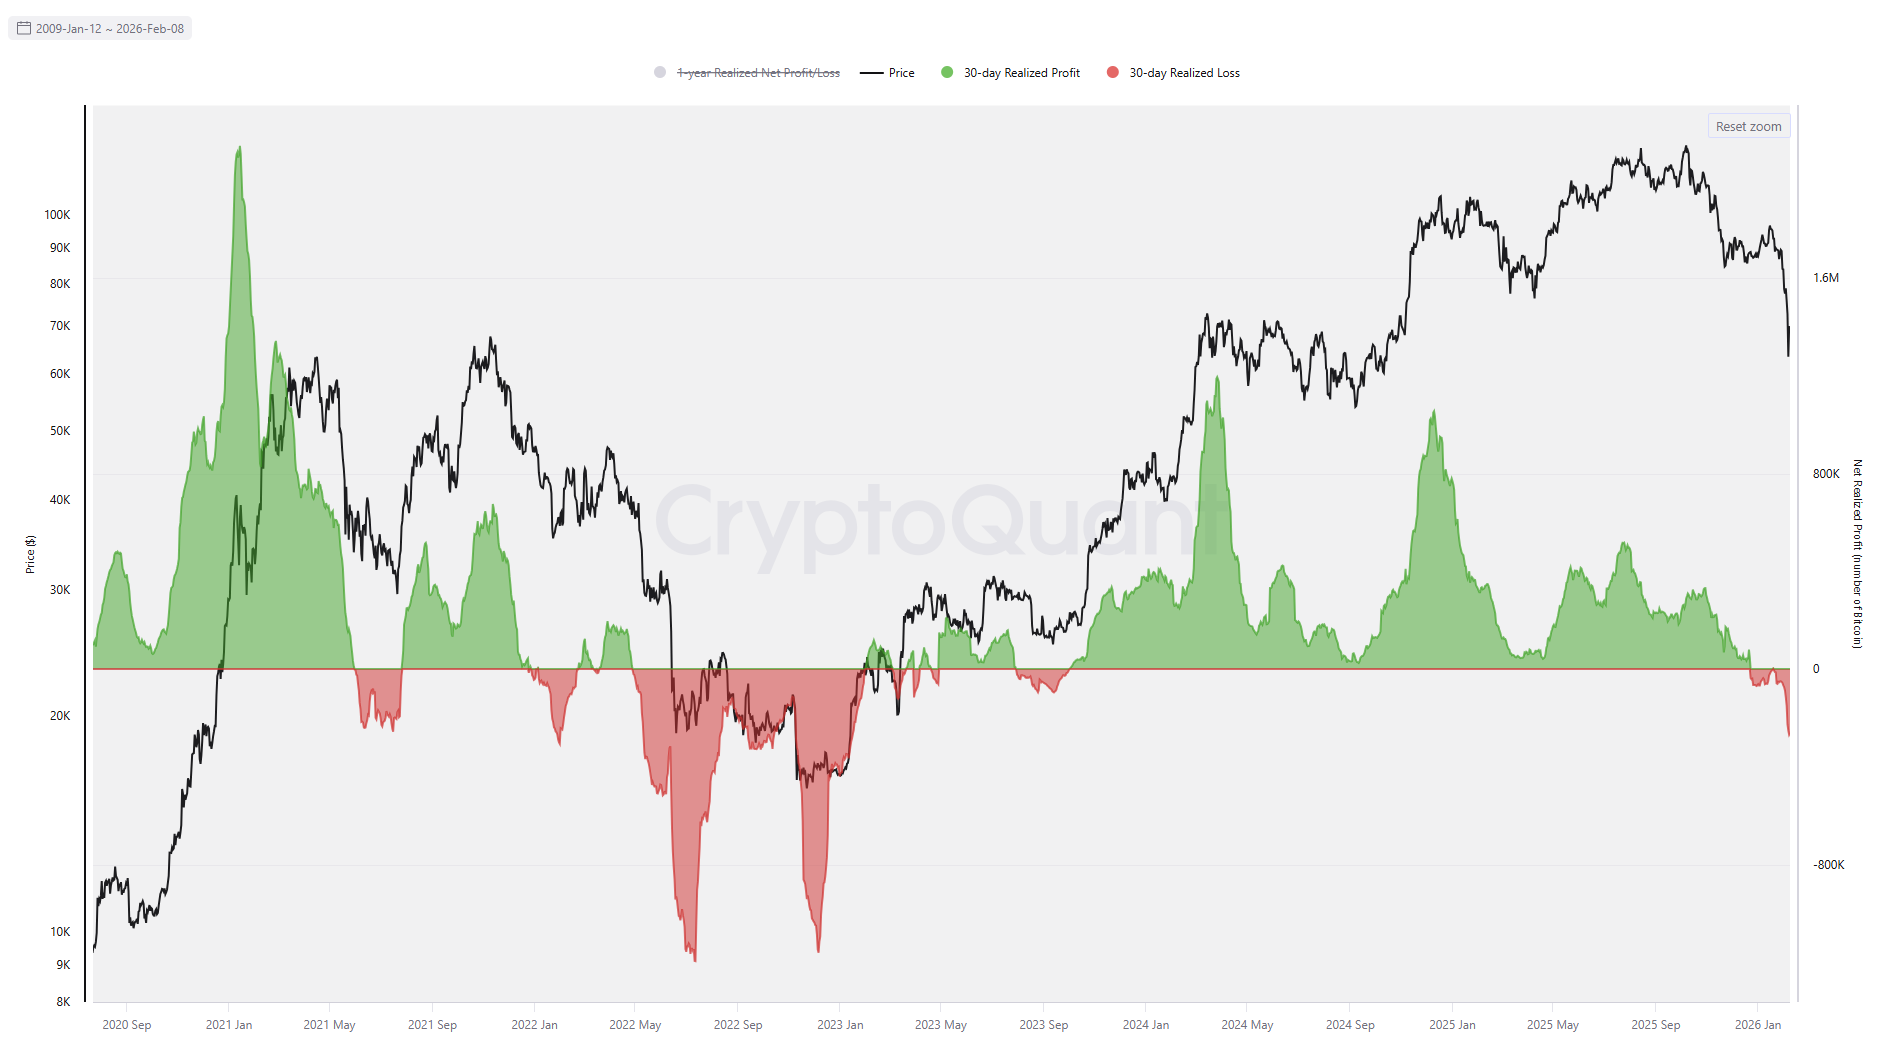
The CryptoQuant data chart below shows that holders have been realizing net losses that continue to intensify, weighing on the BTC price. The metric turned negative on January 20 and has been falling continually, reaching losses of 263,000 BTC on Sunday. In addition, the current pattern closely mirrors the 2021–2022 bull-to-bear transition, when realized profits peaked in January 2021, formed lower highs through 2021, and then flipped into net losses ahead of the 2022 bear market.
Bitcoin Price Forecast: Is BTC bottoming, or do bears have steam for further correction?
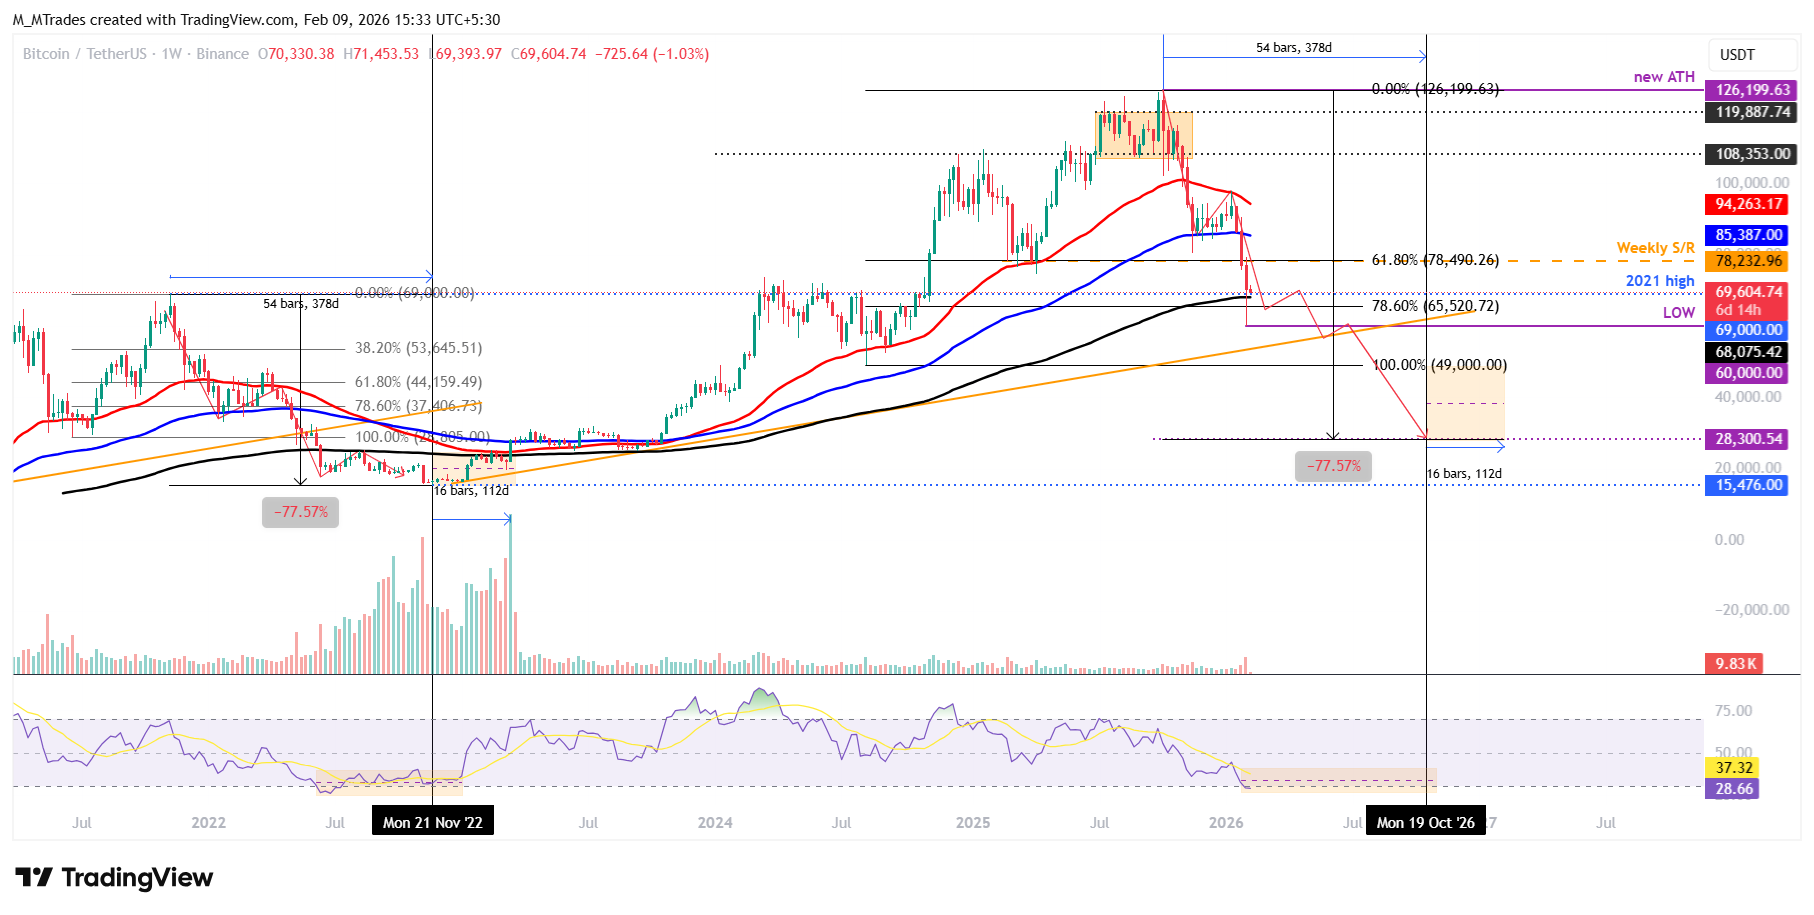
The Bitcoin weekly chart shows price action that resembles that of the late-2021-2022 bear market. In 2021, BTC hit a new all-time high (ATH) of $69,000 in November and corrected 77.57% from the high to the 2022 bottom of around $15,476 in November 2022 in 378 days. Then consolidated for the next 112 days, before the start of another bull cycle in 2023.
As in the 2025-2026 era, BTC hit a new ATH at $126,199 in October 2025 and has corrected by 45% through the first week of February, finding support around the 200-week Exponential Moving Average at $68,075.
If the current regime follows the 2021-2022 pattern, BTC could see further corrections, reaching a low of $28,300 (77.51% from the 2025 ATH) on October 19, 2026. Then consolidate for the next 112 days before the start of another bull cycle (similarly seen in 2023 as discussed above).
Switching to the daily chart, Bitcoin price declined nearly 9% last week, reaching a low of $60,000 on Friday, and rebounded, retesting the daily resistance at $73,072 on Sunday. At the time of writing on Monday, BTC is trading below $70,000.
If BTC continues its recovery, it could extend the advance toward the daily resistance at $73,072.
Traders should be cautious as the primary trend for BTC remains bearish, so any short-term recovery has a high probability of a dead-cat bounce — a brief price increase within a broader downtrend.
The Relative Strength Index (RSI) on the daily chart is 32, pointing upward after rebounding from oversold territory last week, suggesting fading bearish strength and hinting at a recovery. However, traders should remain cautious, as the Moving Average Convergence Divergence (MACD) indicator has shown a bearish crossover, suggesting a continuation of the downward trend.
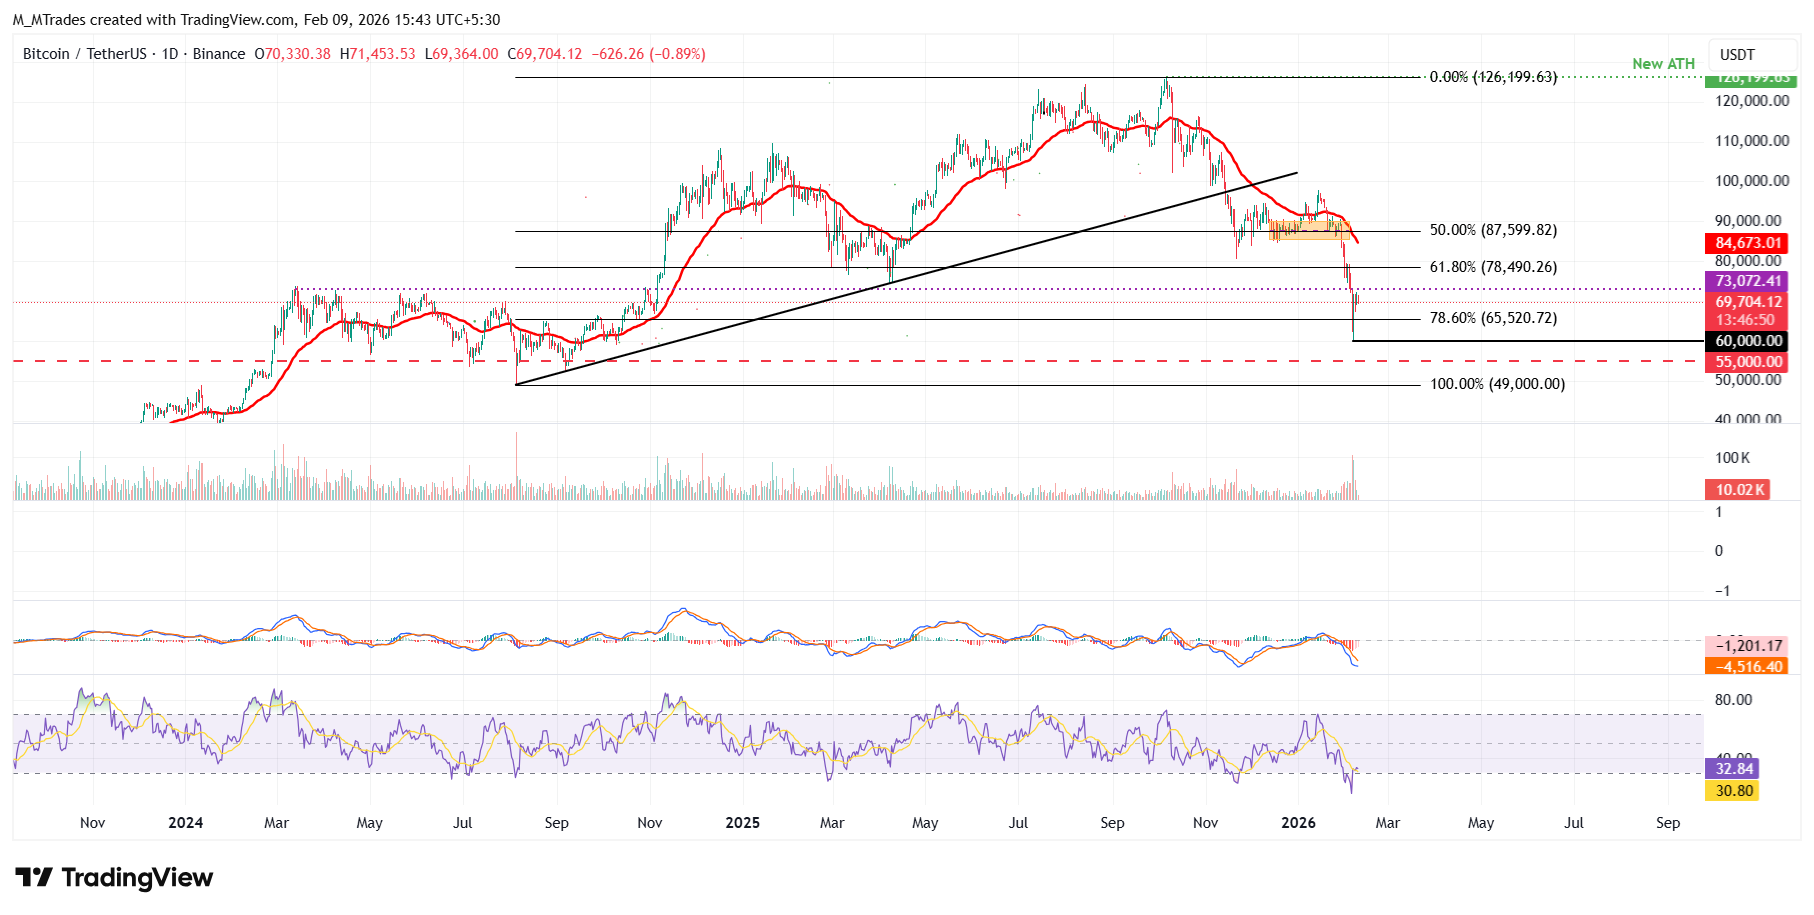
If BTC continues its downward trend, it could extend the decline toward the 78.6% Fibonacci retracement (drawn from the August 2024 low of $49,000 to the October 2025 all-time high of $126,199) at $65,520.
Bitcoin, altcoins, stablecoins FAQs
Bitcoin is the largest cryptocurrency by market capitalization, a virtual currency designed to serve as money. This form of payment cannot be controlled by any one person, group, or entity, which eliminates the need for third-party participation during financial transactions.
Altcoins are any cryptocurrency apart from Bitcoin, but some also regard Ethereum as a non-altcoin because it is from these two cryptocurrencies that forking happens. If this is true, then Litecoin is the first altcoin, forked from the Bitcoin protocol and, therefore, an “improved” version of it.
Stablecoins are cryptocurrencies designed to have a stable price, with their value backed by a reserve of the asset it represents. To achieve this, the value of any one stablecoin is pegged to a commodity or financial instrument, such as the US Dollar (USD), with its supply regulated by an algorithm or demand. The main goal of stablecoins is to provide an on/off-ramp for investors willing to trade and invest in cryptocurrencies. Stablecoins also allow investors to store value since cryptocurrencies, in general, are subject to volatility.
Bitcoin dominance is the ratio of Bitcoin's market capitalization to the total market capitalization of all cryptocurrencies combined. It provides a clear picture of Bitcoin’s interest among investors. A high BTC dominance typically happens before and during a bull run, in which investors resort to investing in relatively stable and high market capitalization cryptocurrency like Bitcoin. A drop in BTC dominance usually means that investors are moving their capital and/or profits to altcoins in a quest for higher returns, which usually triggers an explosion of altcoin rallies.
Bài viết đề xuất


