


Crypto Today: Bitcoin, Ethereum, XRP recovery stalls amid mixed ETF flows
- Bitcoin holds above $78,000 but struggles to extend its recovery amid ETF inflows.
- Ethereum trades under pressure below the $2,300 immediate hurdle, undermined by weakening technical structure.
- Weak institutional and retail interest weighs on XRP as the token struggles to recover above $1.60.
Bitcoin (BTC) is trading above $78,000 at the time of writing on Tuesday as the dust from last week’s turbulence settles. Institutional interest in BTC is evidently improving, supported by the resurgence of inflows into spot Exchange-Traded Funds (ETFs).
Altcoins, including Ethereum (ETH) and Ripple (XRP), paint a relatively similar outlook, with prices holding above key support levels. However, demand for related products such as spot ETFs has faltered for both assets, signaling caution among investors.
Bitcoin ETFs attract fresh inflows, Ethereum and XRP post mild outflows
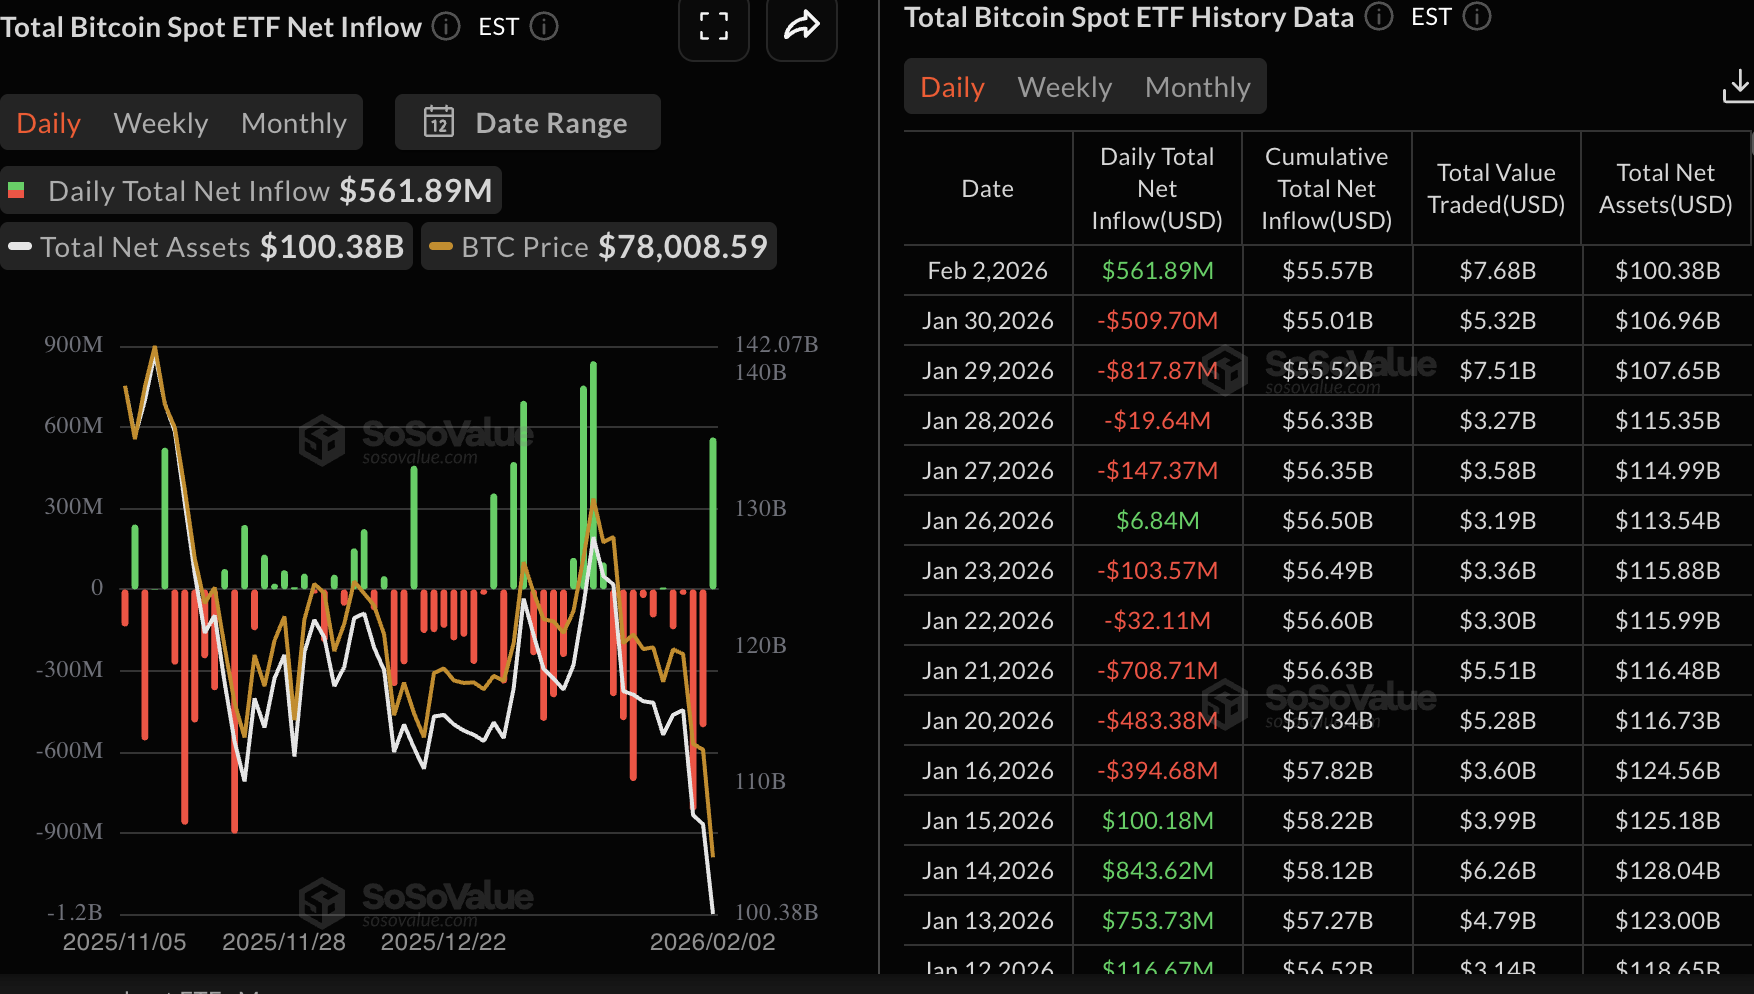
Bitcoin US-listed spot ETFs saw inflows of nearly $562 million on Monday. This marked the return of institutional interest, breaking a four-day outflow streak that had undermined Bitcoin price performance.
The cumulative inflow currently stands at $55.57 billion, and total assets under management at $100.38 billion. Steady inflows into ETFs signal positive market sentiment, which may help ground Bitcoin’s recovery.
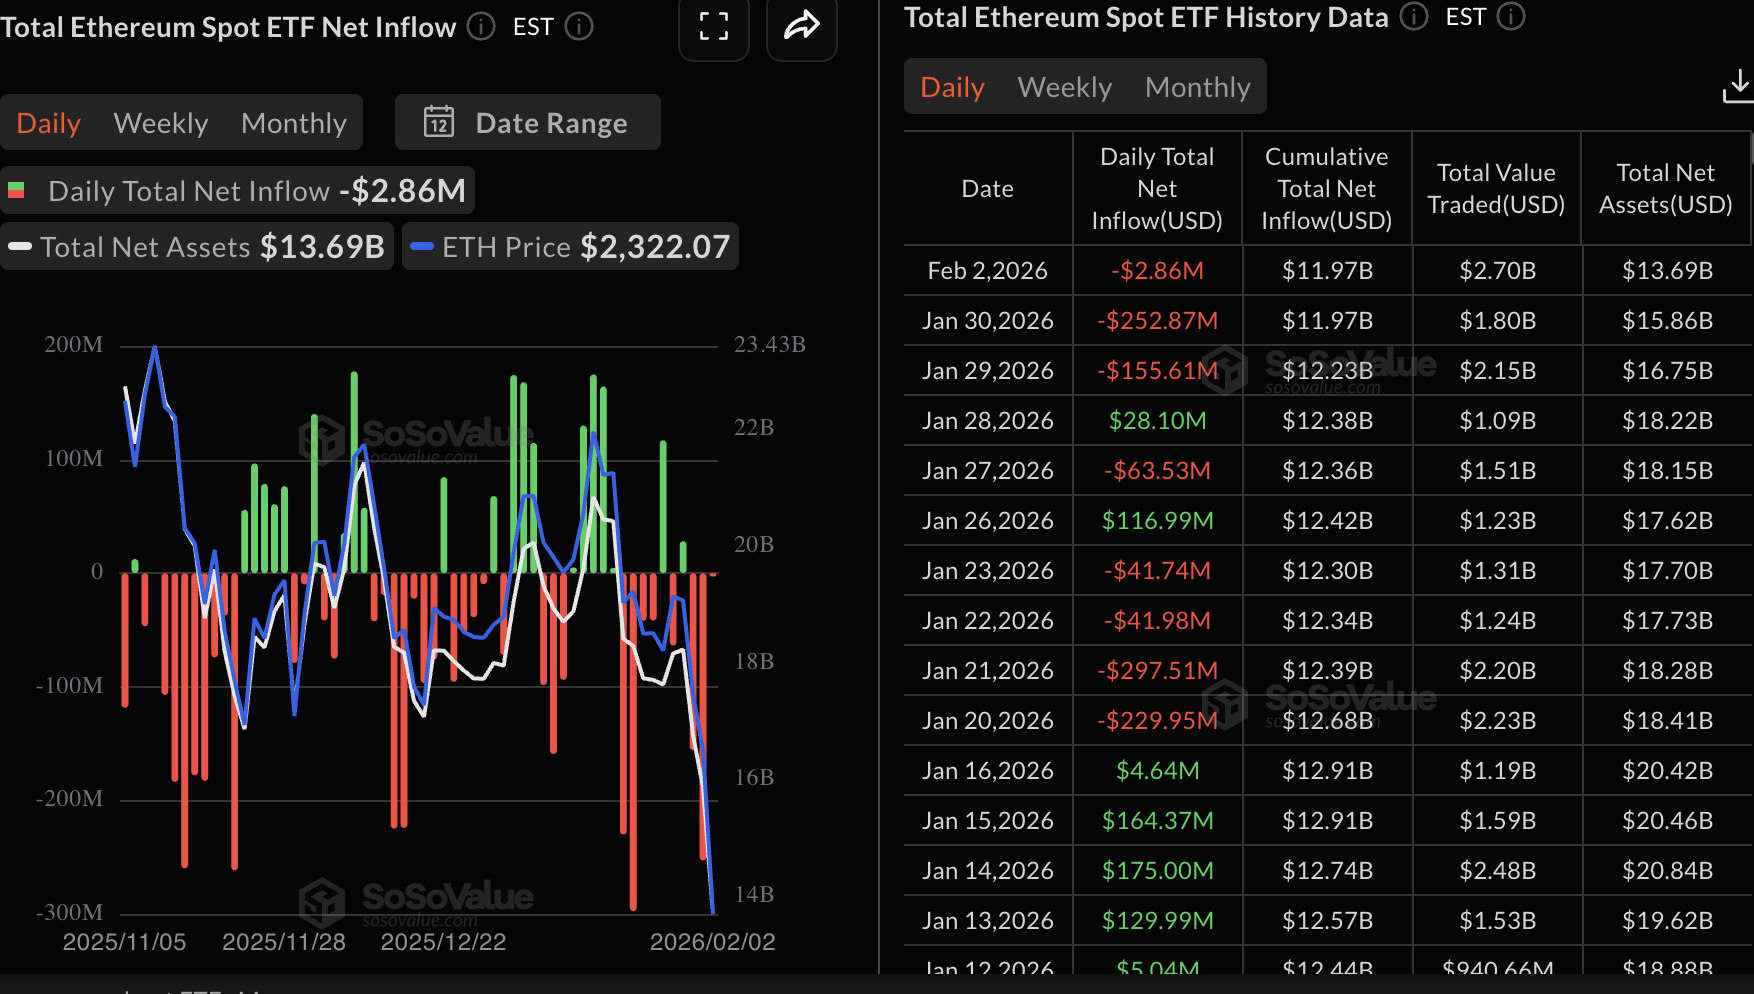
Ethereum spot ETFs, on the other hand, extended their outflow streak for a third consecutive day, as investors withdrew nearly $3 million on Monday. The cumulative inflow now stands at $11.97 billion with net assets averaging $13.69 billion. Continued outflows could dampen sentiment, slowing down recovery.
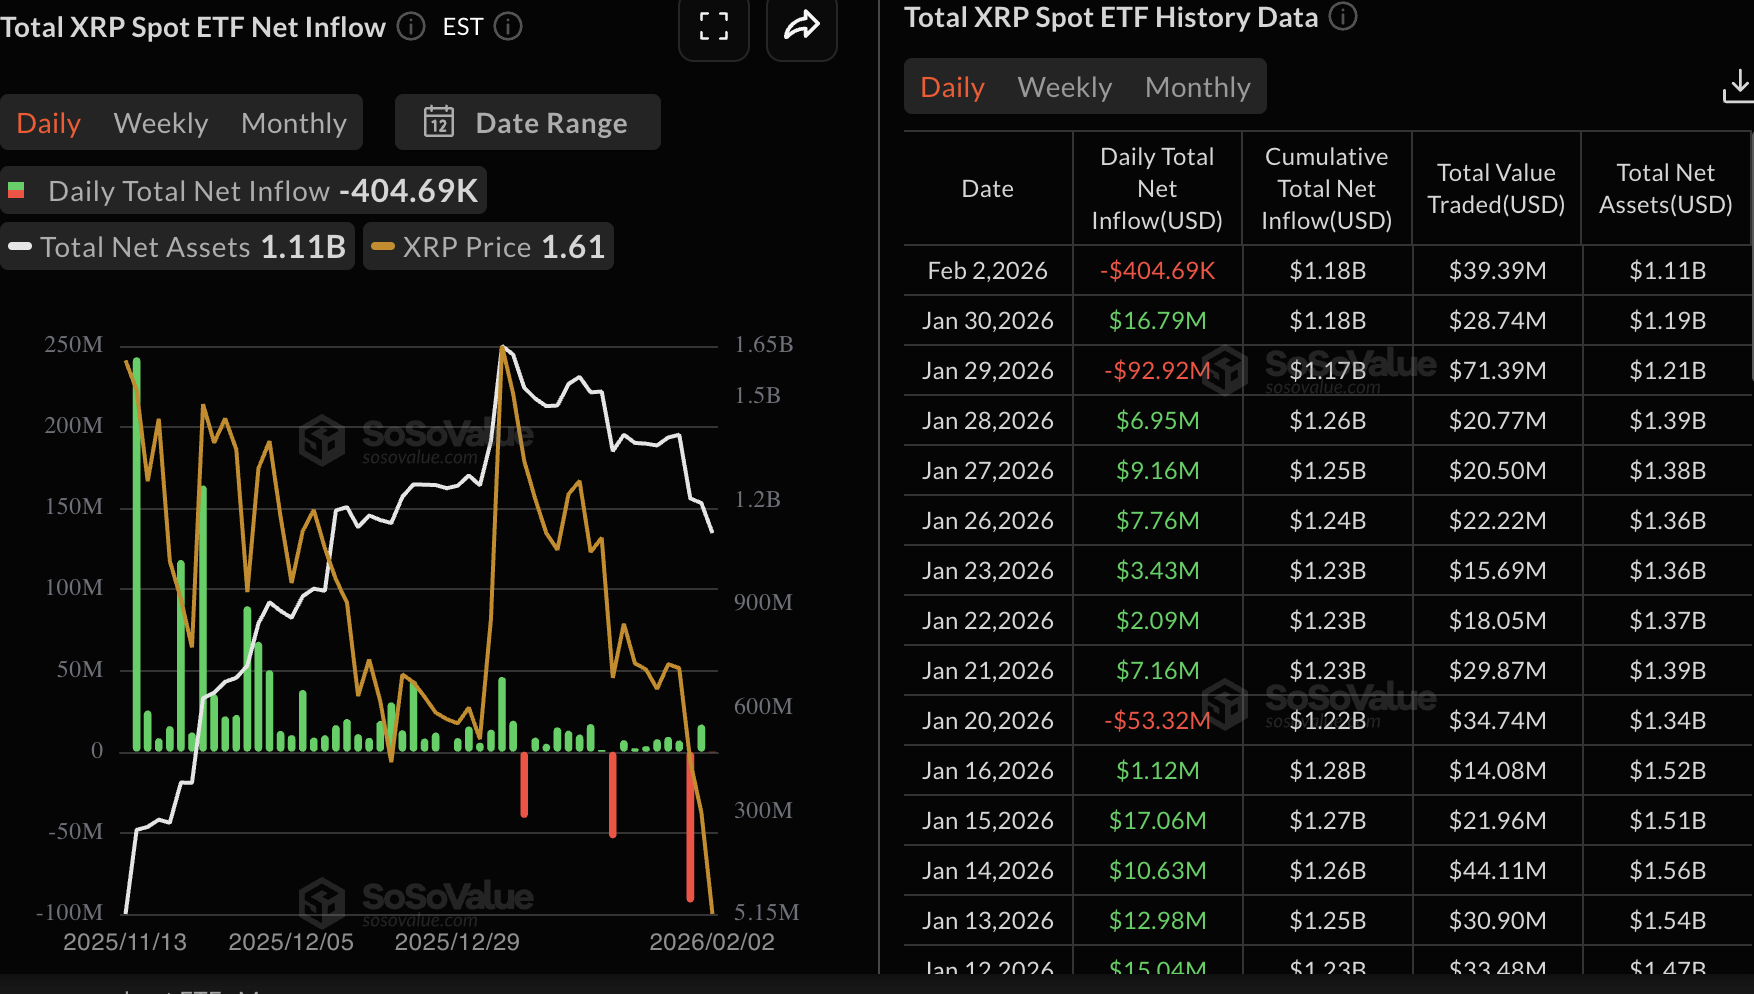
Meanwhile, spot XRP ETFs recorded mild outflows of approximately $405,000 on Monday, after posting significant inflows of nearly $17 million on Friday. XRP ETFs have a cumulative total of $1.18 billion, while total net assets under management stand at $1.11 billion, according to SoSoValue data.
The retail market remains cautious, with traders closing positions rather than opening new ones. CoinGlass data shows the XRP Open Interest (OI) Weighted Funding Rate is still in the negative at -0.0008% on Tuesday, up from -0.0080% the previous day.
For XRP to sustain an uptrend, the funding rate should steadily rise into positive territory and keep rising, signaling steady retail interest.
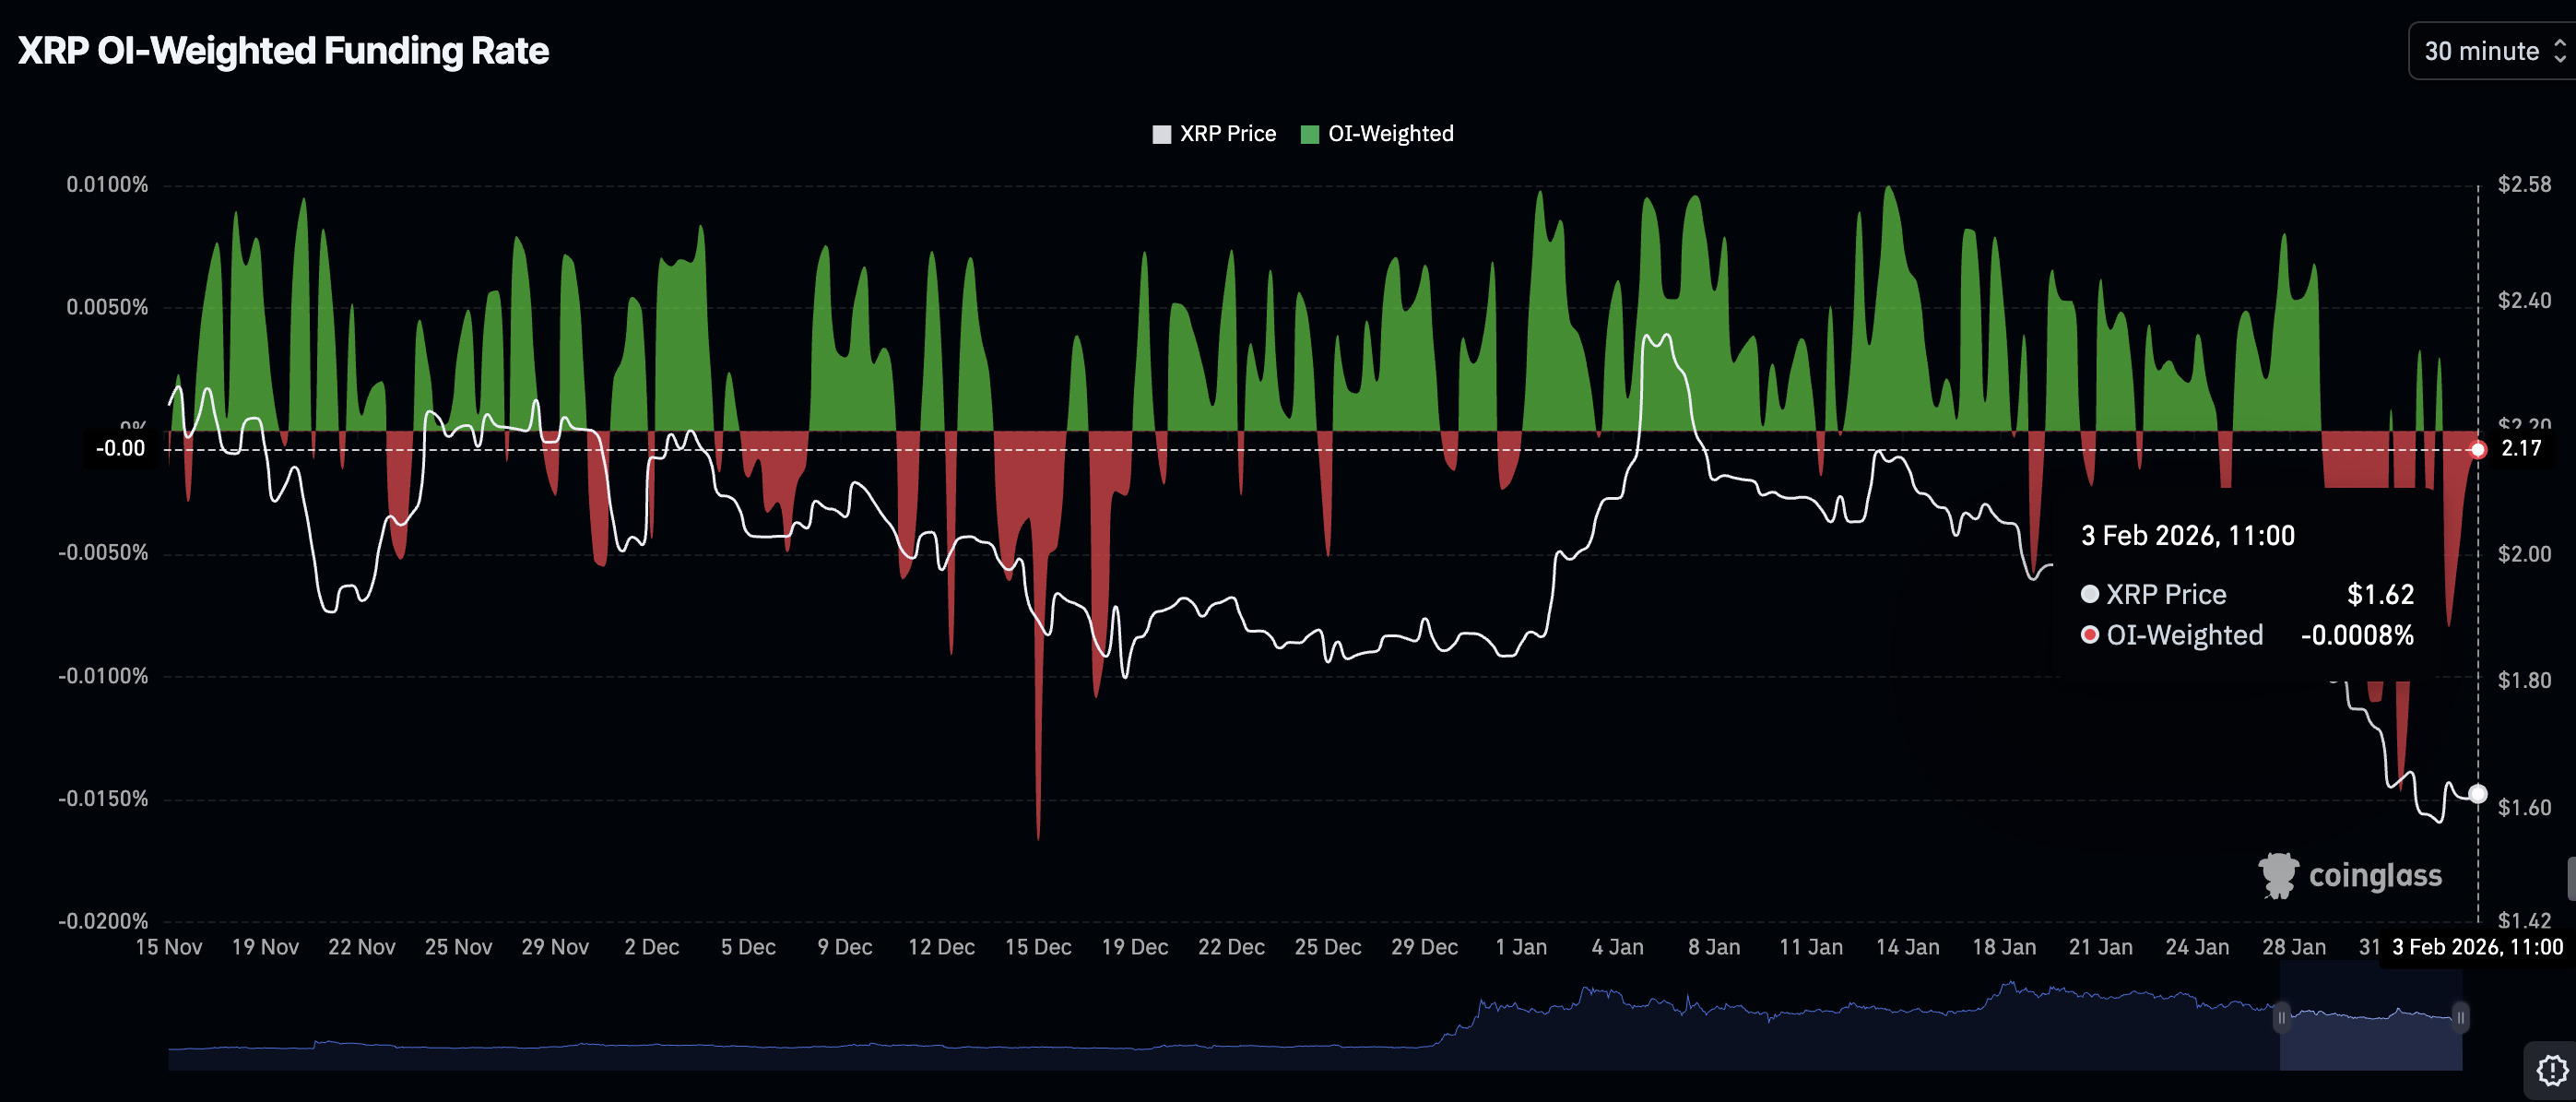
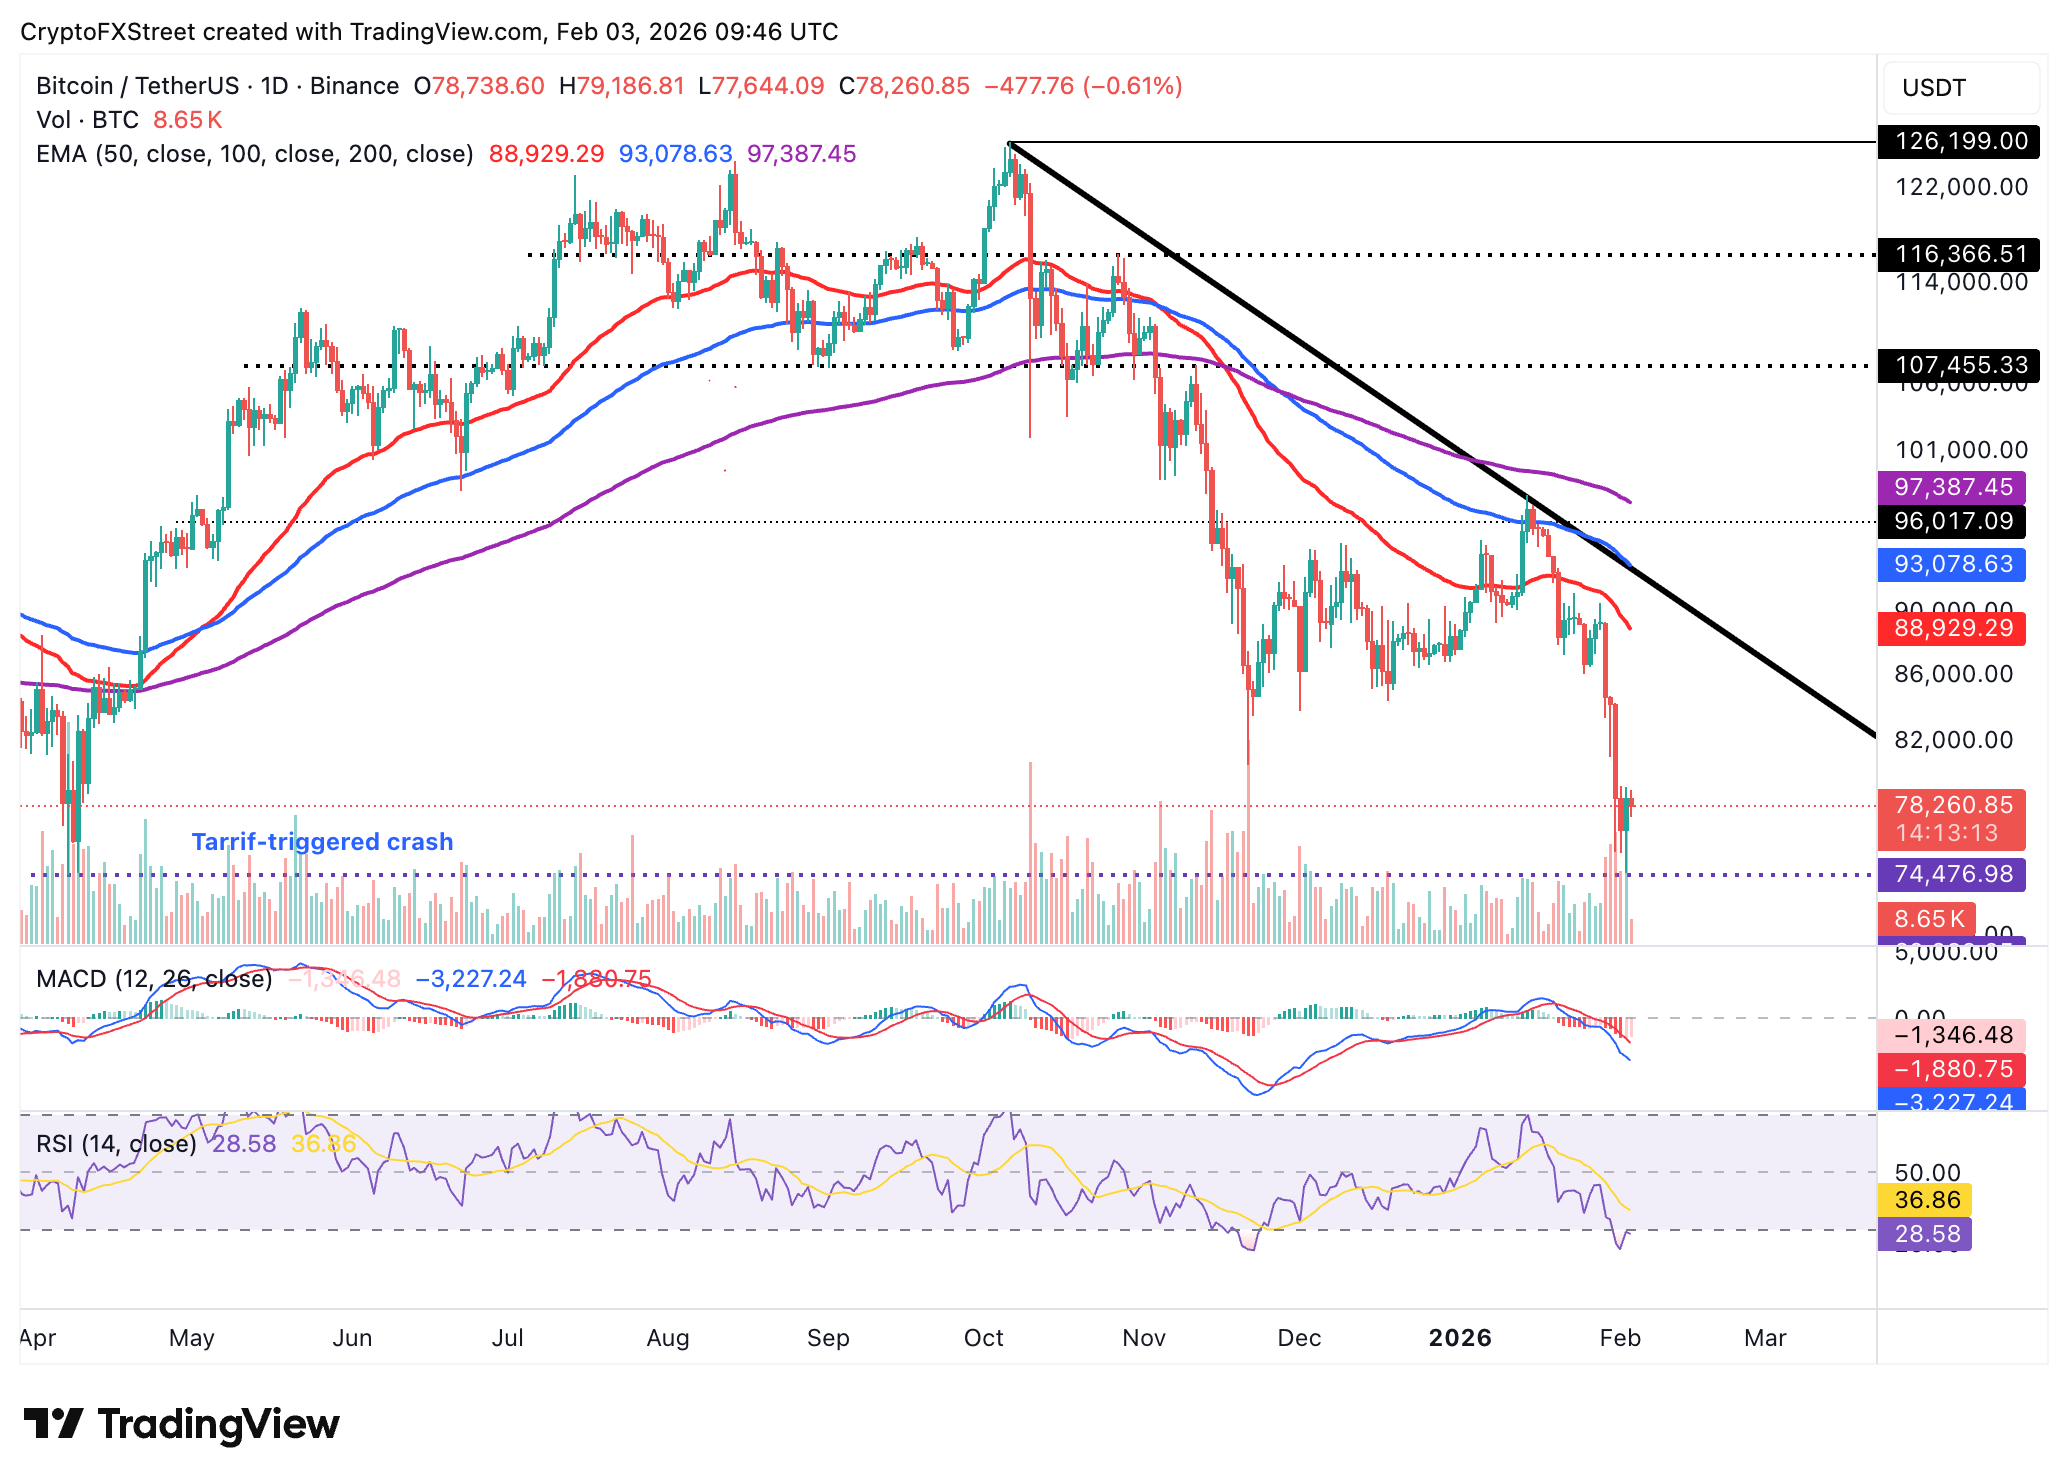
Chart of the day: Bitcoin clings to support as recovery loses momentum
Bitcoin remains above support at $78,000, trading under pressure and significantly below downward-trending moving averages, which adds to the overall bearish outlook. The 50-day Exponential Moving Average (EMA) at $88,929, the 100-day EMA at $93,078 and the 200-day EMA at $97,387 slope downward as headwinds intensify.
Similarly, the Moving Average Convergence Divergence (MACD) indicator is below its signal line on the daily chart, while the red histogram bars expand, prompting investors to reduce their risk exposure.
The Relative Strength Index (RSI) on the same chart is at 28.6 (oversold), indicating intense bearish momentum. Still, oversold conditions suggest that sellers are overextended, and a rebound could be in the offing.
Closing below immediate support at $78,000 may exacerbate the sell-off toward Monday’s low at $74,604. Conversely, a break above $80,000 may help restore confidence in Bitcoin’s ability to sustain the uptrend.
Altcoins technical outlook: Ethereum, XRP bears tighten grip
Ethereum is trading below $2,300, and technical analysis shows weakness, led by the Moving Average Convergence Divergence (MACD) indicator, which is below its signal line on the daily chart. The red histogram bars are still expanding below the zero line, which may prompt investors to sell ETH.
The RSI at 26.5 on the same chart is oversold, signaling intense bearish momentum, but it also suggests that seller exhaustion may result in a knee-jerk recovery toward Sunday’s high at $2,476. For now, the path with the least resistance remains downward, with ETH eyeing Monday’s low at $2,157.

As for XRP, bulls are clinging to immediate support at $1.60 after recovery stalled at Monday’s high of $1.66. The path with the least friction remains downward, underscoring the sliding 50-day EMA at $1.94, the 100-day EMA at $2.09 and the 200-day EMA at $2.24.
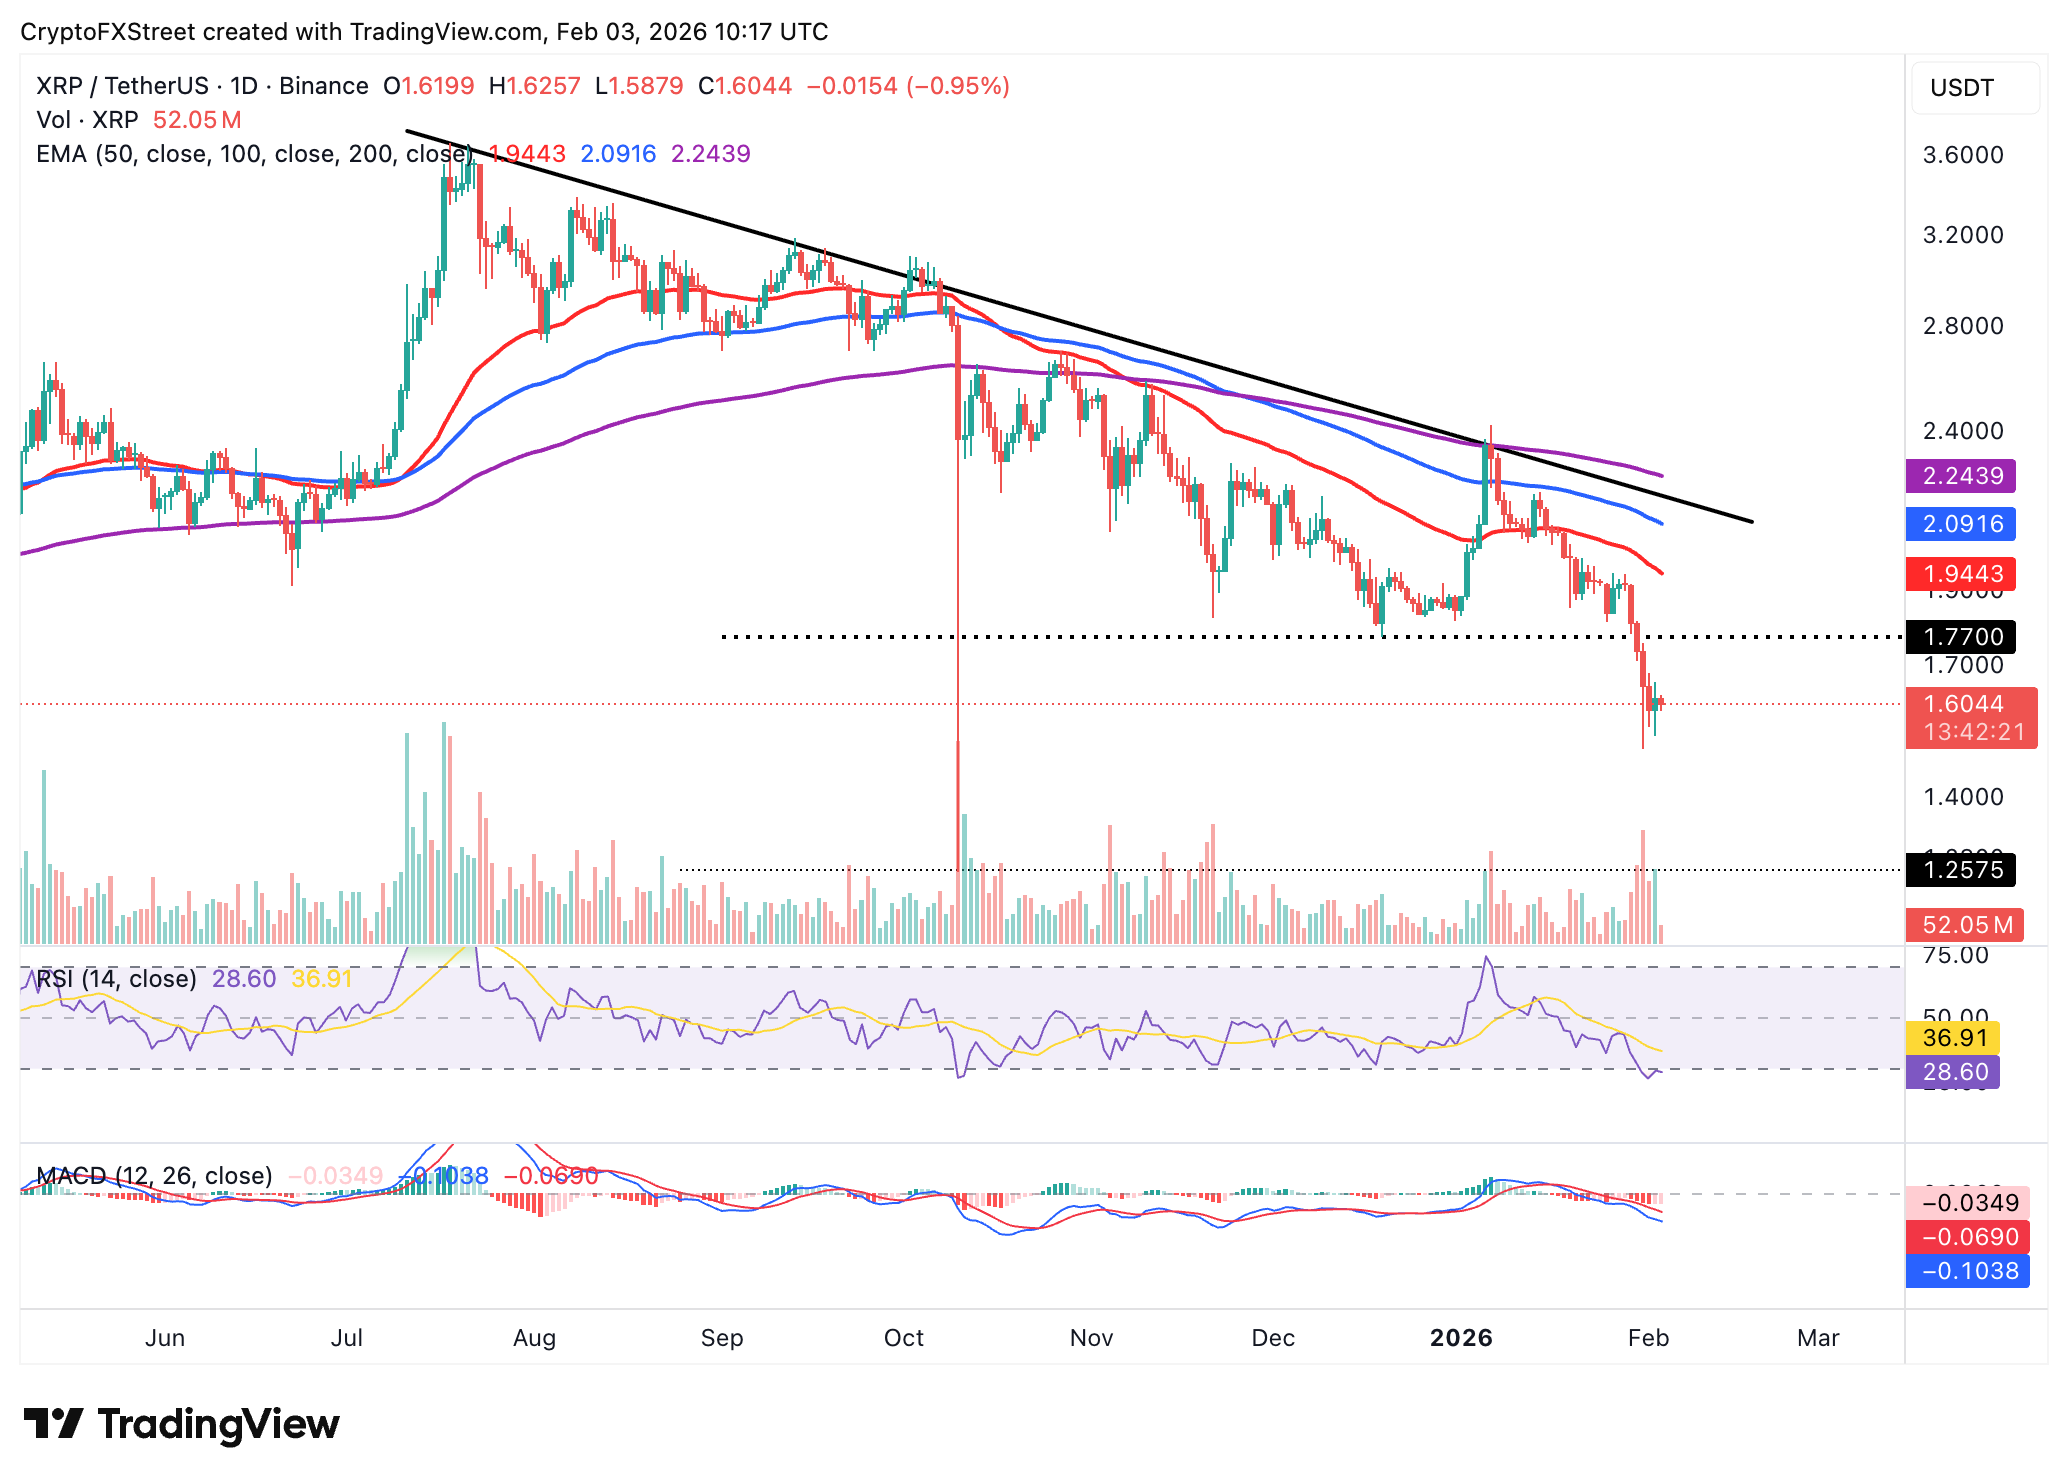
Investors are likely to continue reducing their risk exposure as the MACD indicator slips further below the signal line on the daily chart. However, the red histogram bars are contracting, signaling incoming relief as bearish momentum shrinks.
Still, the RSI is at 28.6 on the same chart, with an extending decline likely to trigger another sell-off toward support at $1.50. Conversely, a daily close above $1.60 may encourage traders to lean into risk, paving the way for another breakout attempt above Monday’s high at $1.66.
Crypto ETF FAQs
An Exchange-Traded Fund (ETF) is an investment vehicle or an index that tracks the price of an underlying asset. ETFs can not only track a single asset, but a group of assets and sectors. For example, a Bitcoin ETF tracks Bitcoin’s price. ETF is a tool used by investors to gain exposure to a certain asset.
Yes. The first Bitcoin futures ETF in the US was approved by the US Securities & Exchange Commission in October 2021. A total of seven Bitcoin futures ETFs have been approved, with more than 20 still waiting for the regulator’s permission. The SEC says that the cryptocurrency industry is new and subject to manipulation, which is why it has been delaying crypto-related futures ETFs for the last few years.
Yes. The SEC approved in January 2024 the listing and trading of several Bitcoin spot Exchange-Traded Funds, opening the door to institutional capital and mainstream investors to trade the main crypto currency. The decision was hailed by the industry as a game changer.
The main advantage of crypto ETFs is the possibility of gaining exposure to a cryptocurrency without ownership, reducing the risk and cost of holding the asset. Other pros are a lower learning curve and higher security for investors since ETFs take charge of securing the underlying asset holdings. As for the main drawbacks, the main one is that as an investor you can’t have direct ownership of the asset, or, as they say in crypto, “not your keys, not your coins.” Other disadvantages are higher costs associated with holding crypto since ETFs charge fees for active management. Finally, even though investing in ETFs reduces the risk of holding an asset, price swings in the underlying cryptocurrency are likely to be reflected in the investment vehicle too.
Bài viết đề xuất


