


Ripple Price Forecast: XRP steadies after sell-off as low on-chain activity, retail interest weigh
- XRP rebounds from last week’s support at $1.50 but struggles below resistance at $1.77.
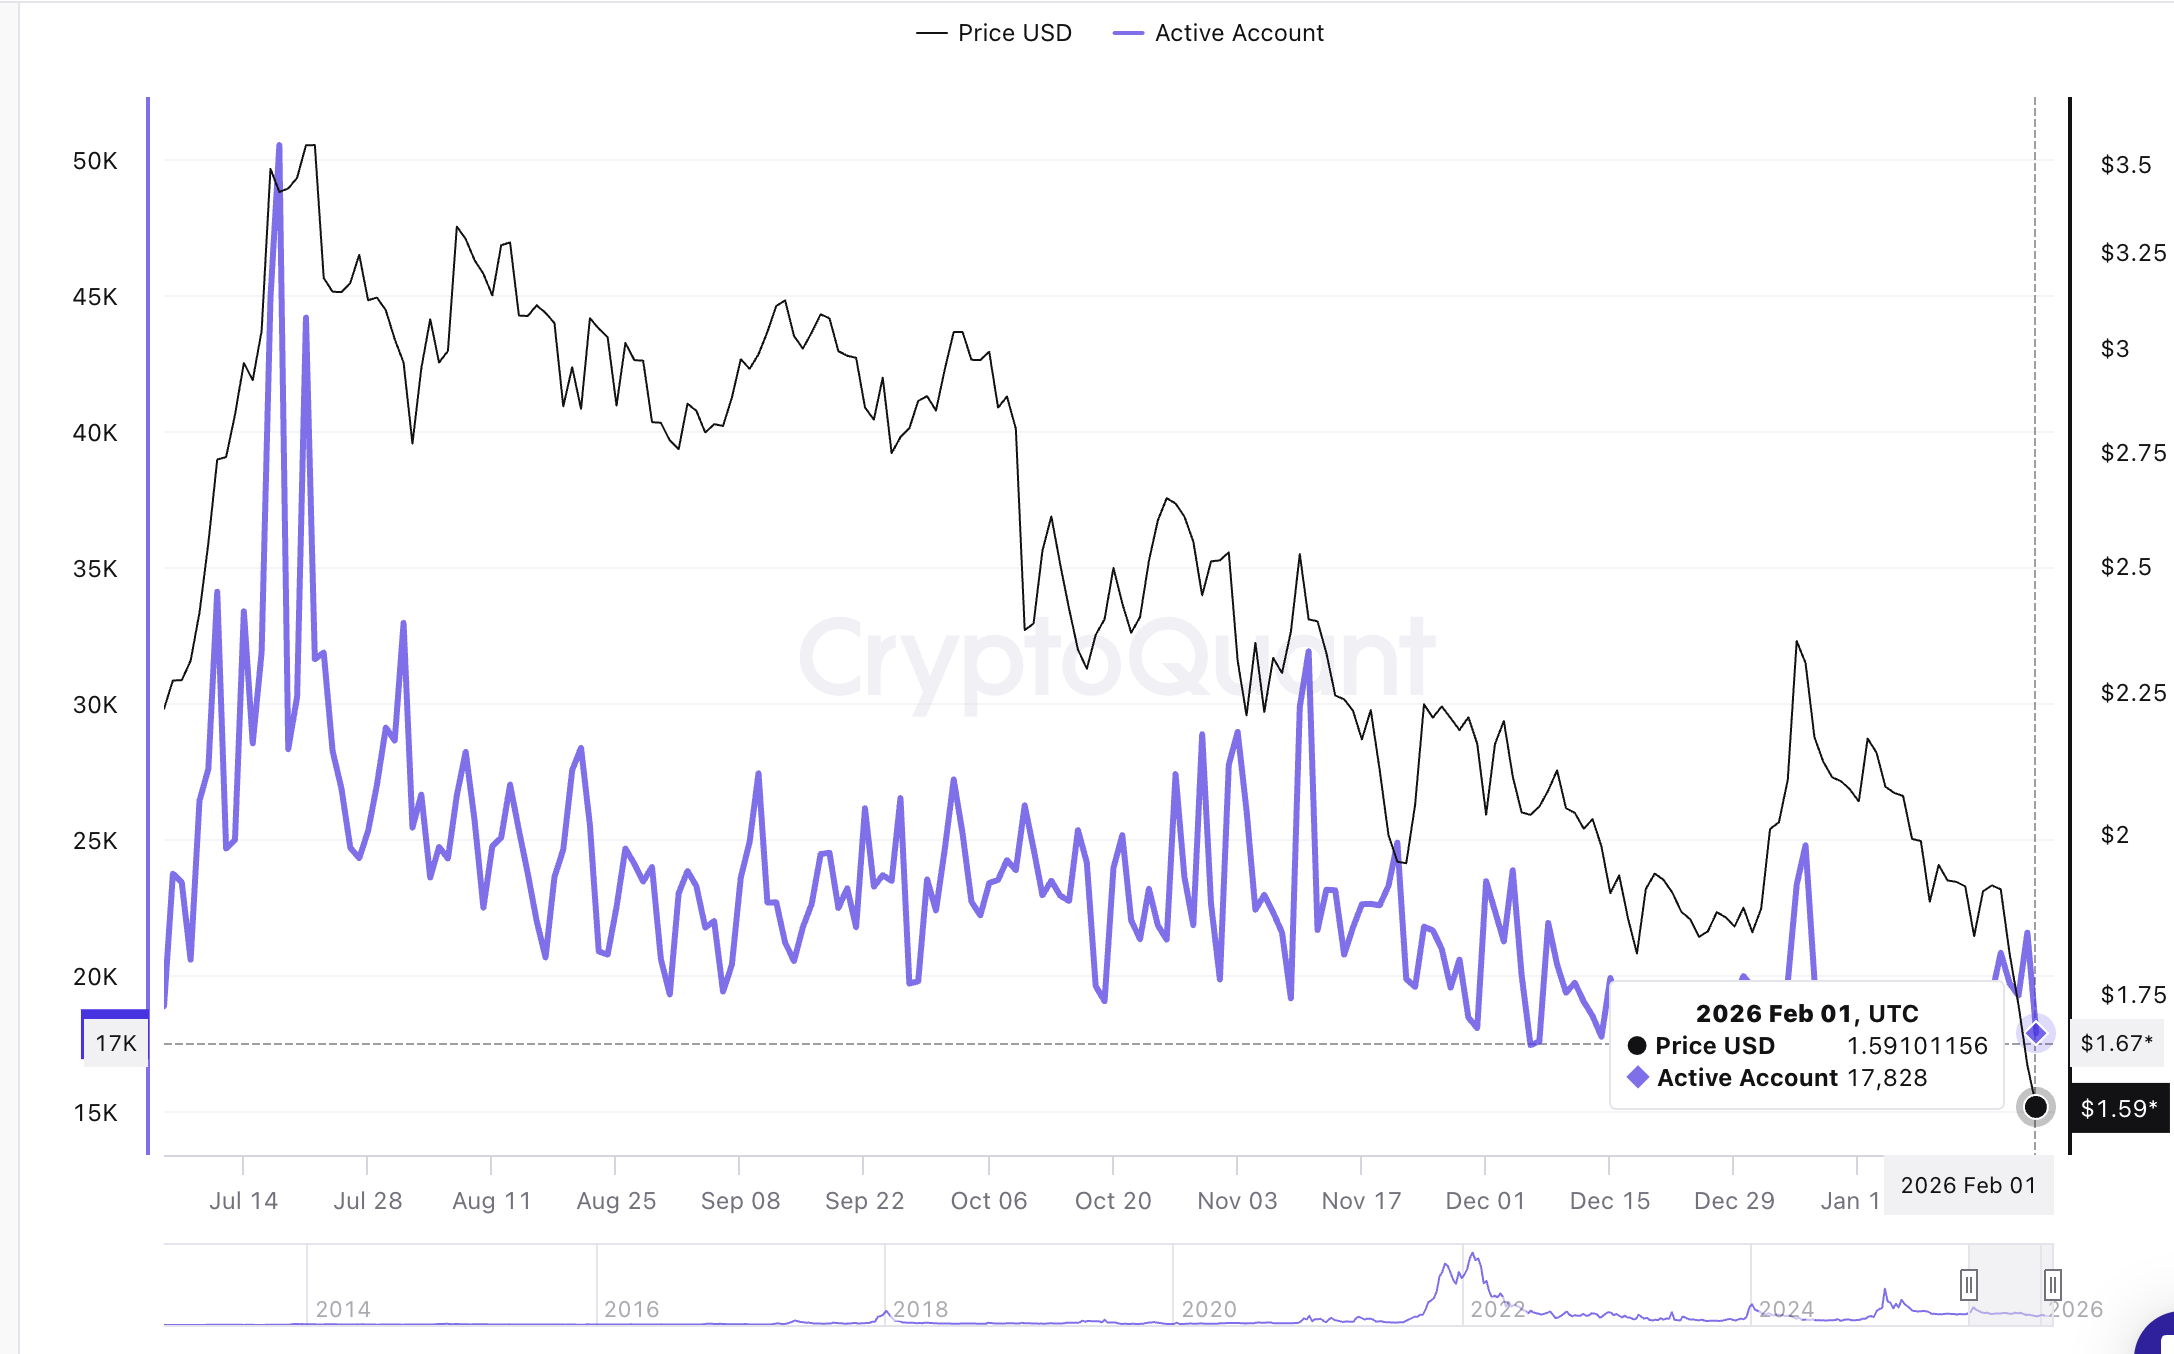
- Active addresses on the XRP Ledger dropped below 18,000 on Sunday amid risk-averse sentiment.
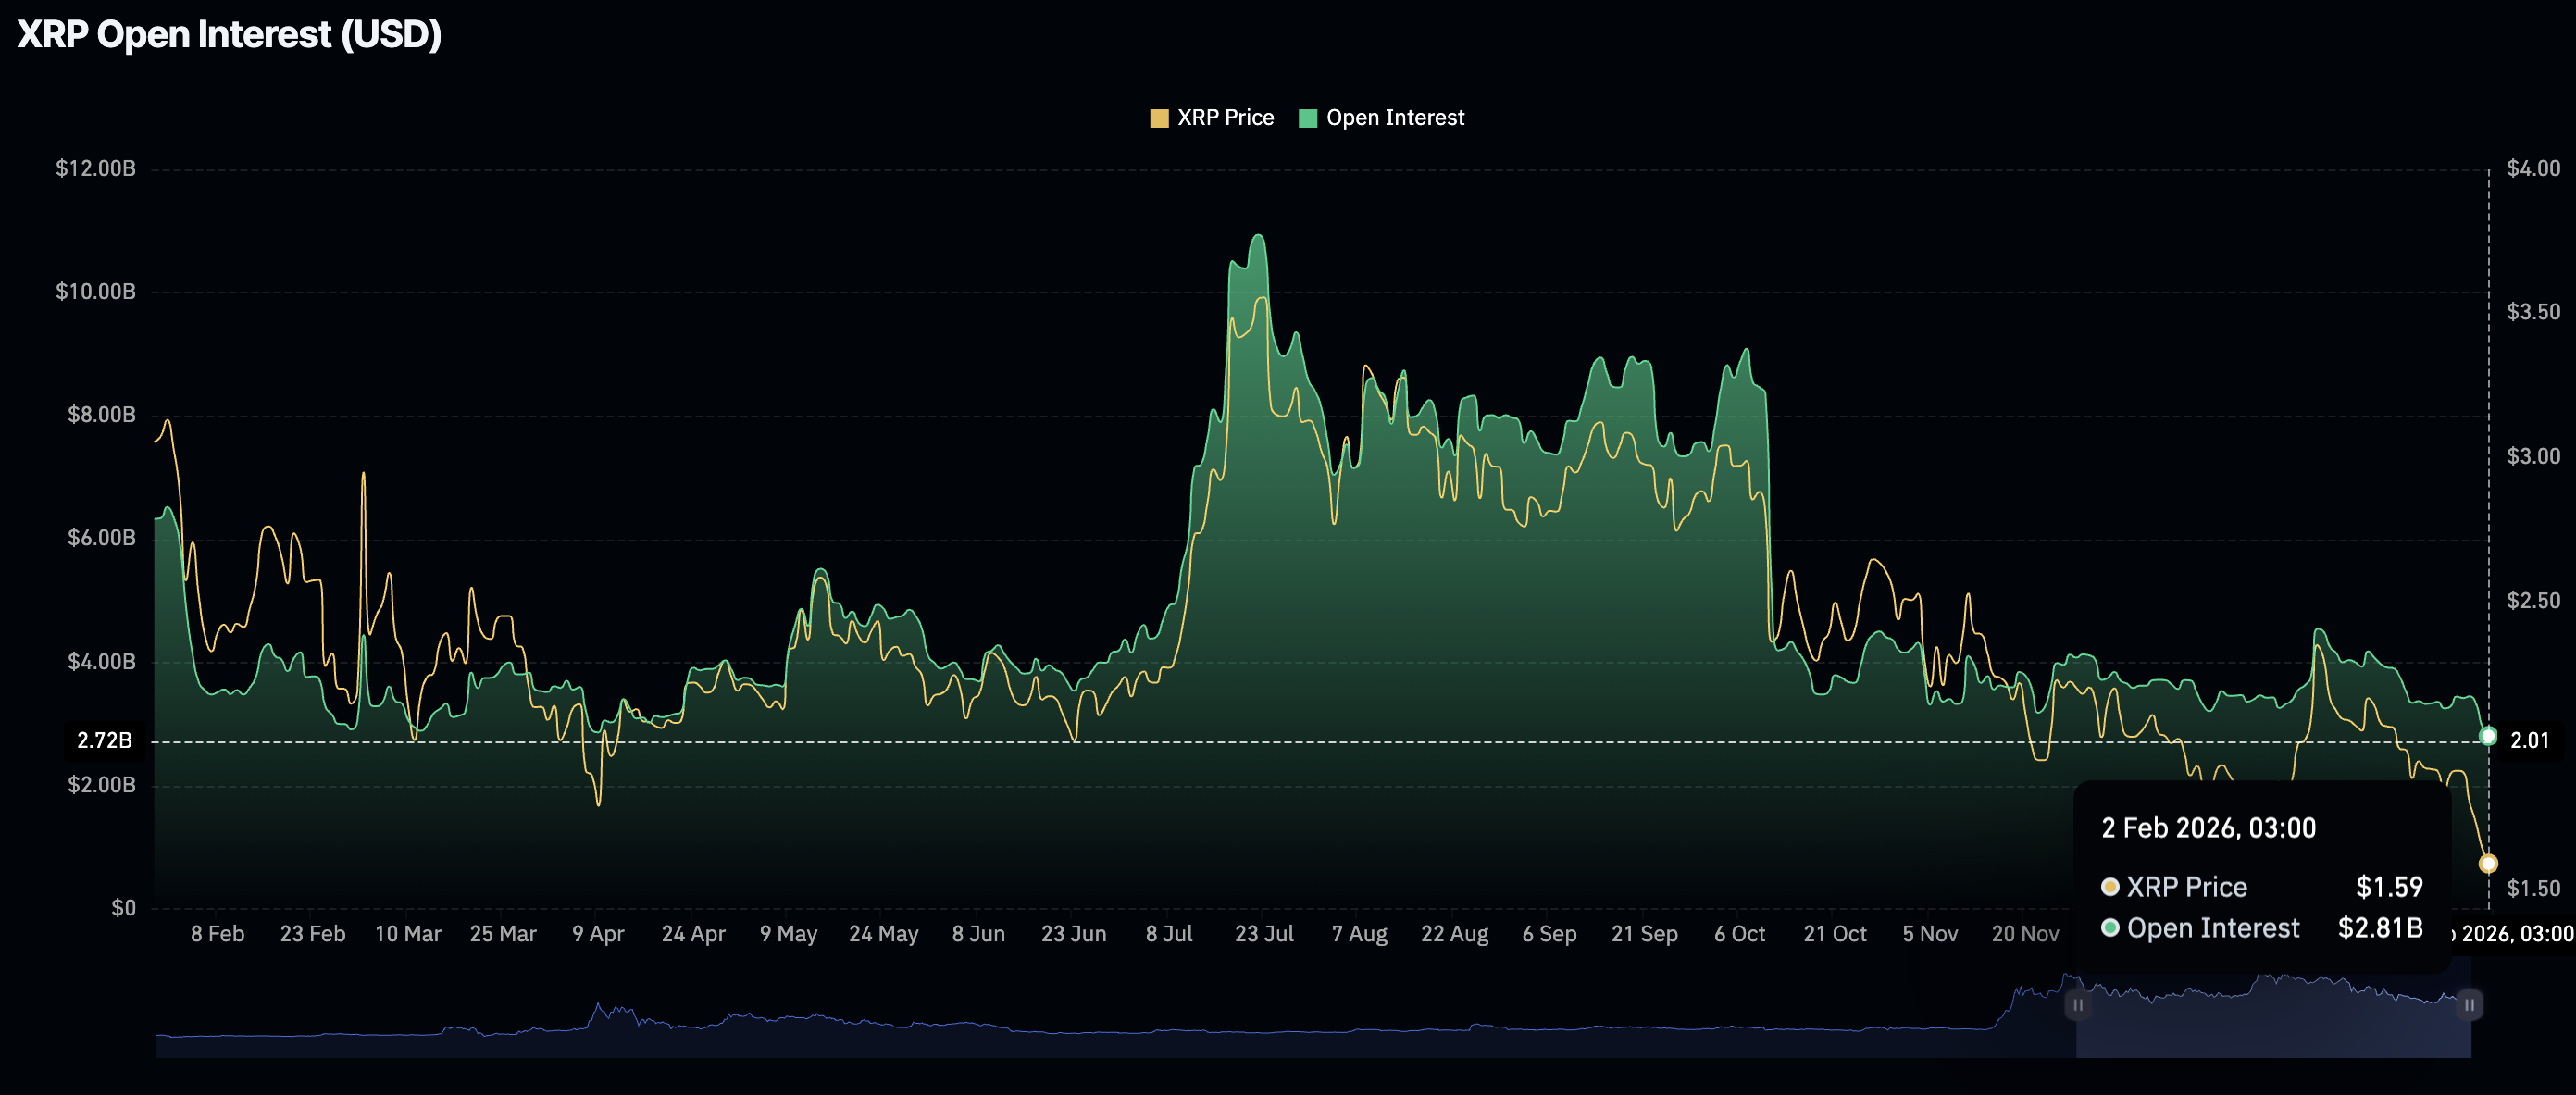
- Retail interest in XRP continues to decline, with futures Open Interest dropping to $2.81 billion.
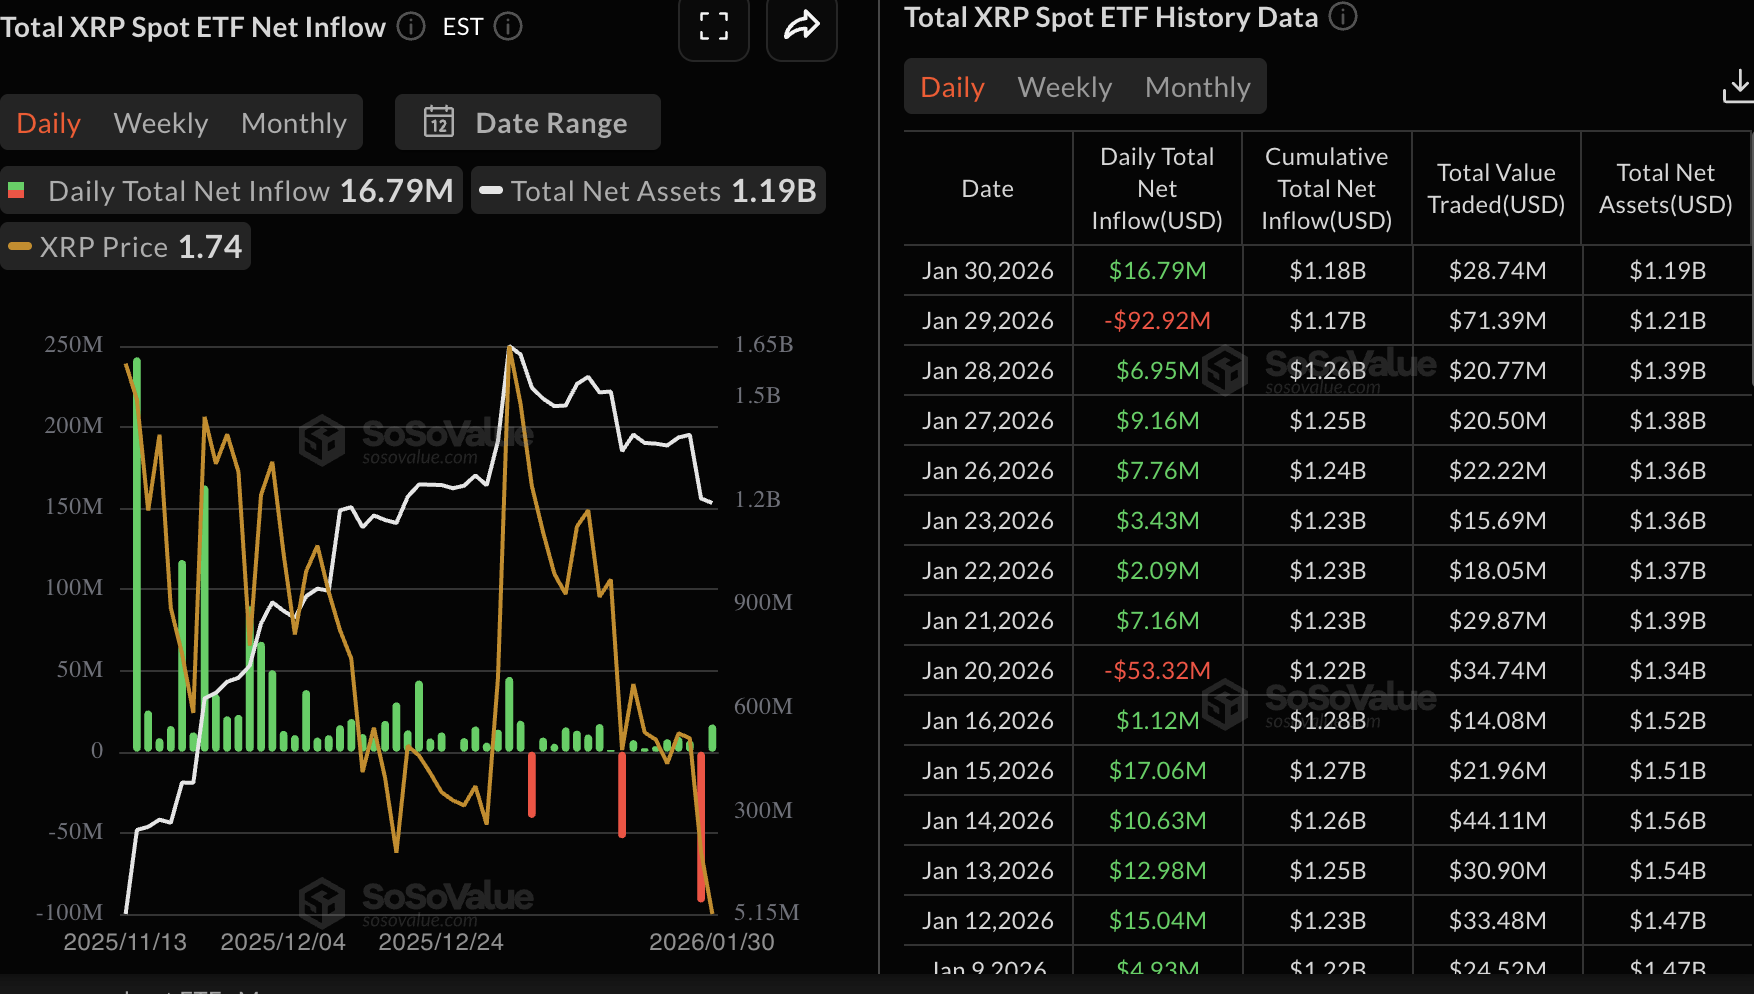
- XRP ETF inflows returned on Friday with nearly $17 million after suffering a record single-day outflow of $93 million.
Ripple (XRP) is trading above $1.60 on Monday, attempting to recover from last week’s sharp decline that tested support at $1.50. Although the cross-border remittance token is up nearly 2% so far intraday, weakening on-chain metrics and declining retail participation suggest the recovery may face headwinds.
Retail demand slows as XRP ETFs resume inflows
Institutional investors turned to XRP as losses spread across the crypto market, sinking funds into spot Exchange-Traded Funds (ETFs). The crypto investment products, tracking XRP spot price, recorded inflows of nearly $17 million on Friday after recording the largest single-day outflow since launch of nearly $93 million on Thursday.
ETF flows serve as a gauge for market sentiment, with large or steady inflows indicating that investors are confident XRP could sustain recovery in the short-term.
Meanwhile, retail interest in XRP extended its bearish trend, as OI dropped to $2.81 billion on Monday, from $2.97 billion the previous day. Open Interest (OI) tracks the total notional value of outstanding futures contracts, making it a key indicator of market participation.
The declining OI suggests investors lack confidence in XRP’s ability to maintain its upward momentum. More importantly, falling OI indicates that traders are closing positions rather than opening new ones, weakening the crucial tailwind XRP needs to sustain a recovery.
Subsequently, addresses actively transacting on the XRP Ledger (XRPL) corrected to approximately 18,000 as of Sunday, underscoring low on-chain participation. The Active Addresses metric rose to roughly 21,500 on Saturday but quickly erased those gains as demand shrank, weighing on the price.
Technical outlook: XRP bulls attempt recovery
XRP is trading at $1.62, rising from the day's open at $1.59. The 50-day Exponential Moving Average (EMA) at $1.96, the 100-day EMA at $2.10, and the 200 the 200-day EMA at $2.25 slope lower and stack above the price, capping rebounds and preserving a bearish structure.
Meanwhile, the Moving Average Convergence Divergence (MACD) line holds below the signal line on the daily chart, with the negative histogram expanding below the zero line, prompting investors to reduce their exposure. However, the Relative Strength (RSI) at 28 (oversold) on the same chart is edging slightly higher, hinting at seller exhaustion.
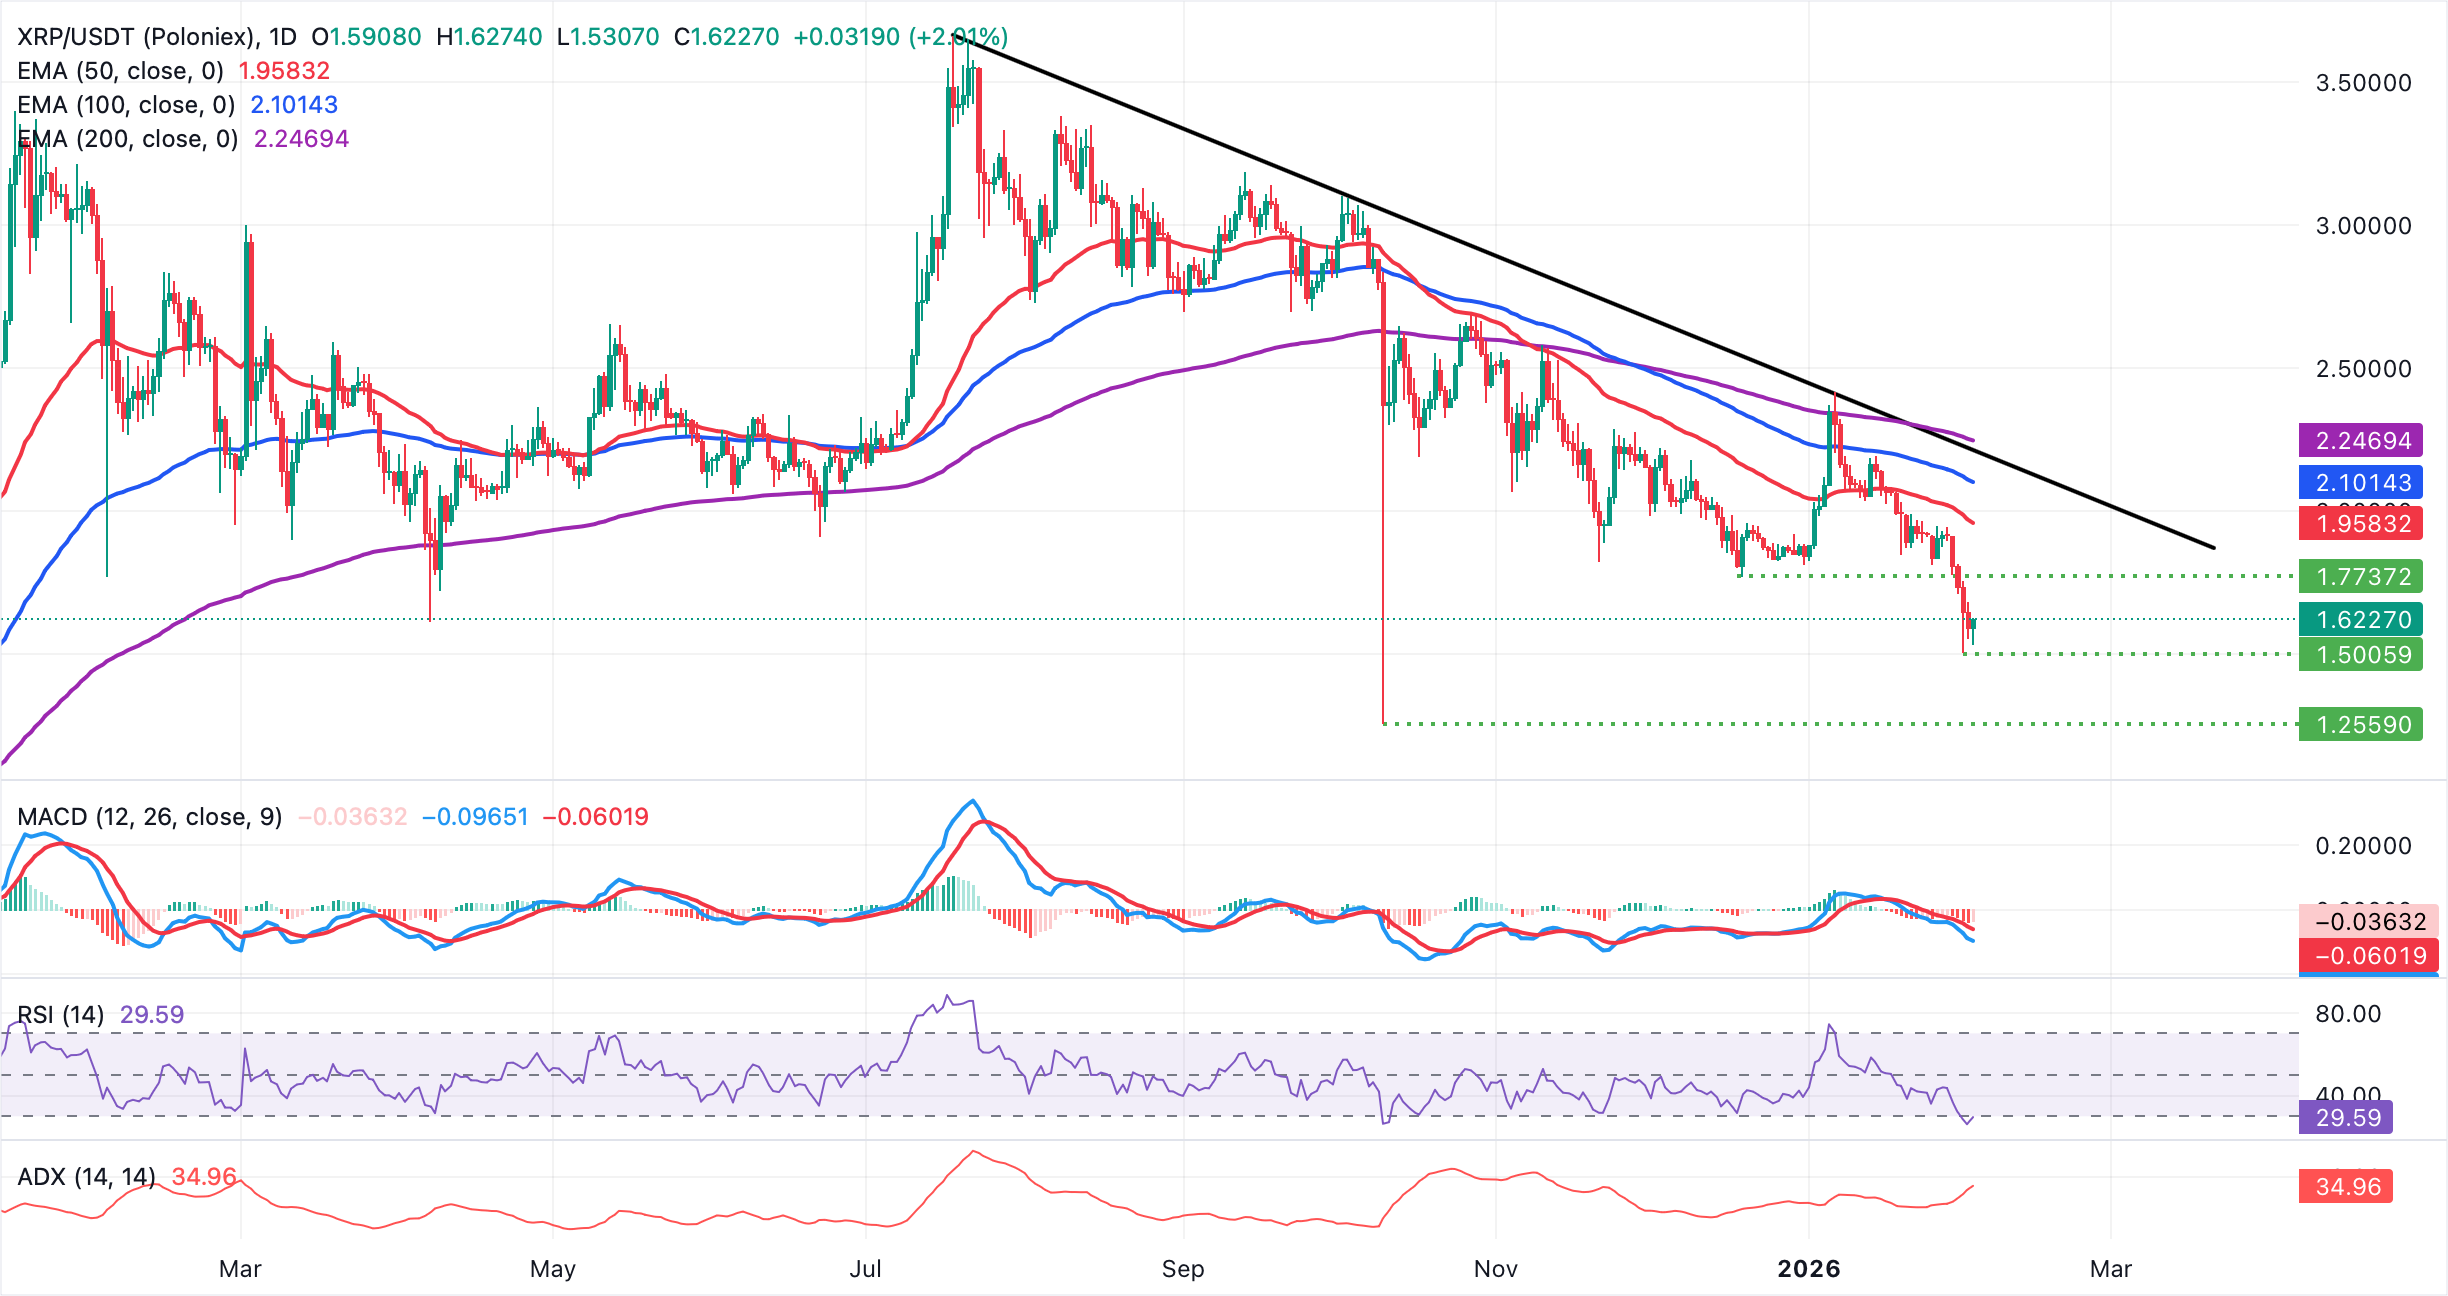
The descending trend line from $3.66 limits gains, with resistance seen at $2.21 likely to cap rebound attempts. A daily close below the immediate support at $1.60 would keep bears in control and XRP poised to test the next demand zone at $1.50.
Crypto ETF FAQs
An Exchange-Traded Fund (ETF) is an investment vehicle or an index that tracks the price of an underlying asset. ETFs can not only track a single asset, but a group of assets and sectors. For example, a Bitcoin ETF tracks Bitcoin’s price. ETF is a tool used by investors to gain exposure to a certain asset.
Yes. The first Bitcoin futures ETF in the US was approved by the US Securities & Exchange Commission in October 2021. A total of seven Bitcoin futures ETFs have been approved, with more than 20 still waiting for the regulator’s permission. The SEC says that the cryptocurrency industry is new and subject to manipulation, which is why it has been delaying crypto-related futures ETFs for the last few years.
Yes. The SEC approved in January 2024 the listing and trading of several Bitcoin spot Exchange-Traded Funds, opening the door to institutional capital and mainstream investors to trade the main crypto currency. The decision was hailed by the industry as a game changer.
The main advantage of crypto ETFs is the possibility of gaining exposure to a cryptocurrency without ownership, reducing the risk and cost of holding the asset. Other pros are a lower learning curve and higher security for investors since ETFs take charge of securing the underlying asset holdings. As for the main drawbacks, the main one is that as an investor you can’t have direct ownership of the asset, or, as they say in crypto, “not your keys, not your coins.” Other disadvantages are higher costs associated with holding crypto since ETFs charge fees for active management. Finally, even though investing in ETFs reduces the risk of holding an asset, price swings in the underlying cryptocurrency are likely to be reflected in the investment vehicle too.
(The technical analysis of this story was written with the help of an AI tool.)
Bài viết đề xuất


