


Ripple Price Forecast: XRP downside risks escalate as low retail activity clashes with steady ETF inflows
- XRP edges lower below $1.90 amid technical weakness and increasing macroeconomic uncertainty.
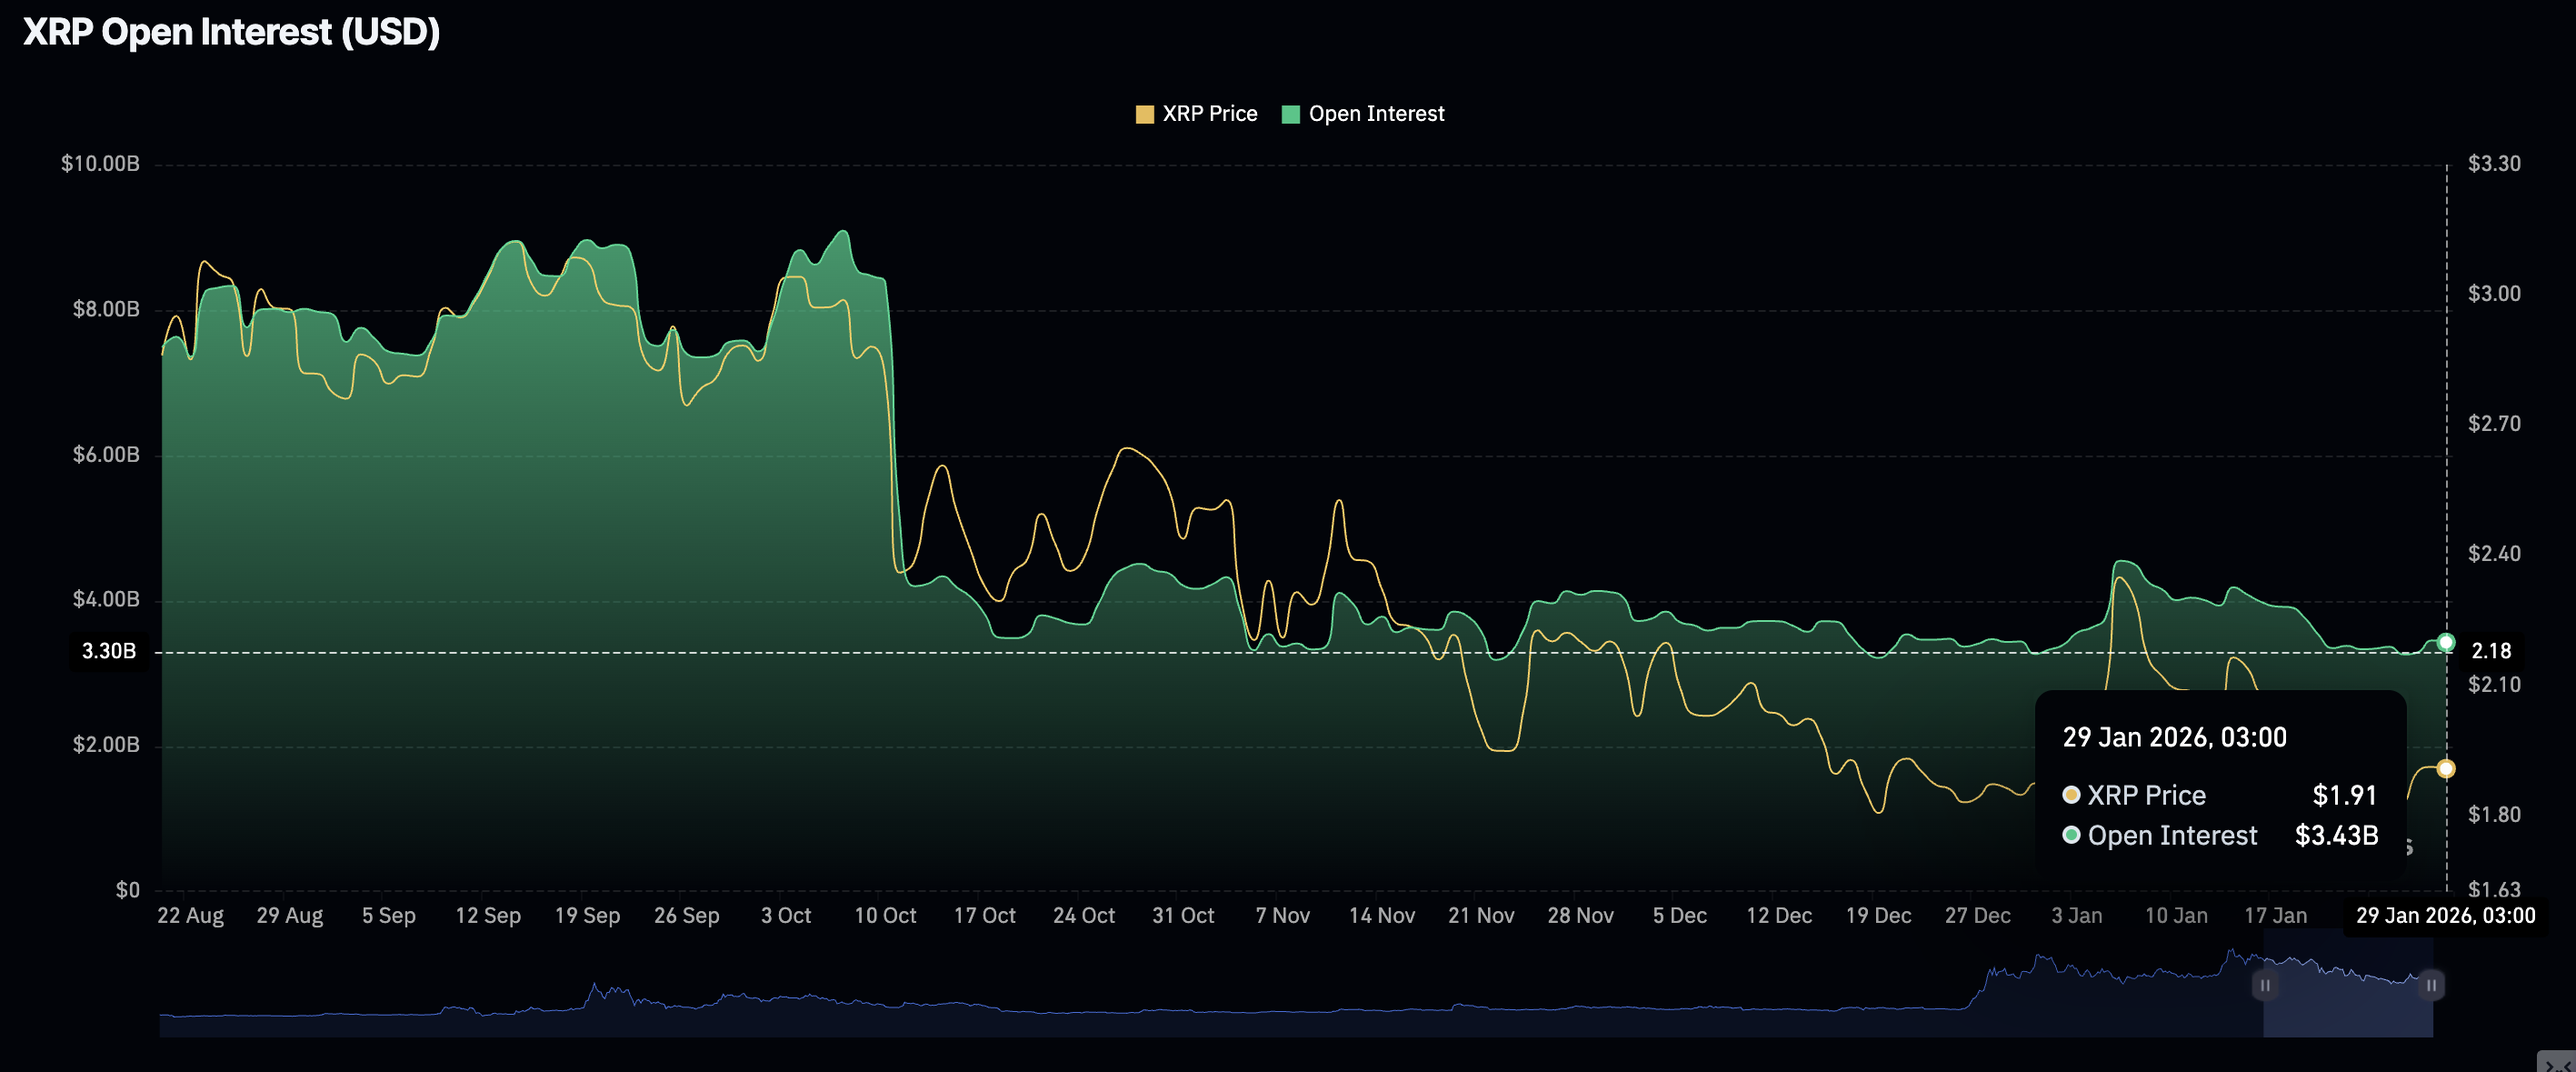
- Retail interest in XRP stalls, with futures Open Interest holding steady at $3.43 billion on Thursday.
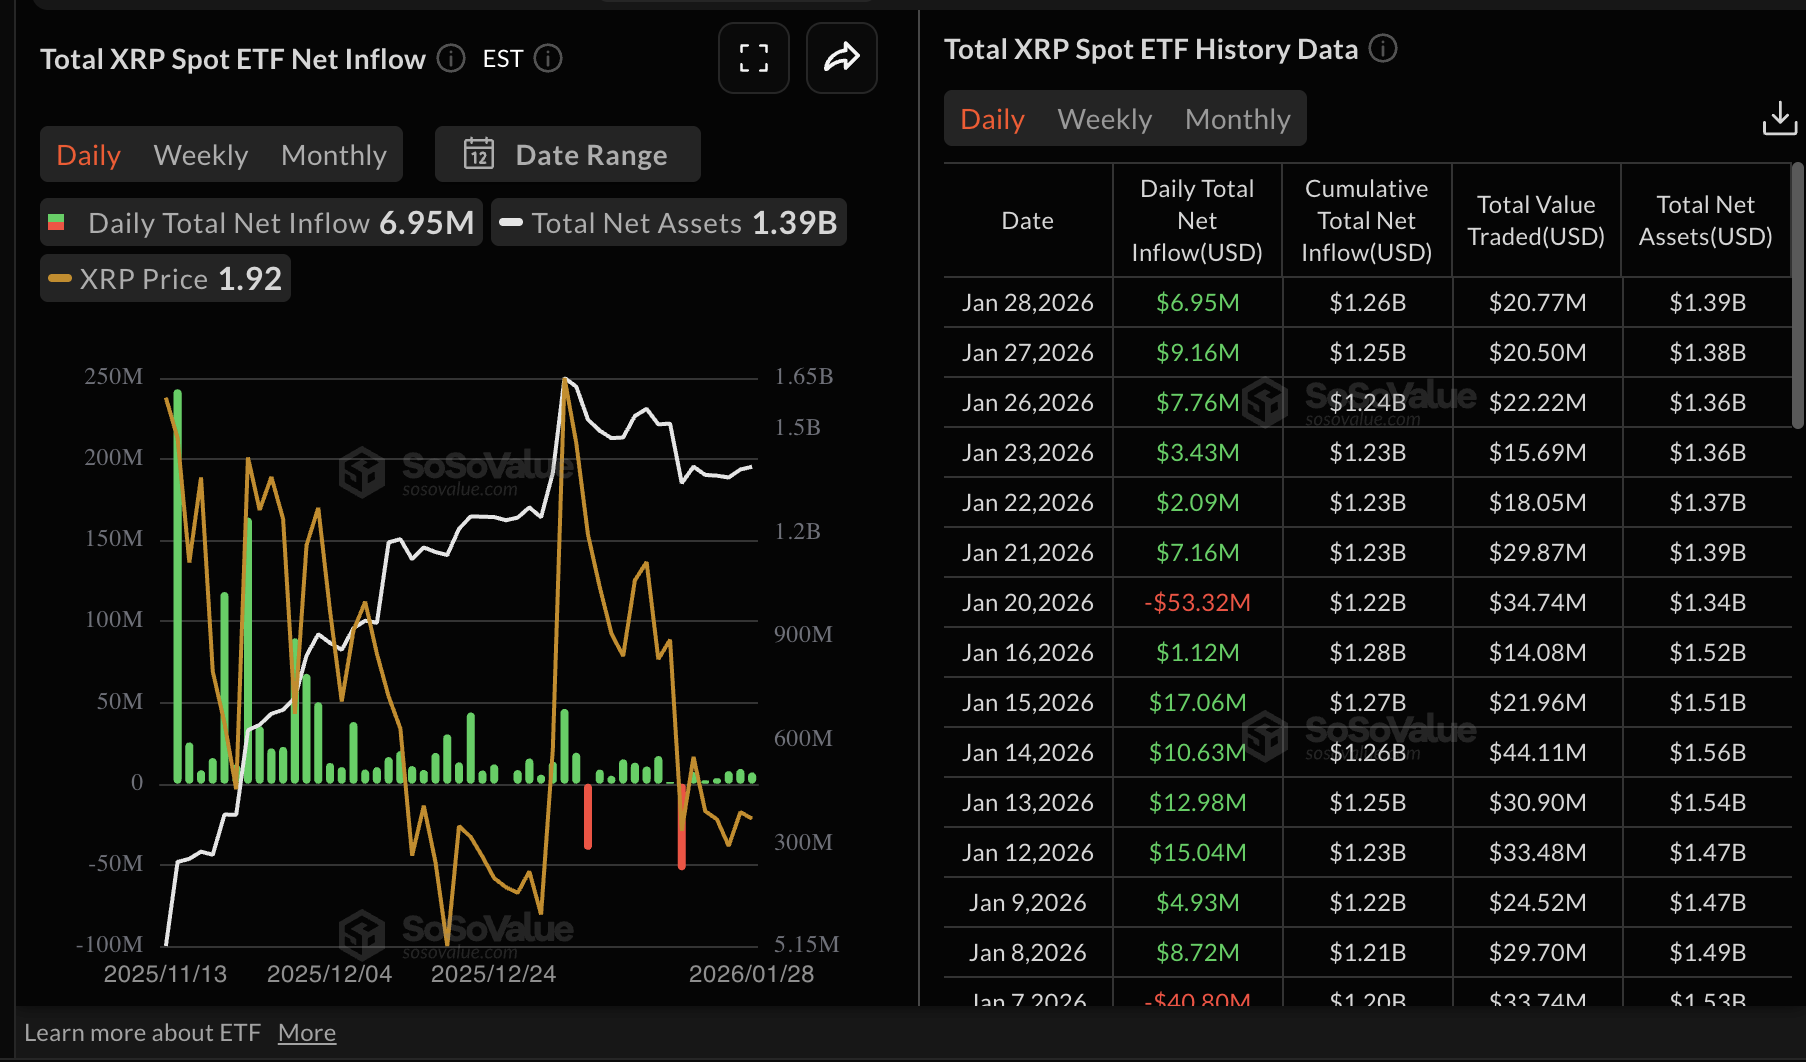
- XRP ETFs extend their inflow streak to six consecutive days, with assets under management reaching $1.39 billion.
Ripple (XRP) is trading below the $1.90 mark at the time of writing on Thursday, extending its recent decline as bearish technical signals converge with broader macroeconomic headwinds.
The Federal Reserve (Fed) left interest rates unchanged in the range of 3.50%-3.75% at the end of its monetary policy meeting on Wednesday, potentially limiting liquidity into high-risk assets like XRP.
Mixed signals as retail interest slows while XRP ETFs extend inflows
The cross-border remittance token faces increasing pressure from diminishing retail participation, evidenced by stagnant futures Open Interest (OI). CoinGlass data shows OI averaging $3.43 billion on Thursday, down from $3.45 billion the previous day.
OI tracks the notional value of outstanding futures contracts; hence, low retail activity indicates that investors lack confidence in the token’s ability to sustain an uptrend. Investors are closing positions rather than opening new ones, depriving XRP of the tailwind to keep its uptrend intact.
Meanwhile, XRP boasts unwavering institutional support through US-listed Exchange-Traded Funds (ETFs), which recorded nearly $7 million in inflows on Wednesday. The cumulative total inflow stands at $1.26 billion, and assets under management at $1.39 billion.
XRP has sustained six consecutive days of inflows, underscoring the growing demand for altcoin-based ETFs. This stands in stark contrast to broader crypto market weakness, which saw Bitcoin (BTC) ETFs record nearly $20 million in outflows on Wednesday.
Technical outlook: XRP struggles as bearish signals weigh on price outlook
XRP is trading amid increasing downside risks, macroeconomic uncertainty and risk-off sentiment in the broader cryptocurrency market. The token remains below the 50-day Exponential Moving Average (EMA) at $2.01, the 100-day EMA at $2.14 and the 200-day EMA at $2.28, underpinning the overall bearish outlook.
Meanwhile, the Relative Strength Index (RSI) is falling to 40 on the daily chart, pointing to a buildup of bearish momentum. Further decline toward oversold territory would trigger an accelerated drop, targeting Sunday’s low at $1.81 and April’s support at $1.61.
The Moving Average Convergence Divergence (MACD) remains below its signal line on the daily chart, prompting traders to sell XRP to protect capital amid headwinds.
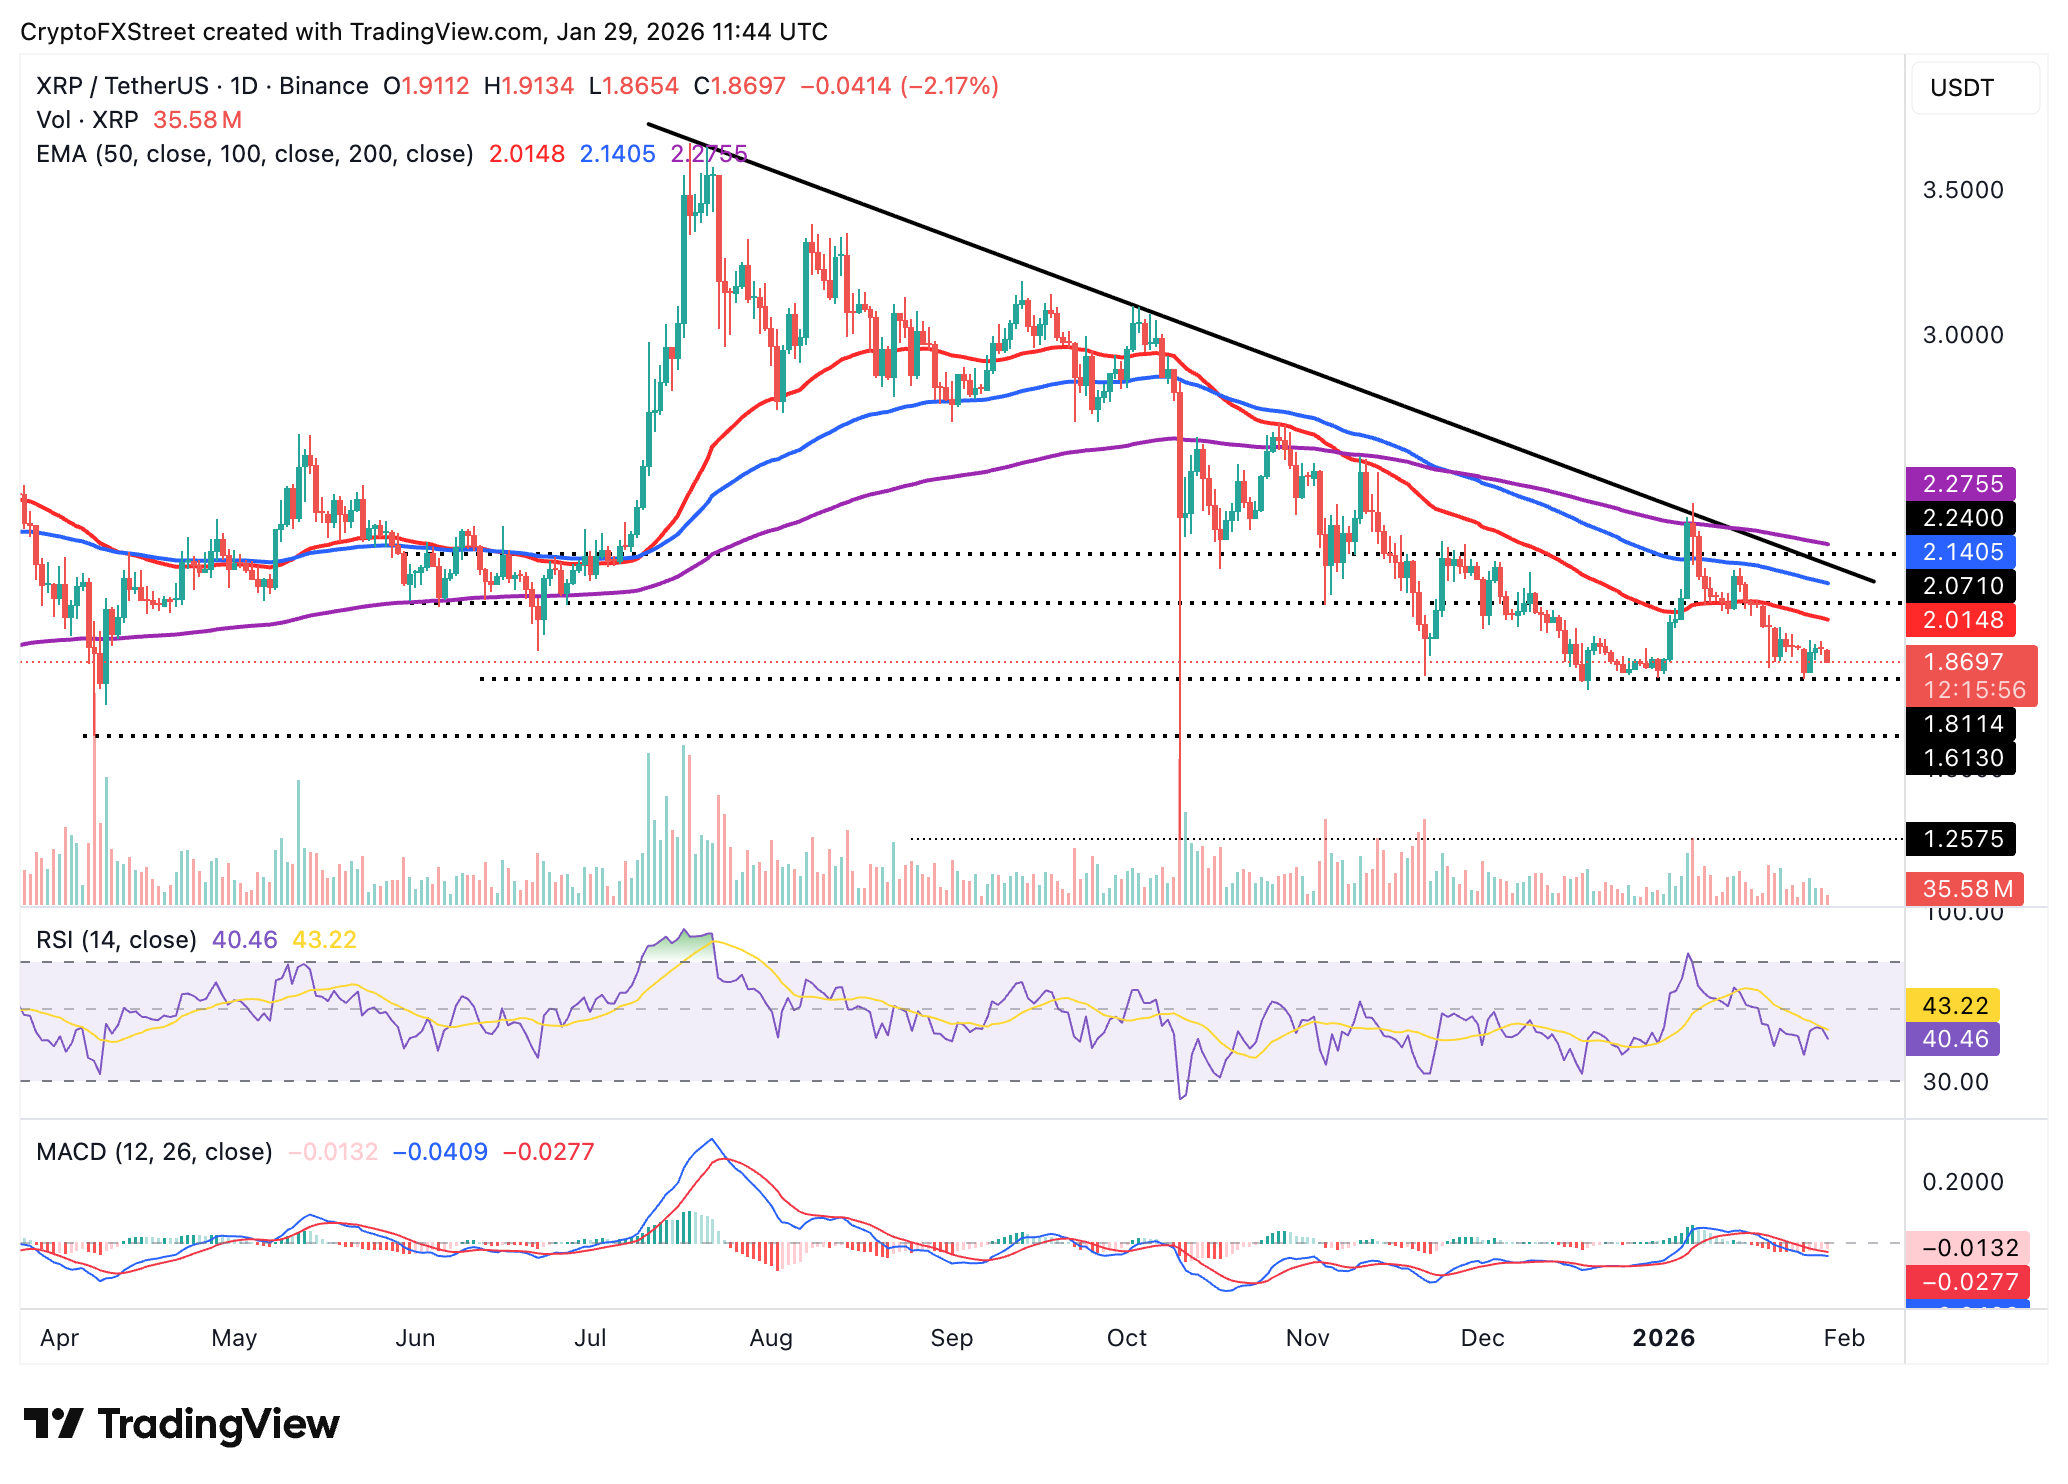
Any attempt to reverse the trend should be accompanied by high trading volume and push above the 50-day EMA resistance at $2.01. Even so, XRP could remain in bearish hands until bulls reclaim the 100-day EMA at $2.14 and the 200-day EMA at $2.28, thereby opening the door for a breakout toward $3.00.
Crypto ETF FAQs
An Exchange-Traded Fund (ETF) is an investment vehicle or an index that tracks the price of an underlying asset. ETFs can not only track a single asset, but a group of assets and sectors. For example, a Bitcoin ETF tracks Bitcoin’s price. ETF is a tool used by investors to gain exposure to a certain asset.
Yes. The first Bitcoin futures ETF in the US was approved by the US Securities & Exchange Commission in October 2021. A total of seven Bitcoin futures ETFs have been approved, with more than 20 still waiting for the regulator’s permission. The SEC says that the cryptocurrency industry is new and subject to manipulation, which is why it has been delaying crypto-related futures ETFs for the last few years.
Yes. The SEC approved in January 2024 the listing and trading of several Bitcoin spot Exchange-Traded Funds, opening the door to institutional capital and mainstream investors to trade the main crypto currency. The decision was hailed by the industry as a game changer.
The main advantage of crypto ETFs is the possibility of gaining exposure to a cryptocurrency without ownership, reducing the risk and cost of holding the asset. Other pros are a lower learning curve and higher security for investors since ETFs take charge of securing the underlying asset holdings. As for the main drawbacks, the main one is that as an investor you can’t have direct ownership of the asset, or, as they say in crypto, “not your keys, not your coins.” Other disadvantages are higher costs associated with holding crypto since ETFs charge fees for active management. Finally, even though investing in ETFs reduces the risk of holding an asset, price swings in the underlying cryptocurrency are likely to be reflected in the investment vehicle too.
Bài viết đề xuất


