

Polygon Price Forecast: POL extends gains after $250 million worth of deals to tap US stablecoin payments
- Polygon edges higher by over 5% on Wednesday, extending a 4% rebound from $0.15 the previous day.
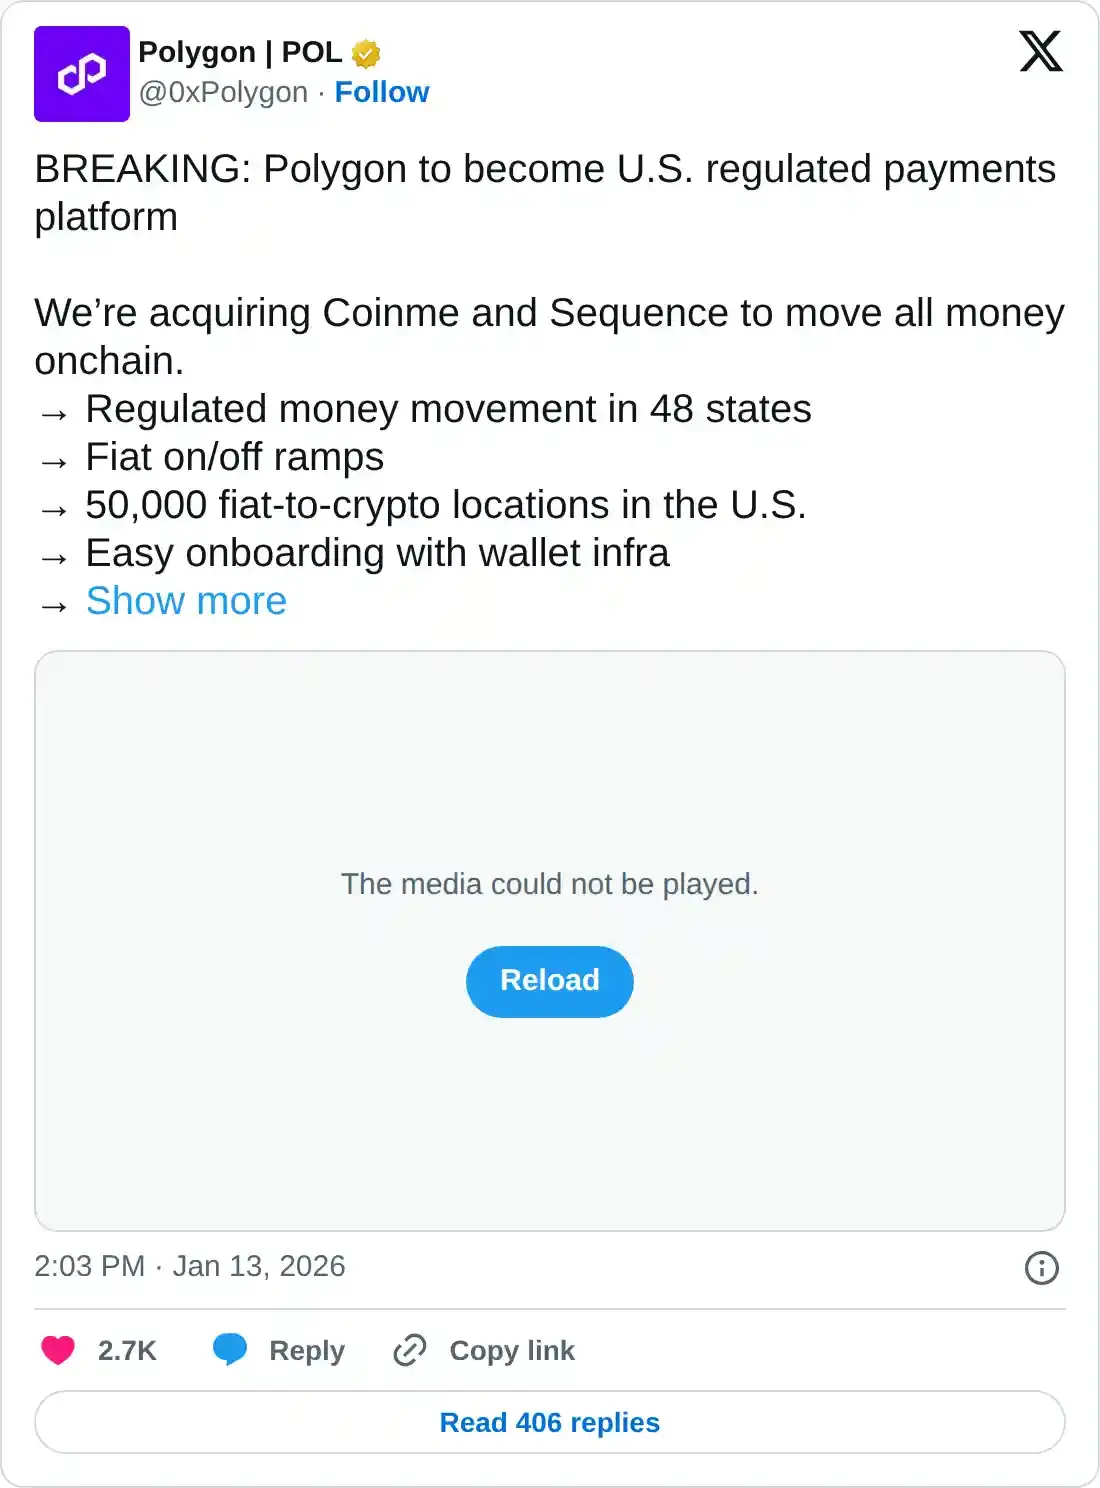
- Polygon acquired Coinme and Sequence for over $250 million on Tuesday, regulating on-chain money movement in 48 states.
- On-chain data shows a steady buying spree among large wallet investors this year.
Polygon (POL) trades in the green, recording 5% gains at press time on Wednesday and extending the previous day's 4% gains. The Ethereum (ETH) scaling ecosystem acquired Coinme and Sequence for over $250 million on Tuesday, stepping closer to becoming a US-regulated blockchain payments company. On-chain data shows that large-wallet investors, commonly called whales, are increasing their exposure to POL, signaling renewed demand.
Technically, Polygon’s recovery could reverse the prevailing downtrend with a potential breakout of a year-long resistance trendline.
Polygon shifts toward a US-regulated blockchain payments company
Polygon announced on Tuesday the acquisition of Coinme, a Bitcoin ATM kiosk provider, and Sequence, a provider of crypto wallet infrastructure, for over $250 million. This marks a development in Polygon’s Open Money Stack roadmap, a cross-border stablecoin payment infrastructure.
The acquisition provides access to regulated on-chain money movement in 48 states with money-transmitter licenses, a licensed wallet infrastructure, and 50,000 retail locations in the US, along with on- and off-ramps to power fiat-to-crypto conversion.
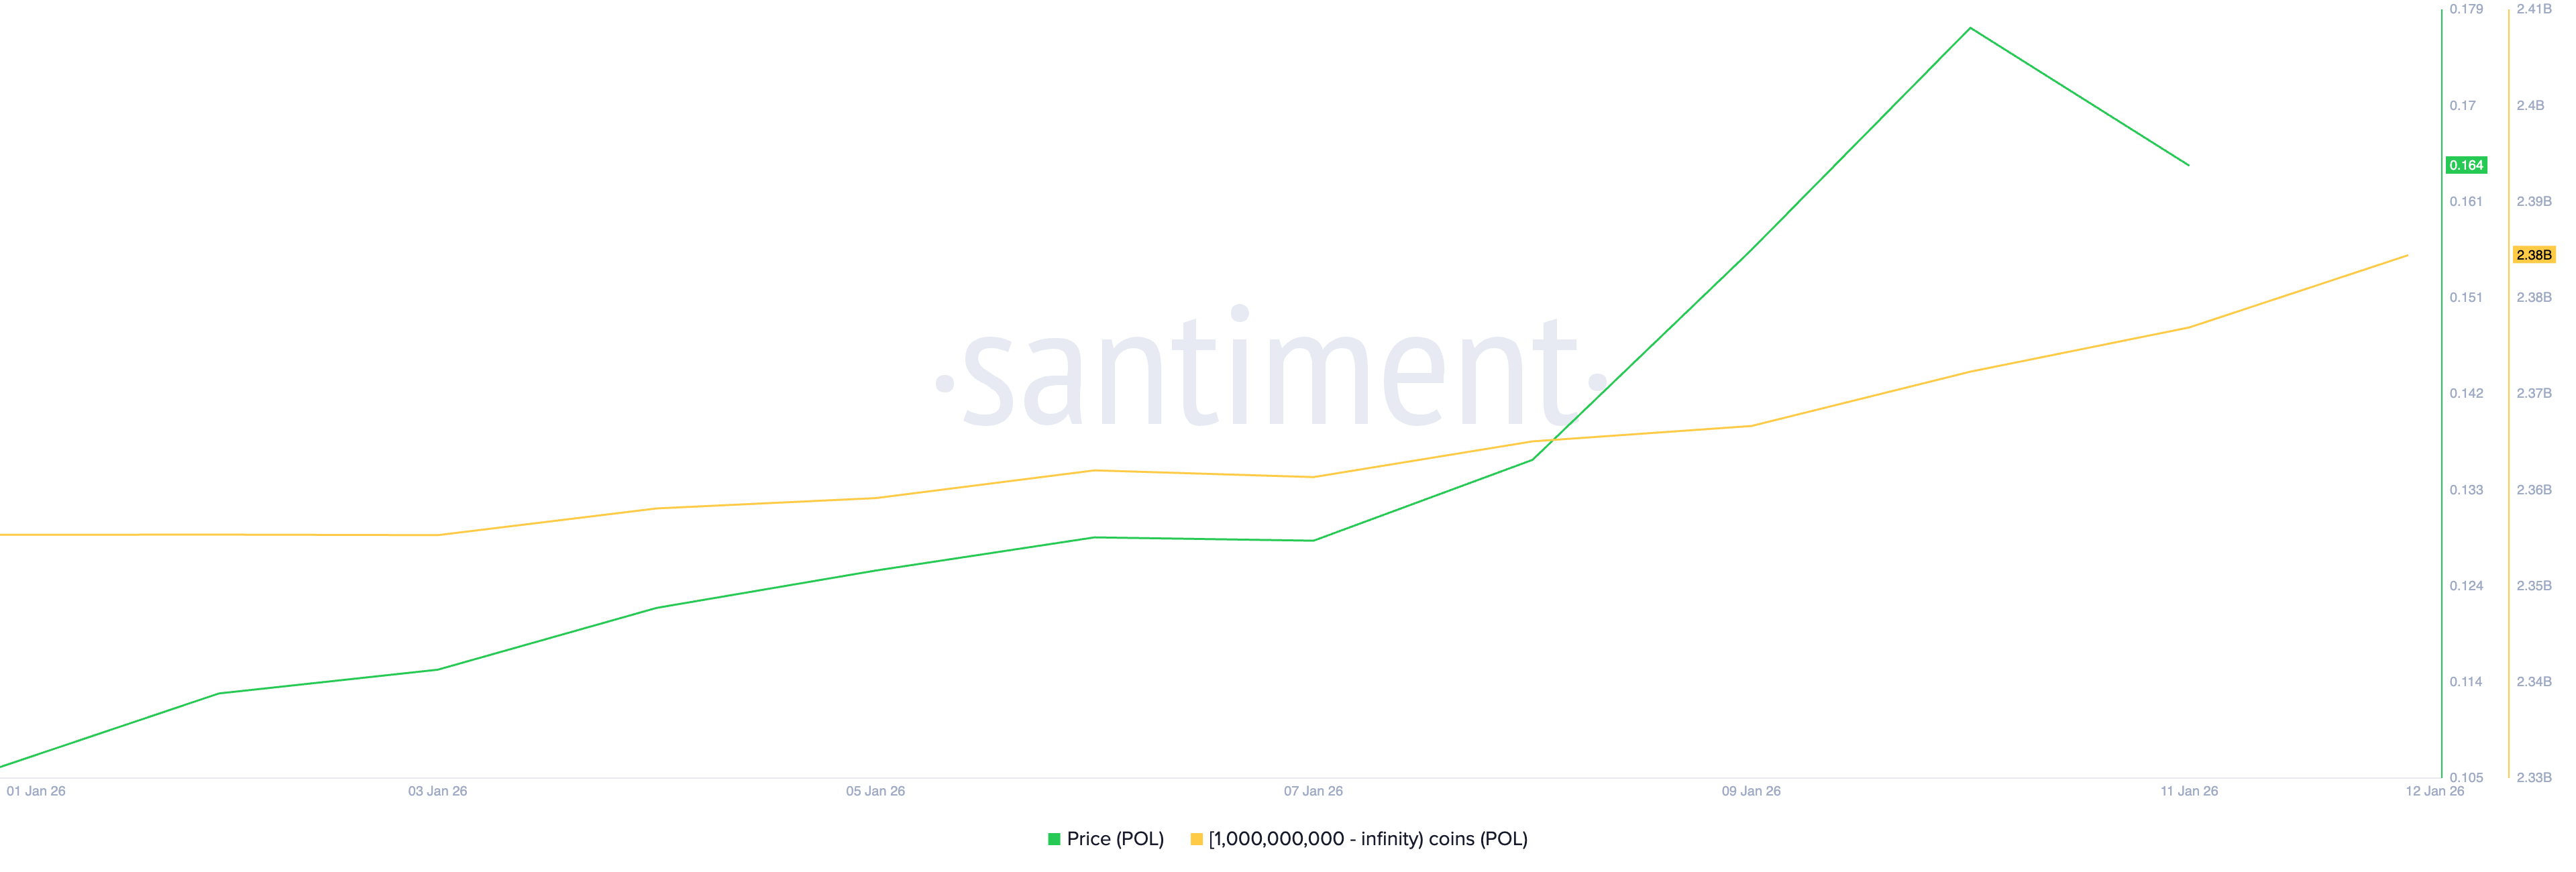
Amid this expansion, Santiment data shows steady demand from whales, which are increasing their holdings. Whales with over 1 billion POL hold 2.38 billion tokens, up from 2.35 billion on January 1, reflecting renewed interest this year.
Polygon must surpass this trendline for a bullish 2026
Polygon remains steady above $0.1600 on Wednesday, upholding the 35% gains from the previous week. The Ethereum sidechain ecosystem has recovered over 60% so far in January, approaching a resistance trendline connecting the December 2024 and September 2025 highs on the weekly logarithmic chart.
A decisive close above $0.1639, a key support from the previous year flipped into resistance, and the declining trendline, near $0.1823, could extend the rally toward the $0.2855 level, which capped the recovery in August.
Corroborating the breakout potential, the Moving Average Convergence Divergence (MACD) indicator on the weekly logarithmic chart crosses above its signal line, showing a buy signal. At the same time, the Relative Strength Index (RSI) steadies at 45, close to the halfway line, recovering from the oversold zone and suggesting the bearish momentum has waned.
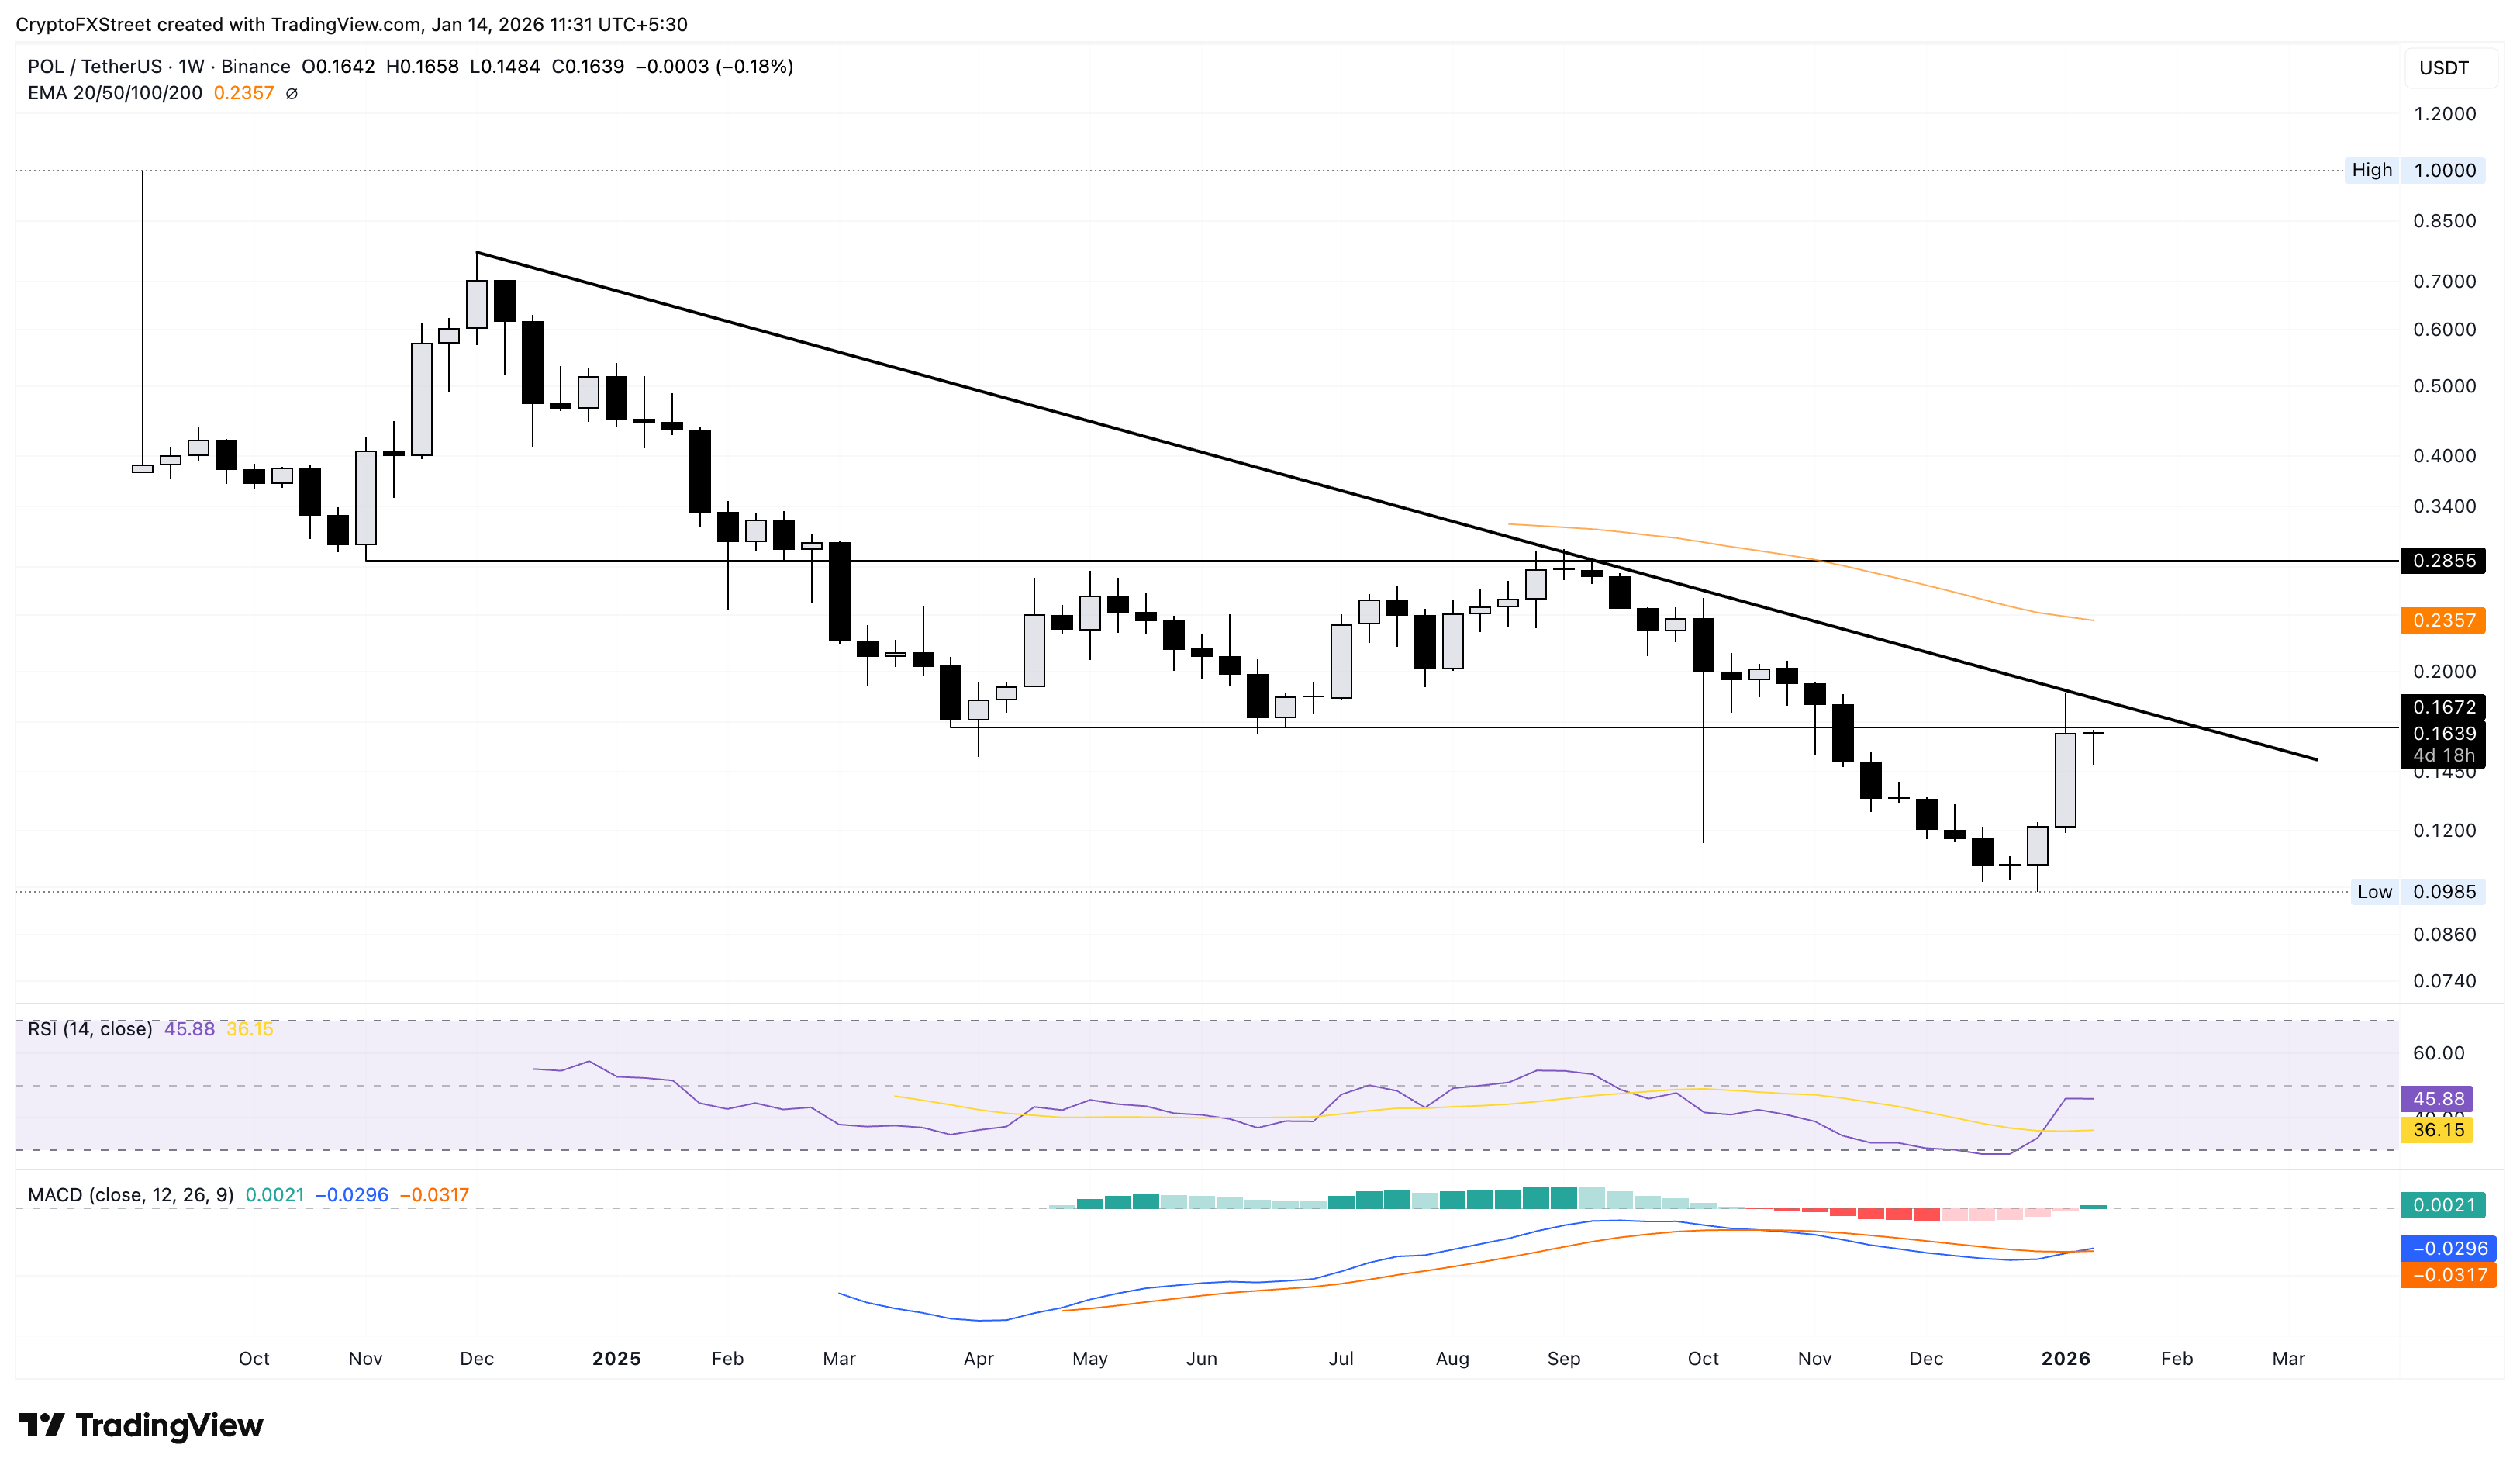
However, a potential reversal below $0.1639 could lead to a decline toward the $0.1000 psychological support level.
Will Polygon exceed the 200-day EMA?
Polygon recovers over 5% at press time on Wednesday, extending the 4% rise from the previous day. The sidechain ecosystem token approaches the 200-day Exponential Moving Average (EMA) at $0.1854, close to the $0.1834 resistance level, which flipped the early November recovery.
If POL exceeds this threshold, it could target the October 13 high at $0.2123.
The RSI at 67 on the daily chart hovers close to the overbought zone, suggesting heightened buying pressure. Additionally, the MACD and its signal line continue to rise, but declining histogram bars suggest overhead pressure suppressing the bullish momentum.
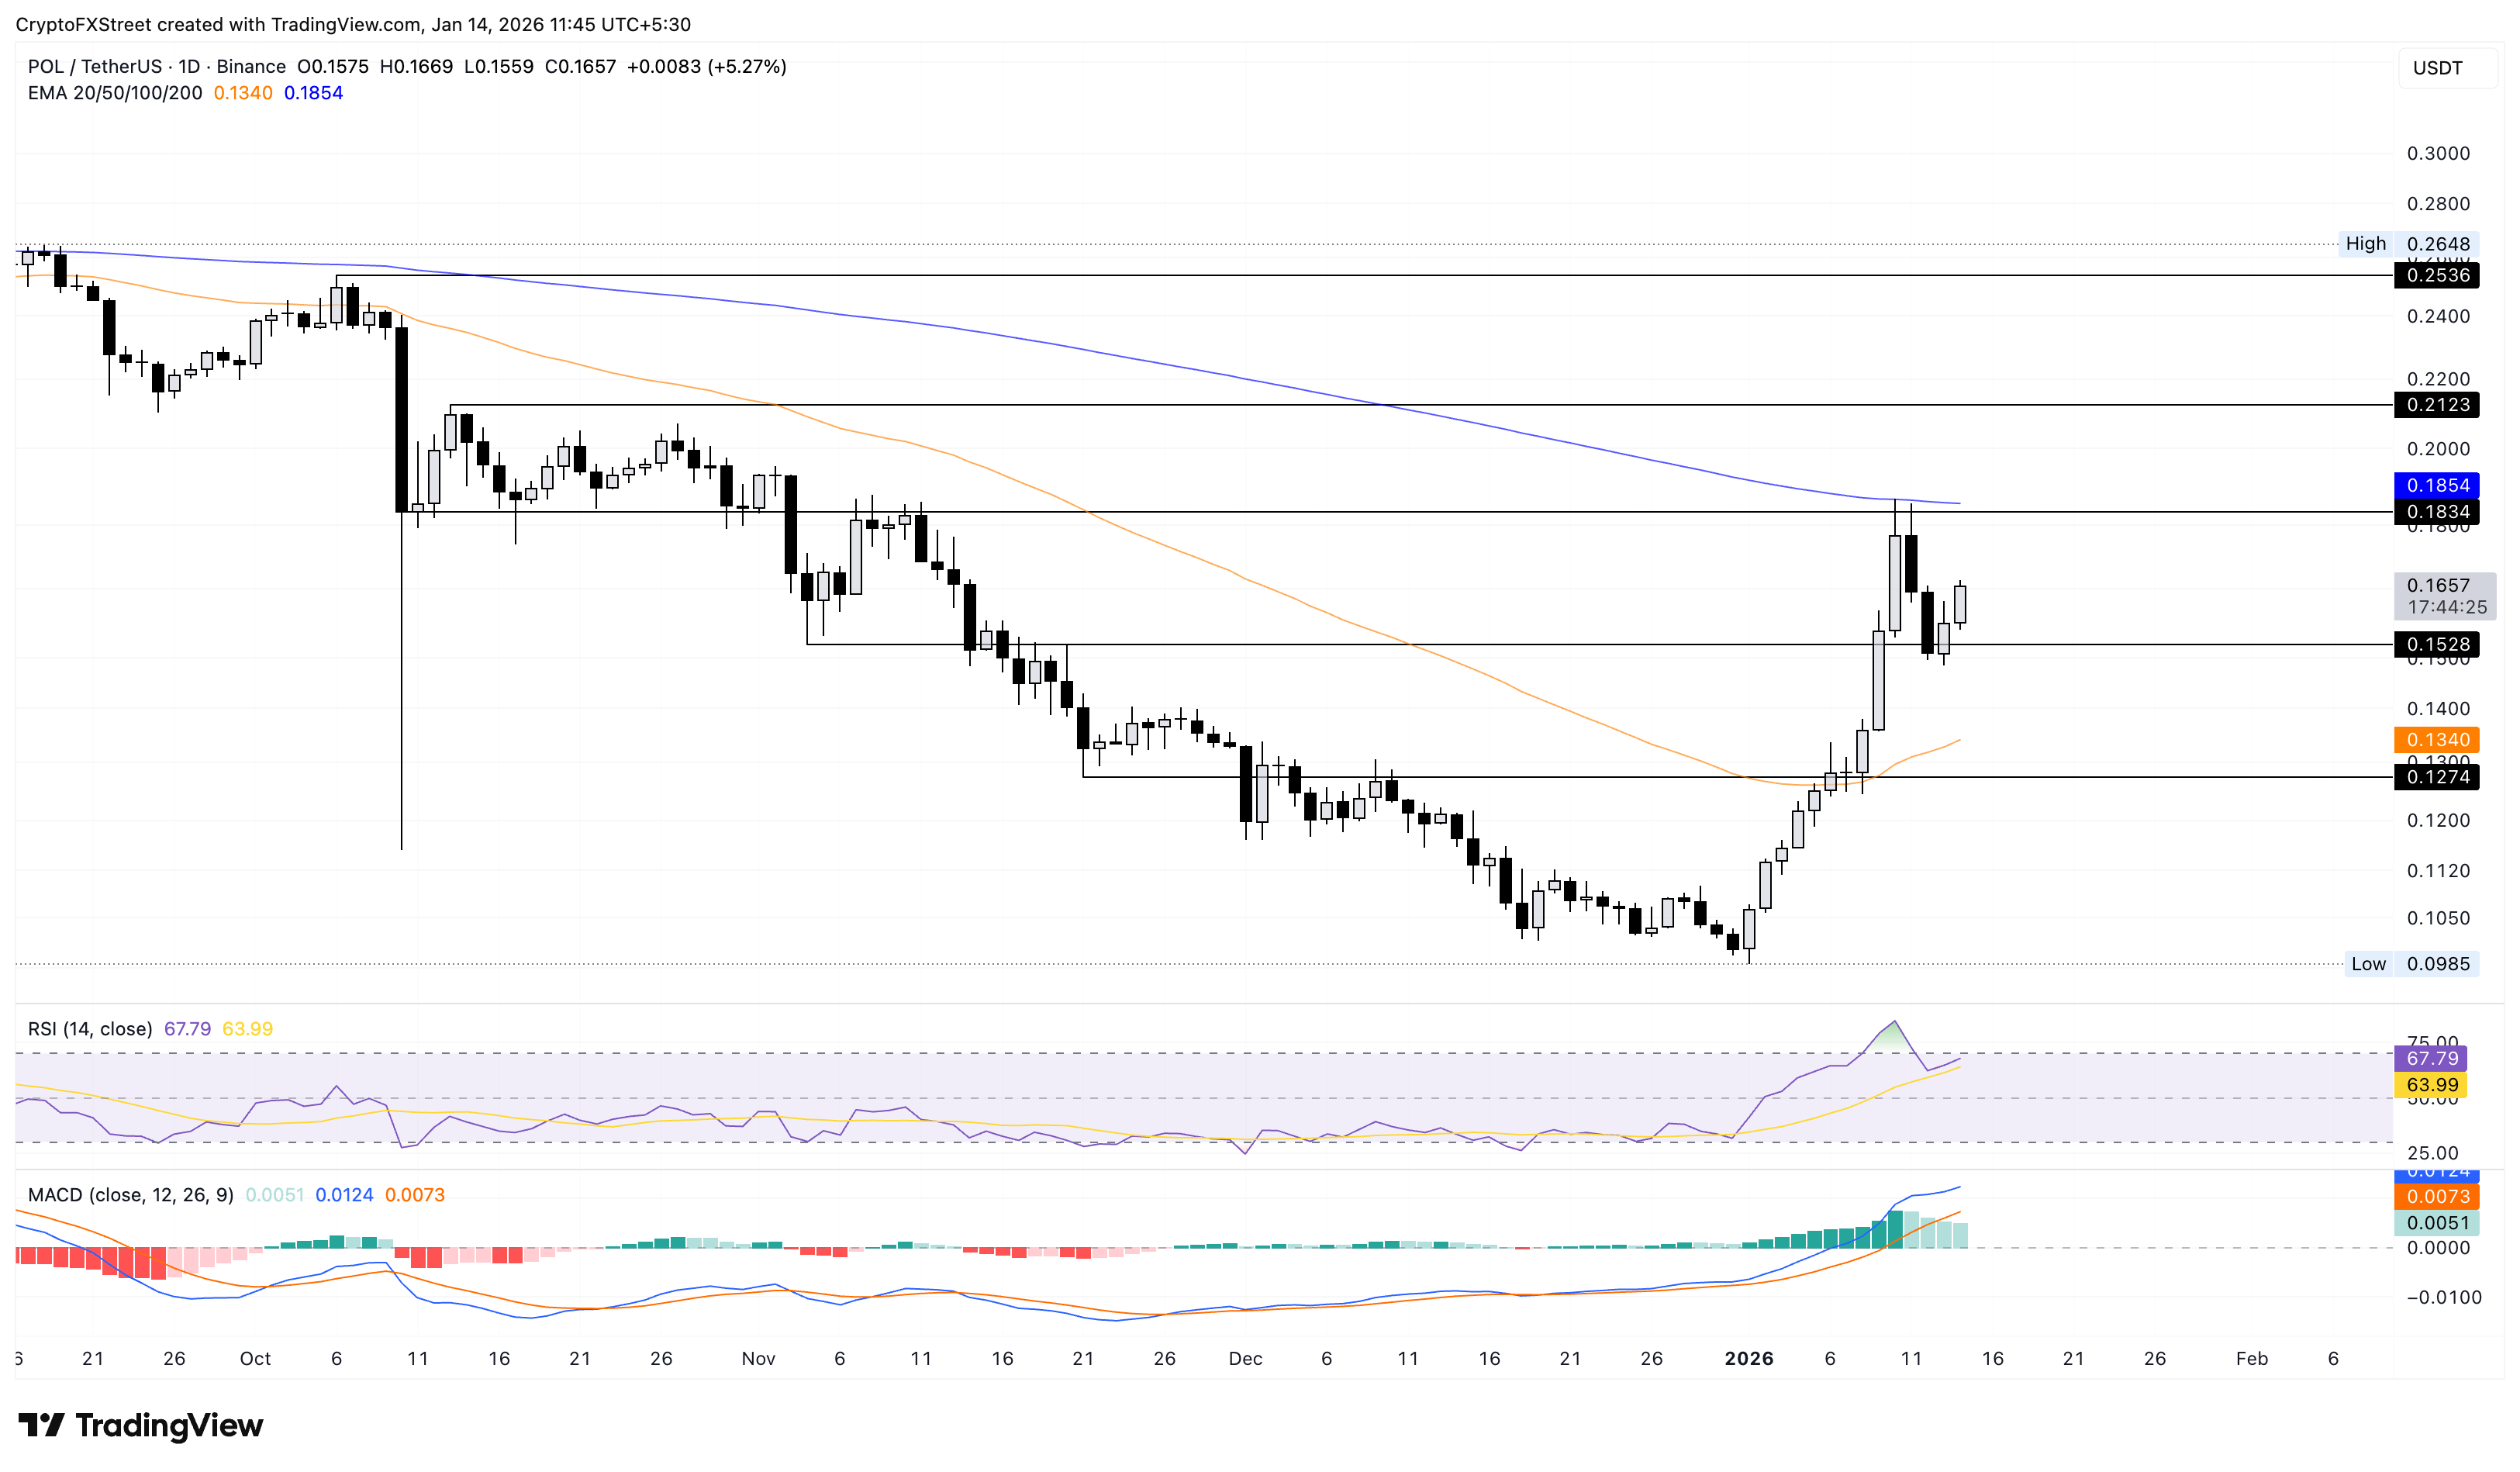
Looking down, a reversal in POL below $0.1500 could test the 50-day EMA at $0.1340.
Bài viết đề xuất


