

Ripple Price Forecast: XRP faces persistent bear risks, shrugging off ETF inflows
- XRP trades amid increasing downside pressure, as steady ETF inflows fail to shift sentiment.
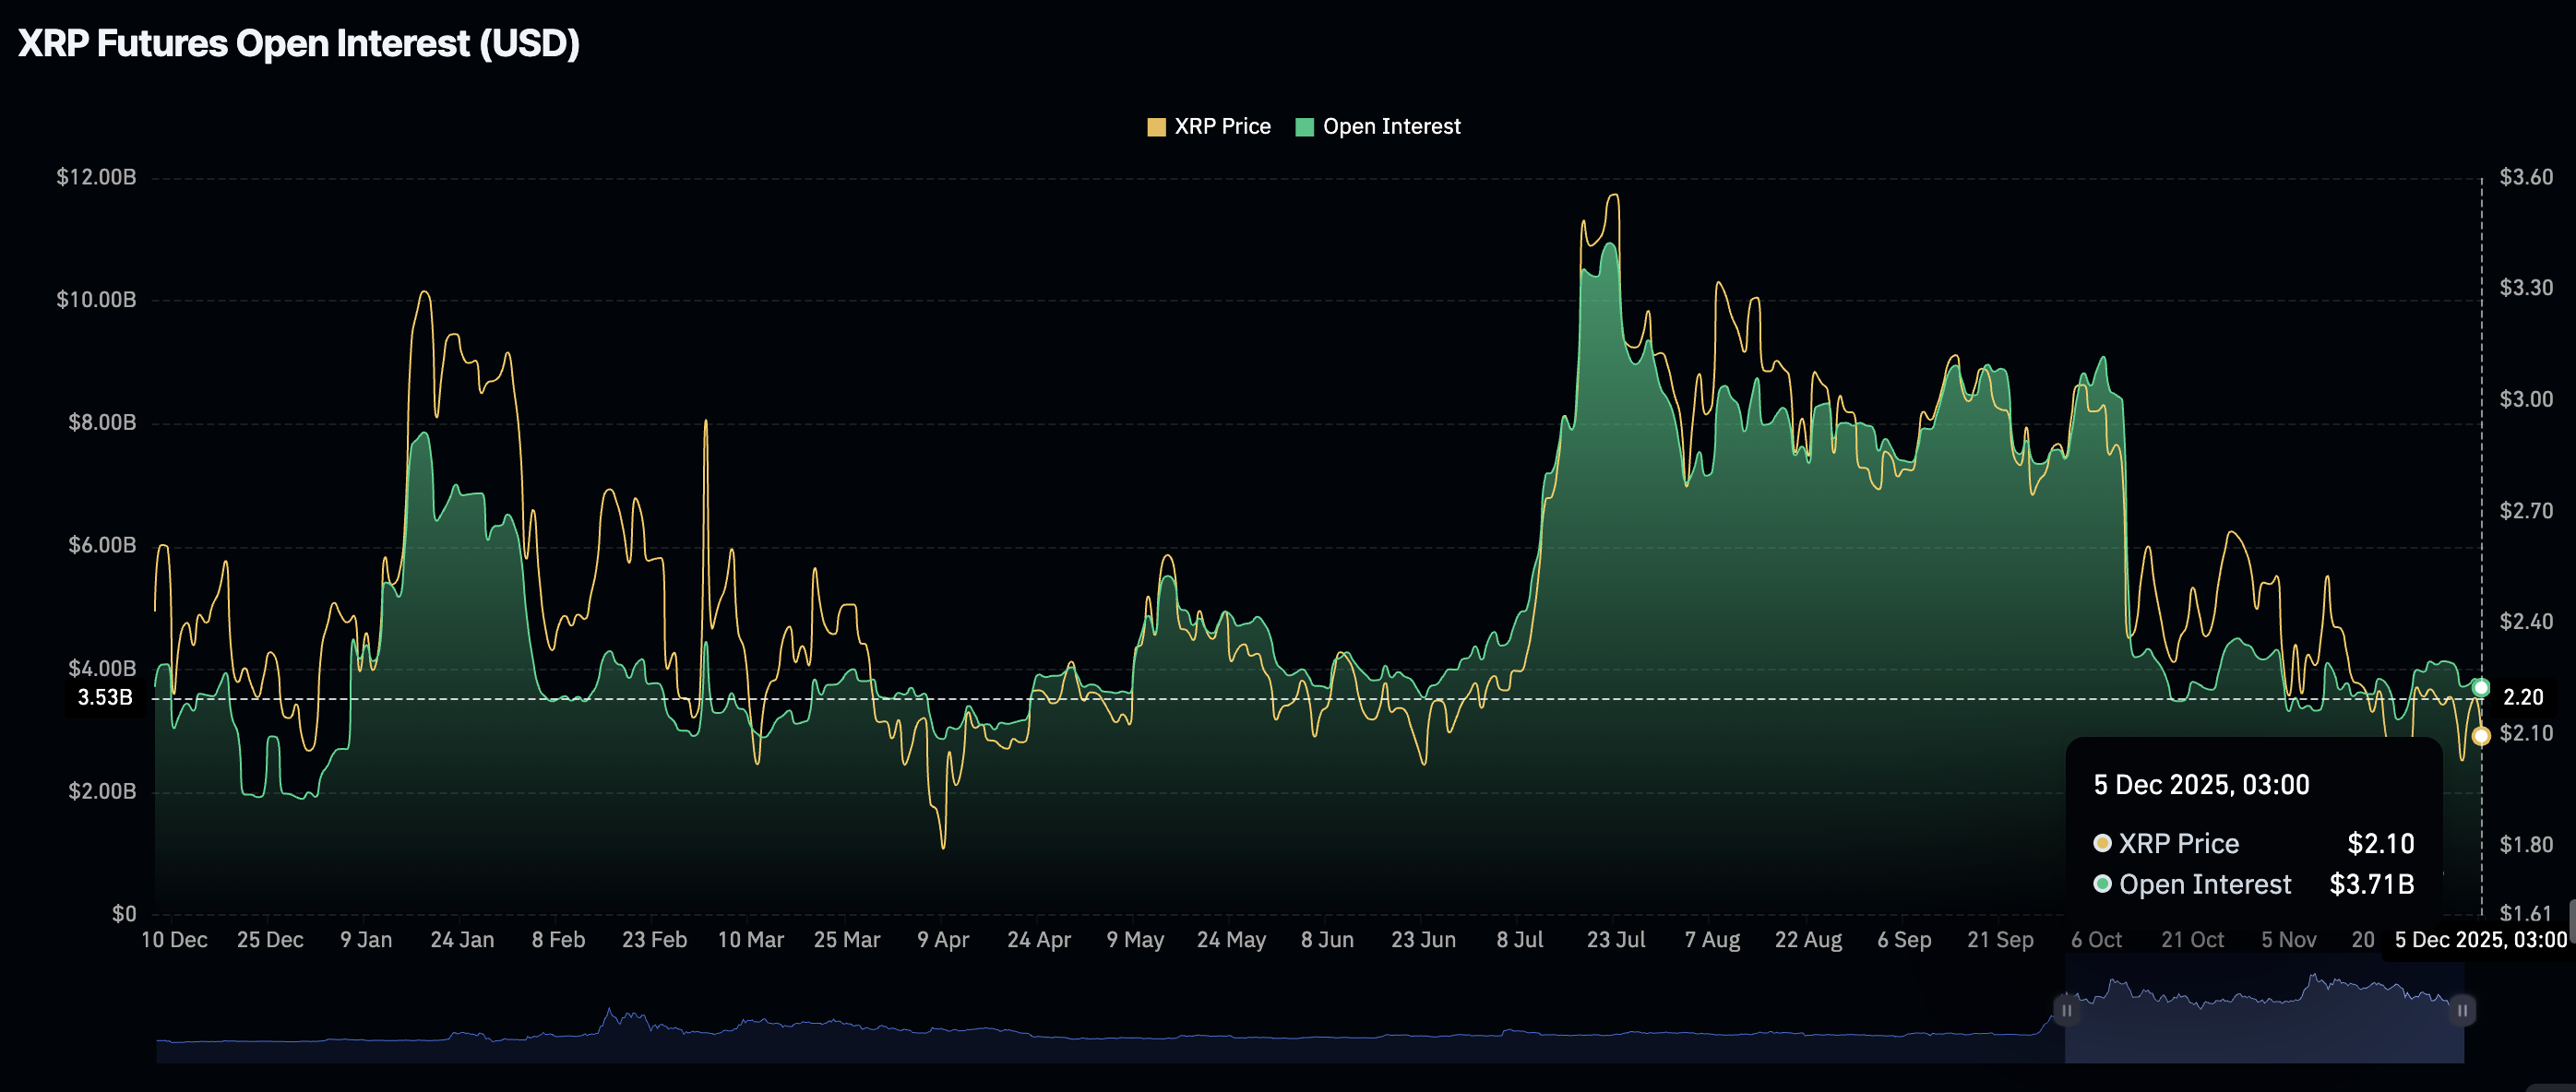
- Retail demand remains suppressed as Open Interest in the derivatives market stabilizes at around $3.71 billion.
- A weak technical structure weighs down on XRP, making a recovery unlikely in the short term.
Ripple (XRP) is extending its decline for the second consecutive day, trading at $2.06 at the time of writing on Friday. Sentiment surrounding the cross-border remittance token continues to lag despite steady inflows into XRP spot Exchange Traded Funds (ETFs).
A reversal below the prevailing market level will likely extend the pullback to Monday’s low of $1.98. Hence, the next few days would help gauge sentiment ahead of the Federal Reserve’s (Fed) monetary policy meeting on December 10.
XRP ETFs steady, but sentiment remains weak
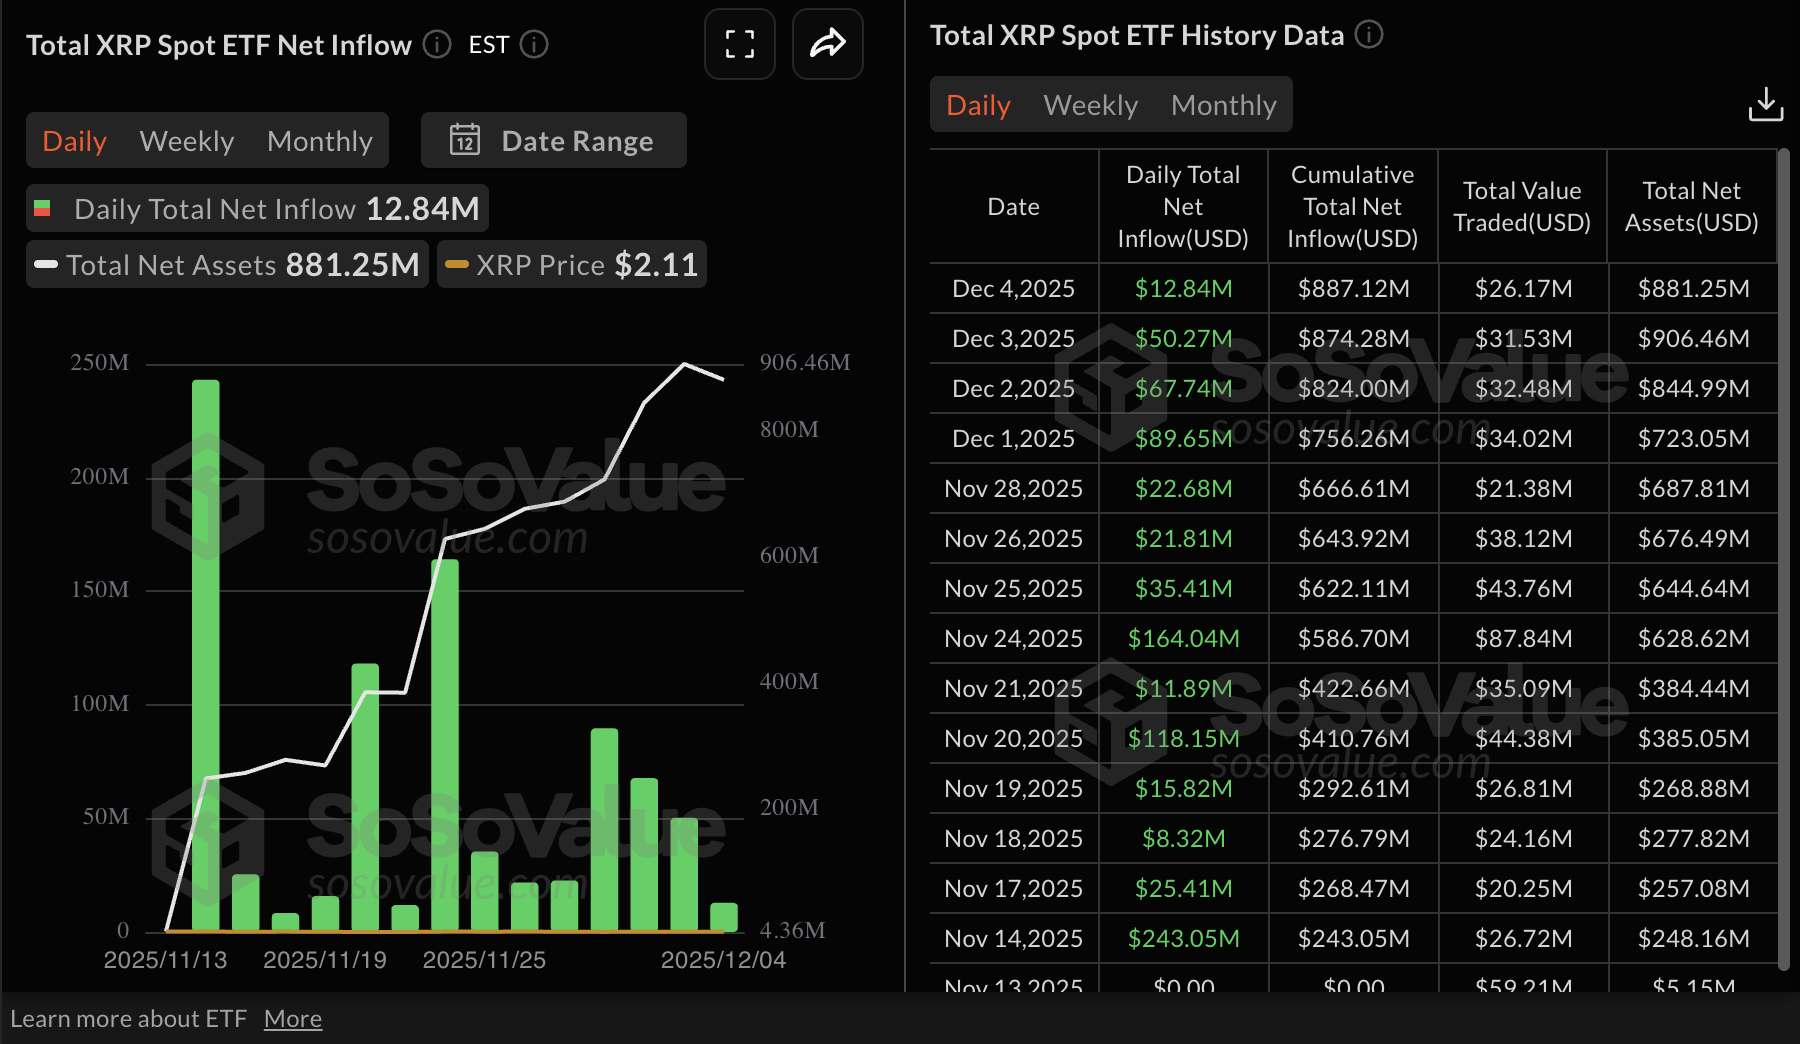
Interest in XRP spot ETFs has steadied since their debut on November 13, signaling a potential shift to altcoin-based crypto investment products. A total of $13 million marked a 14-day streak of positive inflows on Thursday, according to SoSoValue data.
XRP ETFs have cumulative inflows of $887 million and net assets of $881 million. A break above $1 billion would mark the next milestone and possibly set the stage for larger inflows.
Steady ETF inflows support positive sentiment, encouraging investors to increase exposure and anticipate a sustained uptrend.
Meanwhile, the demand for XRP derivatives remains shaky, with futures Open Interest (OI) dropping to $3.71 billion on Friday, from $3.85 billion the previous day.
OI has been on a general downtrend since mid-July, when the price of XRP reached a new all-time high of $3.66. The October 10 deleveraging event left many traders in losses, further weakening sentiment.
A significant decline in OI indicates that investors have lost confidence in the token’s ability to sustain an uptrend, which may continue to cap rebounds.
Technical outlook: XRP sellers tighten their grip
XRP is trading at $2.06 at the time of writing on Friday, but the token is also pressed below the 50-day Exponential Moving Average (EMA) at $2.30. The 100-day EMA at $2.46 and the 200-day EMA at $2.49 slope lower and cap rebounds.
The Moving Average Convergence Divergence (MACD) line about to slide below the signal line on the daily chart, as green histogram bars contract, suggesting fading momentum. At the same time, the Relative Strength Index (RSI) stands at 42 on the same chart, below the neutral midline, indicating lingering bearish pressure.
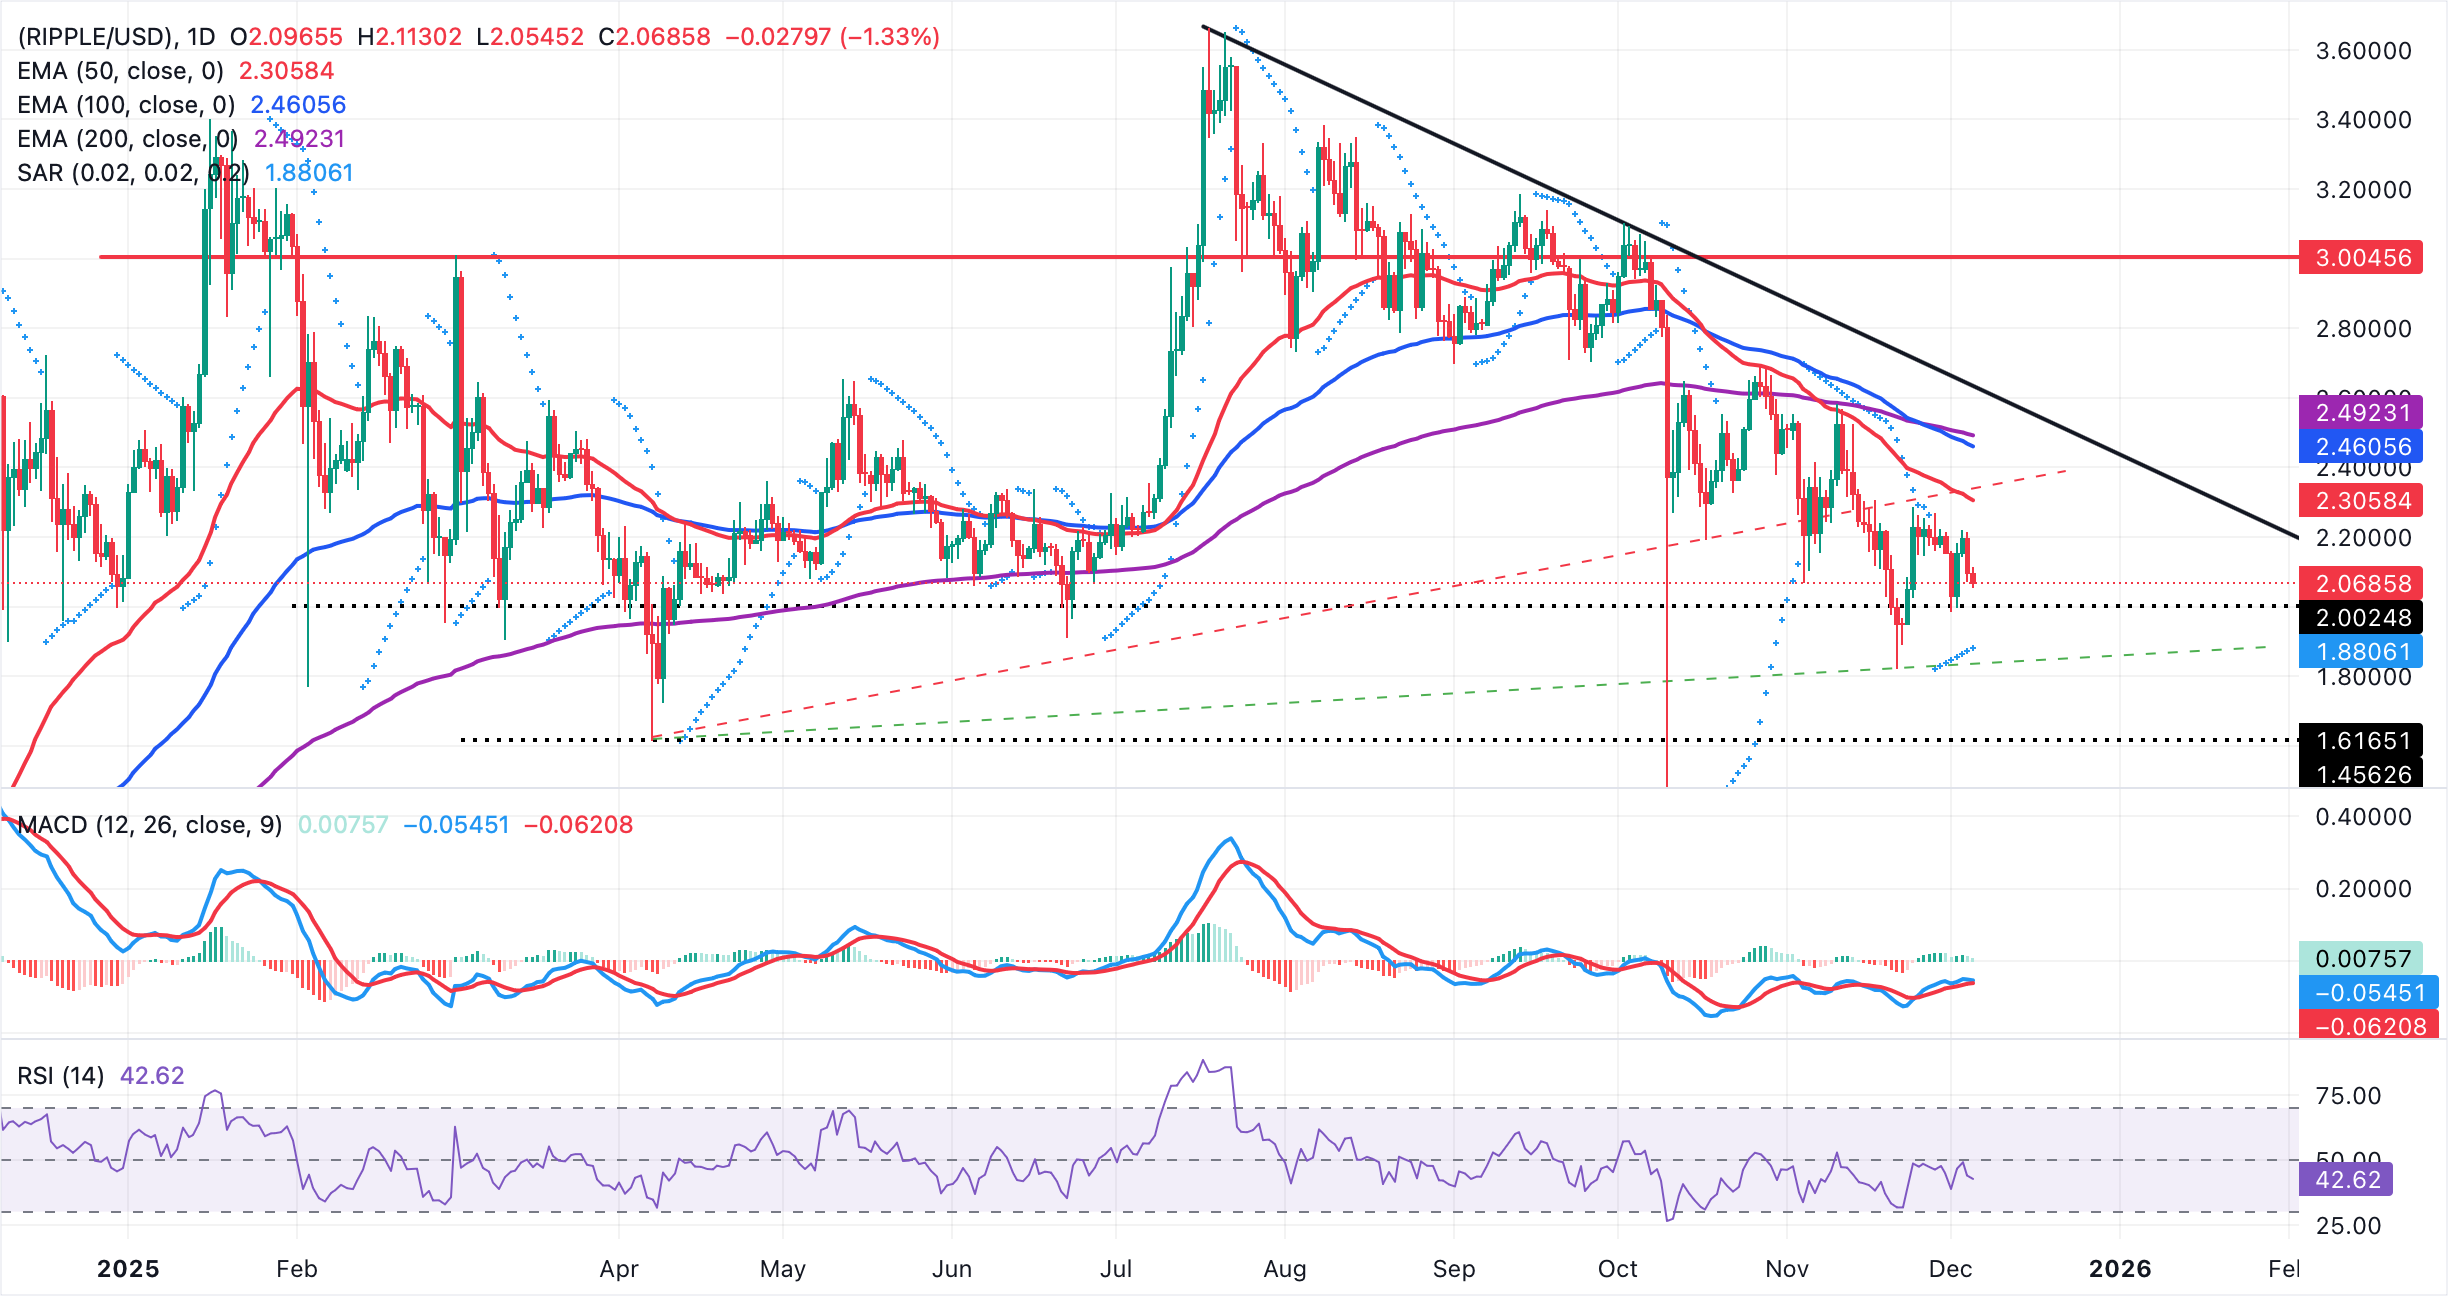
Parabolic SAR indicator sits beneath price, with the latest dot at $1.88, offering nearby trailing support. The descending trend line from $3.66 caps XRP's upside, with resistance seen at $2.63, while the rising trend line from $1.62 offers support near $1.83. A daily close above the 50-day EMA at $2.30 would ease pressure and open room toward the 100-day EMA at $2.46. Still, a drop through the trend-line (green) base would reassert the downtrend and risk fresh lows.
Crypto ETF FAQs
An Exchange-Traded Fund (ETF) is an investment vehicle or an index that tracks the price of an underlying asset. ETFs can not only track a single asset, but a group of assets and sectors. For example, a Bitcoin ETF tracks Bitcoin’s price. ETF is a tool used by investors to gain exposure to a certain asset.
Yes. The first Bitcoin futures ETF in the US was approved by the US Securities & Exchange Commission in October 2021. A total of seven Bitcoin futures ETFs have been approved, with more than 20 still waiting for the regulator’s permission. The SEC says that the cryptocurrency industry is new and subject to manipulation, which is why it has been delaying crypto-related futures ETFs for the last few years.
Yes. The SEC approved in January 2024 the listing and trading of several Bitcoin spot Exchange-Traded Funds, opening the door to institutional capital and mainstream investors to trade the main crypto currency. The decision was hailed by the industry as a game changer.
The main advantage of crypto ETFs is the possibility of gaining exposure to a cryptocurrency without ownership, reducing the risk and cost of holding the asset. Other pros are a lower learning curve and higher security for investors since ETFs take charge of securing the underlying asset holdings. As for the main drawbacks, the main one is that as an investor you can’t have direct ownership of the asset, or, as they say in crypto, “not your keys, not your coins.” Other disadvantages are higher costs associated with holding crypto since ETFs charge fees for active management. Finally, even though investing in ETFs reduces the risk of holding an asset, price swings in the underlying cryptocurrency are likely to be reflected in the investment vehicle too.
(The technical analysis of this story was written with the help of an AI tool)
Bài viết đề xuất


