
Top gainers Virtuals Protocol, Floki, Hyperliquid: Altcoins extend gains alongside Bitcoin
- As open interest and volume surge, Bitcoin shows immense potential to trigger a move to $100,000.
- Virtuals Protocol's price gains bullish momentum, tackling $1.50 resistance despite overbought conditions.
- Floki aims to shift the narrative from bearish to strongly bullish, following a breakout from a triangle pattern, targeting $0.0001075.
- Hyperliquid price consolidates gains above the 100-day EMA, ahead of a potential breakout beyond $20.00.
The cryptocurrency market sustains a market-wide bullish outlook at the time of writing on Tuesday, led by Bitcoin (BTC) and select altcoins, including Virtuals Protocol (VIRTUAL), Floki, and Hyperliquid (HYPE). Global markets continue to respond positively to the possibility of trade tensions de-escalation between the United States (US) and China.
Bitcoin price extends lead over altcoins
Interest in digital assets surged significantly following statements from President Donald Trump's administration that tariffs on Chinese goods could be reduced. Bitcoin price held above $90,000 last week before extending gains to $95,631, buoyed by record spot BTC ETF net inflows of $3.06 billion in the week ending April 25.
The increase in the Bitcoin price has led to many short traders being liquidated. Over the past 24 hours, approximately $33 million in short positions were forcibly closed compared to about $20.5 million in long positions. Moreover, a 2.18% increase in the derivatives' Open Interest (OI) to $63.3 billion points to growing trader interest, potentially amplifying the rally toward $100,000.
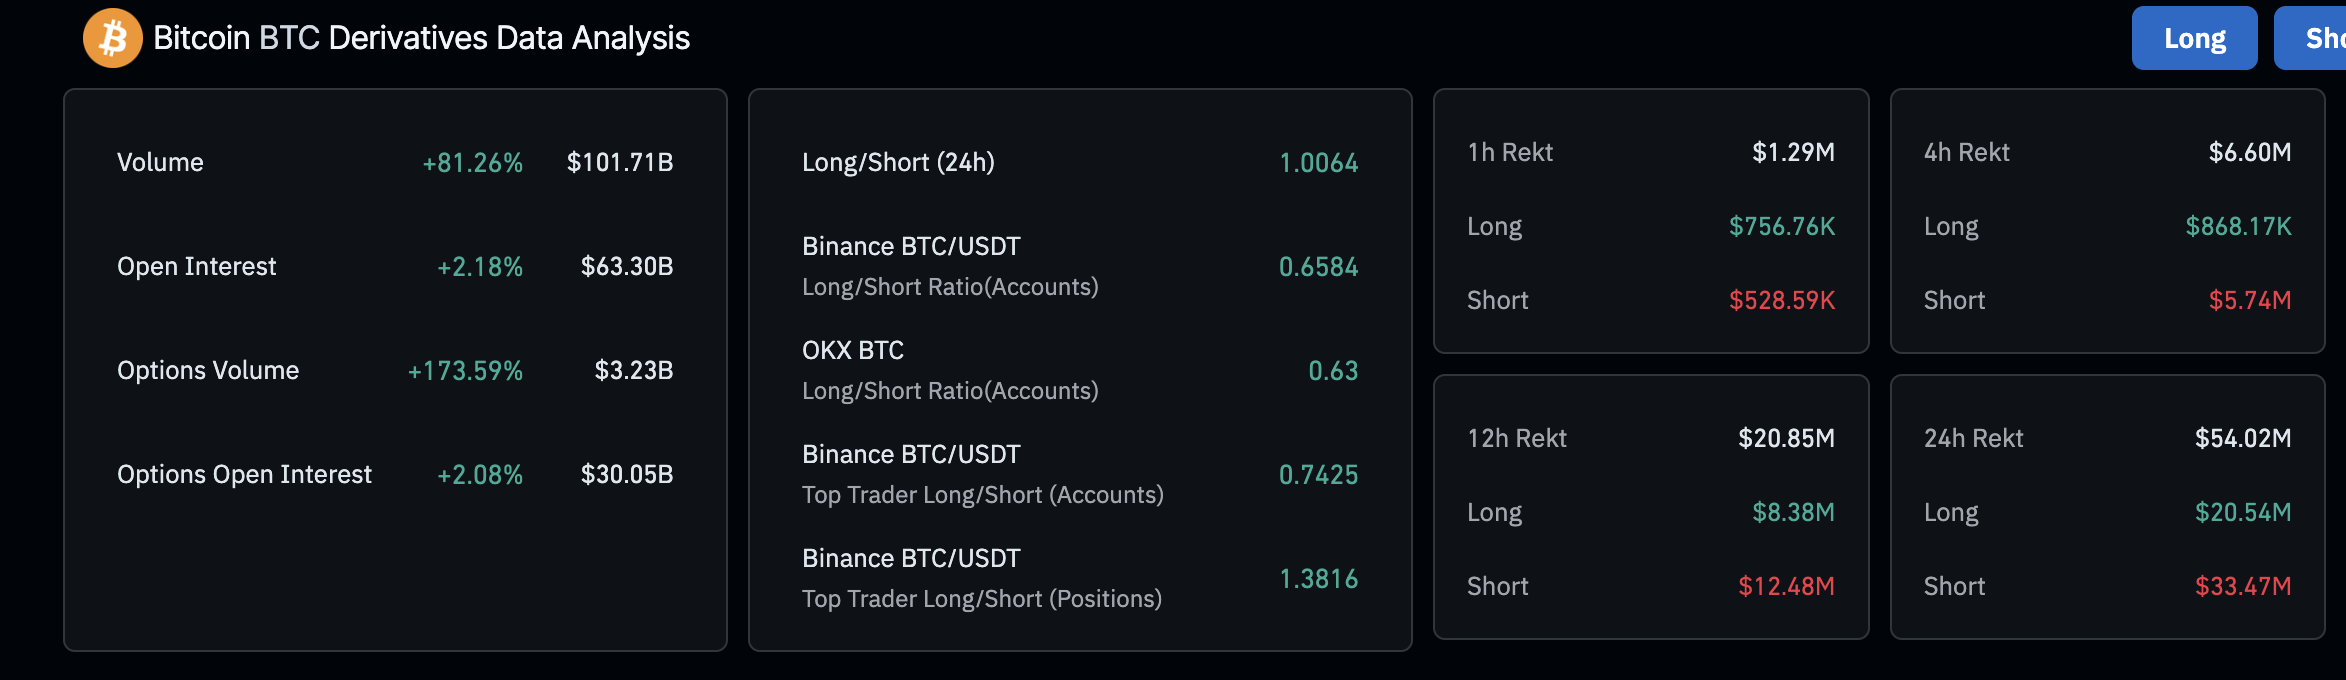
Bitcoin derivatives' open interest | Source: Coinglass
Virtuals Protocol tops trending coins as price soars
Virtuals Protocol's price maintains the lead among altcoins, gaining over 38% in the last 24 hours, 157% in the last seven days, and 142% in the last month, trading at $1.4228 at the time of writing.
The token holds above the 50, 100, and 200-day Exponential Moving Averages (EMAs), signaling a stronger tailwind. Interest in the token remains steady despite overbought conditions, with the Relative Strength Index (RSI) indicator's position at 84.14.
Breaching the key resistance at $1.5000 is essential to sustain the upward momentum toward $2.0000 (a support level from January) and $2.5000 (a resistance/support zone last seen in December and January).
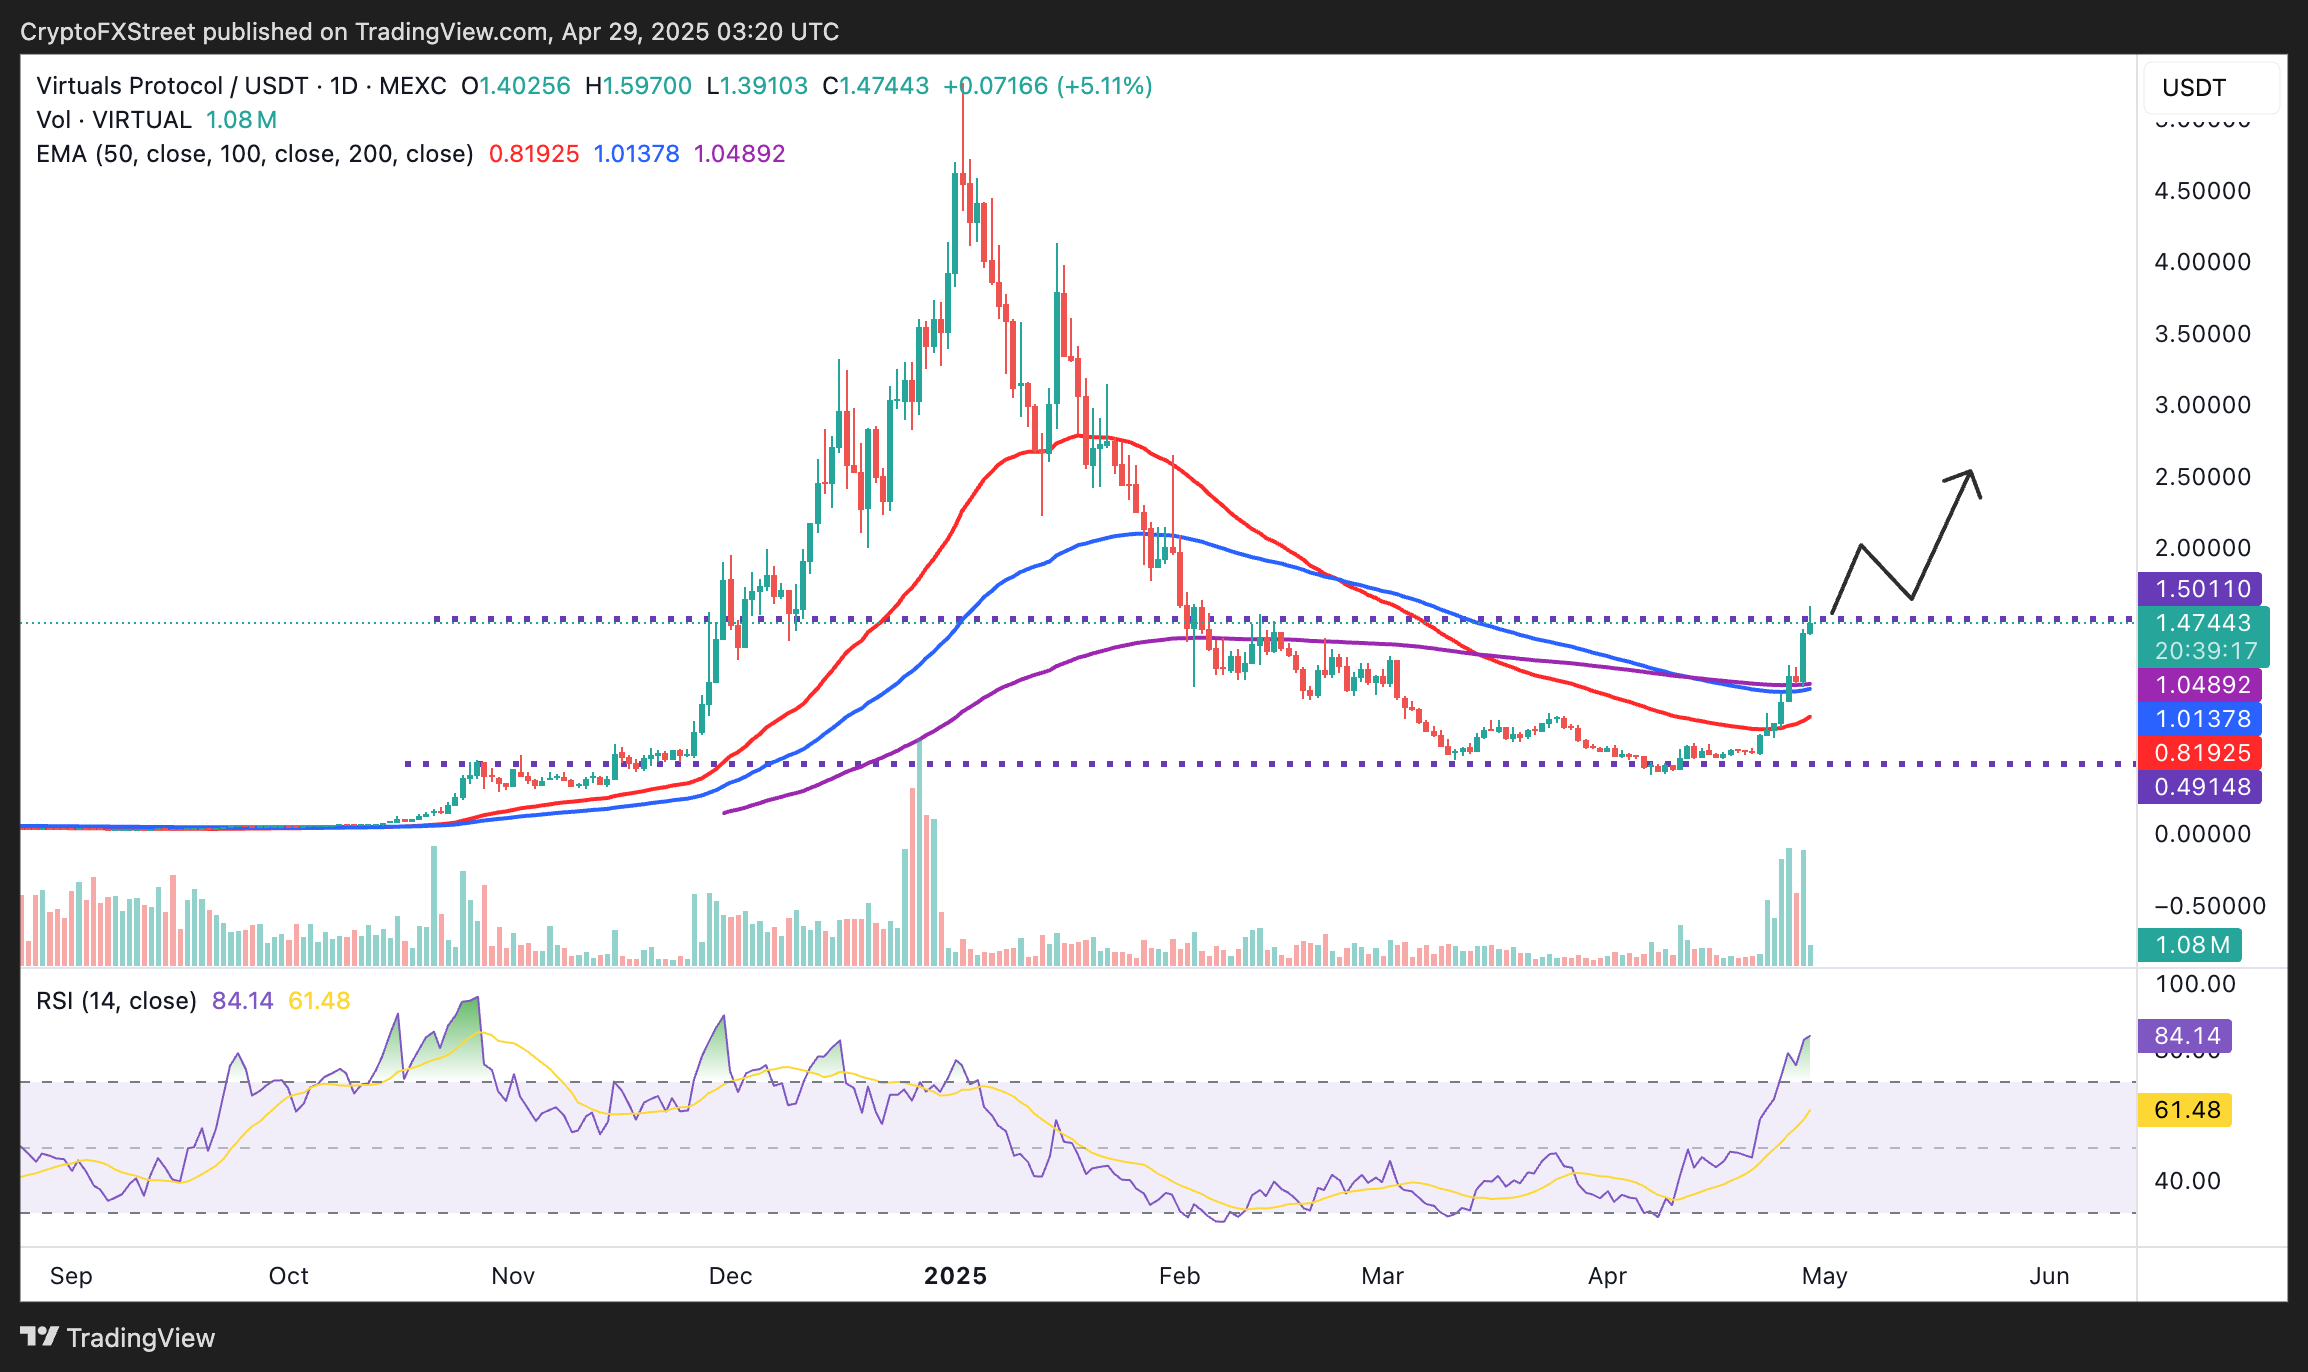
VIRTUAL/USDT daily chart
Floki poised for breakout above $0.0001
Floki's price is currently in the green, and it is aiming to build on its 24-hour gains, which have surpassed 11.5%. The bullish momentum behind the meme coin can be attributed to the stability in the broader crypto market and a recent technical breakout from a falling wedge pattern.
The 100-day EMA at $0.000086 immediately supports the token, which is currently hovering at $0.000087. A daily close above this level could encourage traders to seek more exposure while anticipating FLOKI to push above $0.0001 before completing the falling wedge pattern's 98% breakout, aiming for $0.0001075.
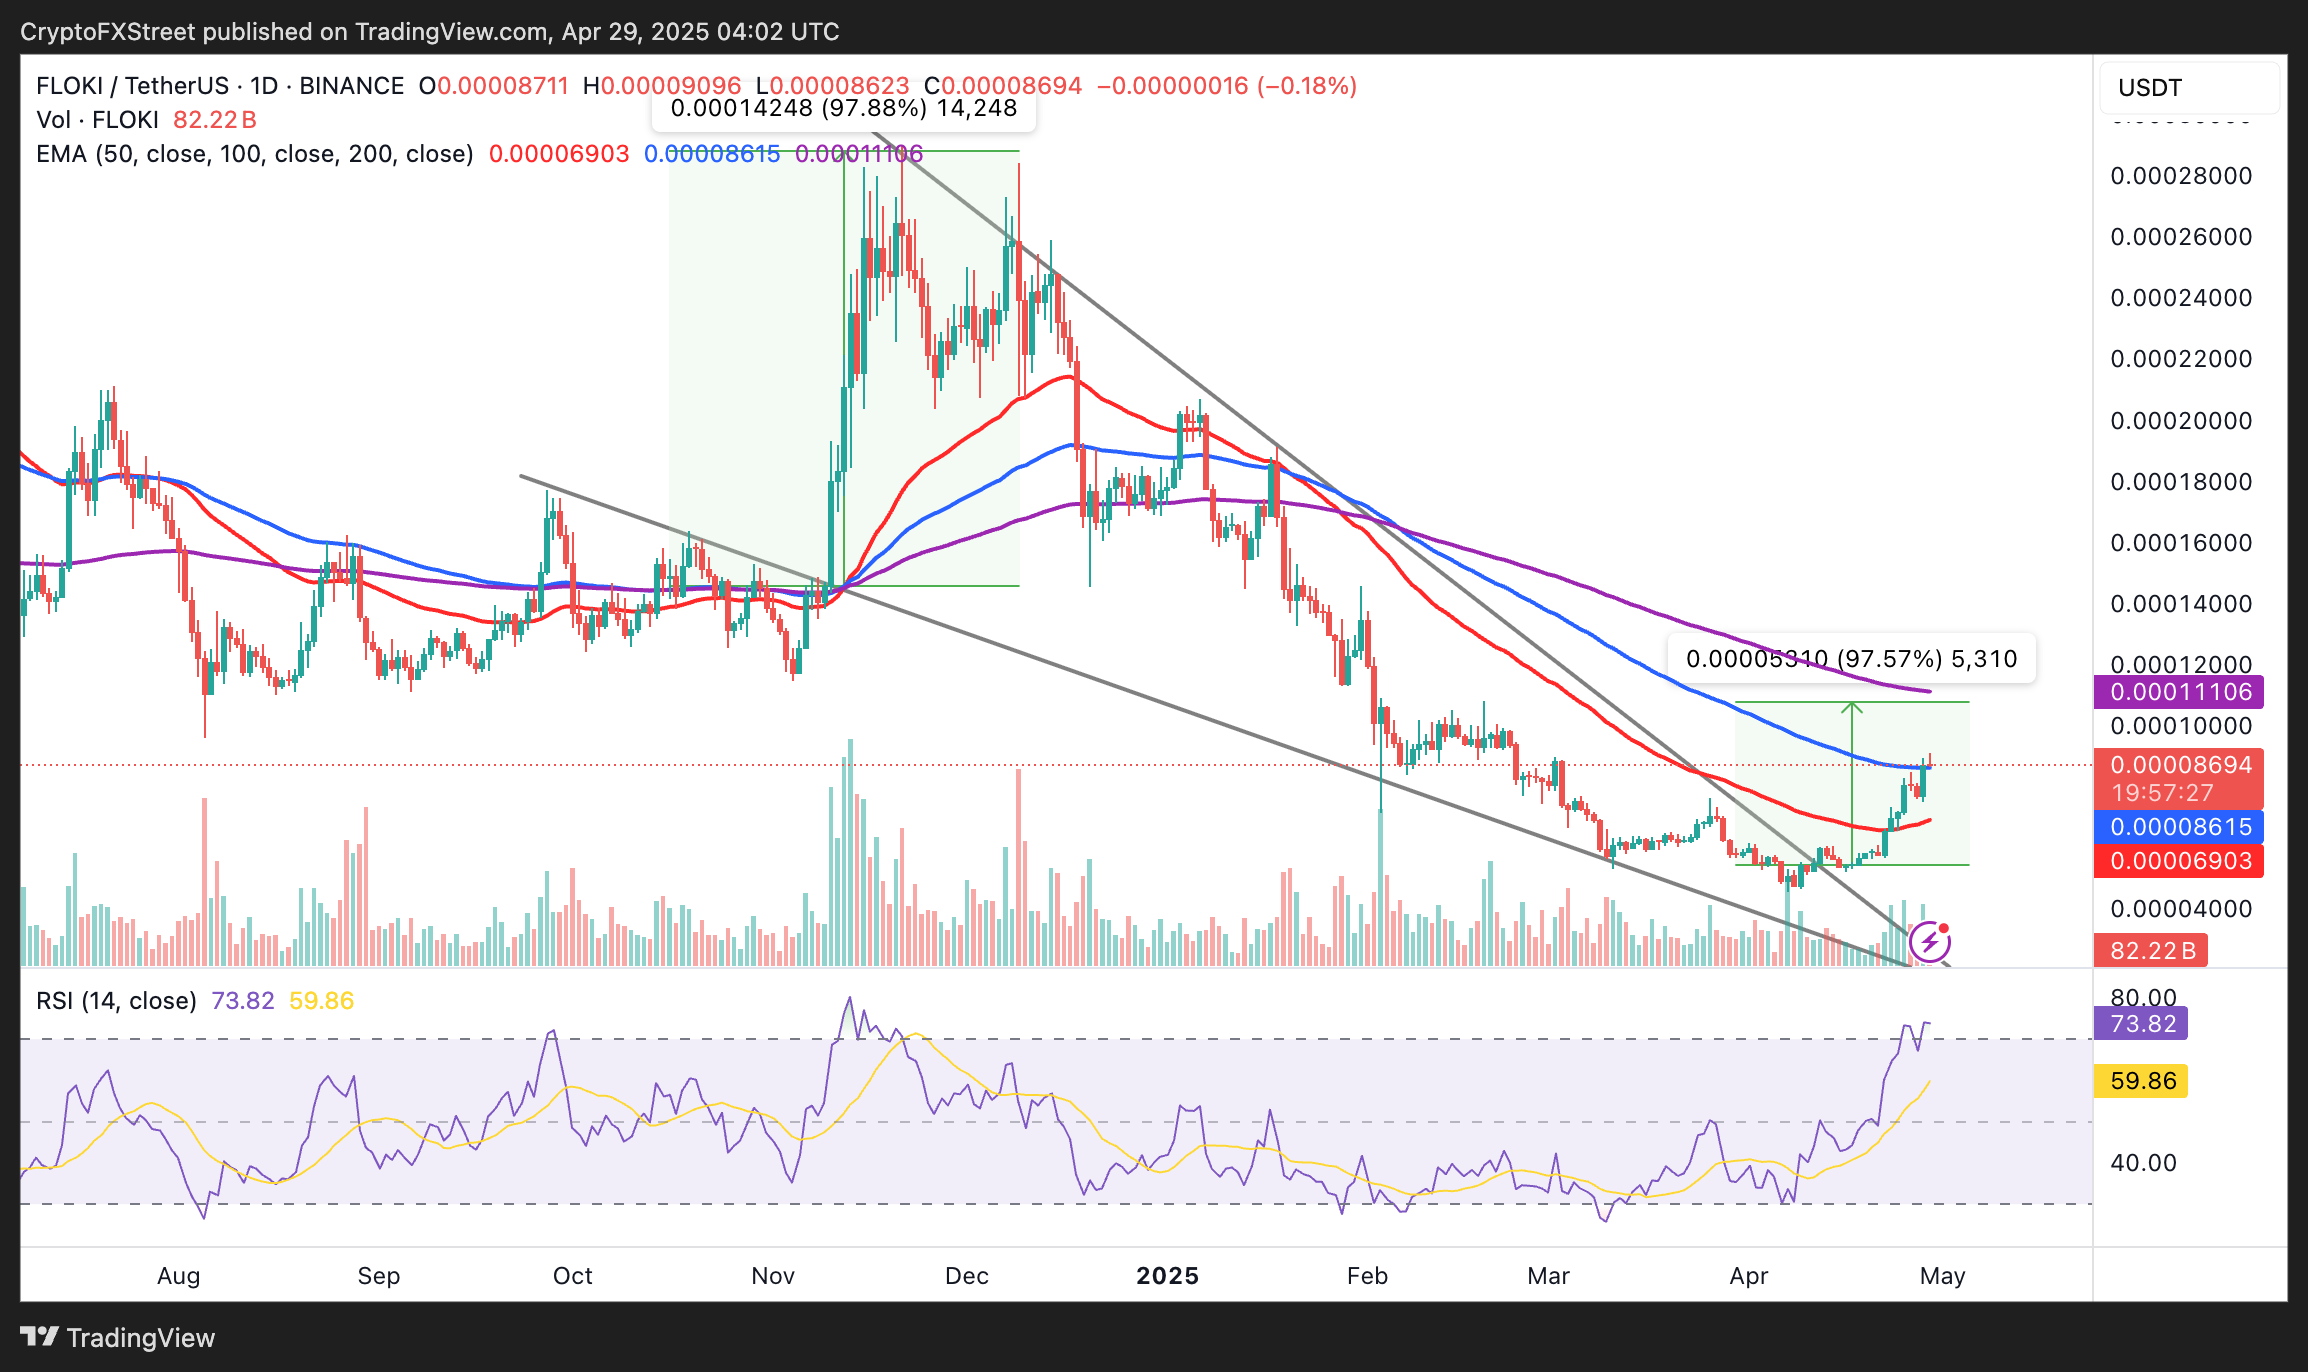
FLOKI/USDT daily chart
The 200-day EMA position at $0.0001110 could challenge the bullish momentum. Moreover, the RSI indicator is overbought at 73.82, hinting at a potential trend reversal in the short term. In case of a pullback, the 50-day EMA at $0.000069 is expected to provide support.
Hyperliquid price consolidates gains
Hyperliquid's price is trading at $18.57, down 0.54% on the day. The token has recently surpassed a descending trendline resistance since early 2025, indicating the possibility of a lasting trend reversal.
Following a rejection slightly below $20.00, HYPE remains above the 100-day EMA at $18.35. Additionally, the token holds above a critical support zone (red-shaded area on the daily chart) and is backed by the 50-day EMA at $16.62.
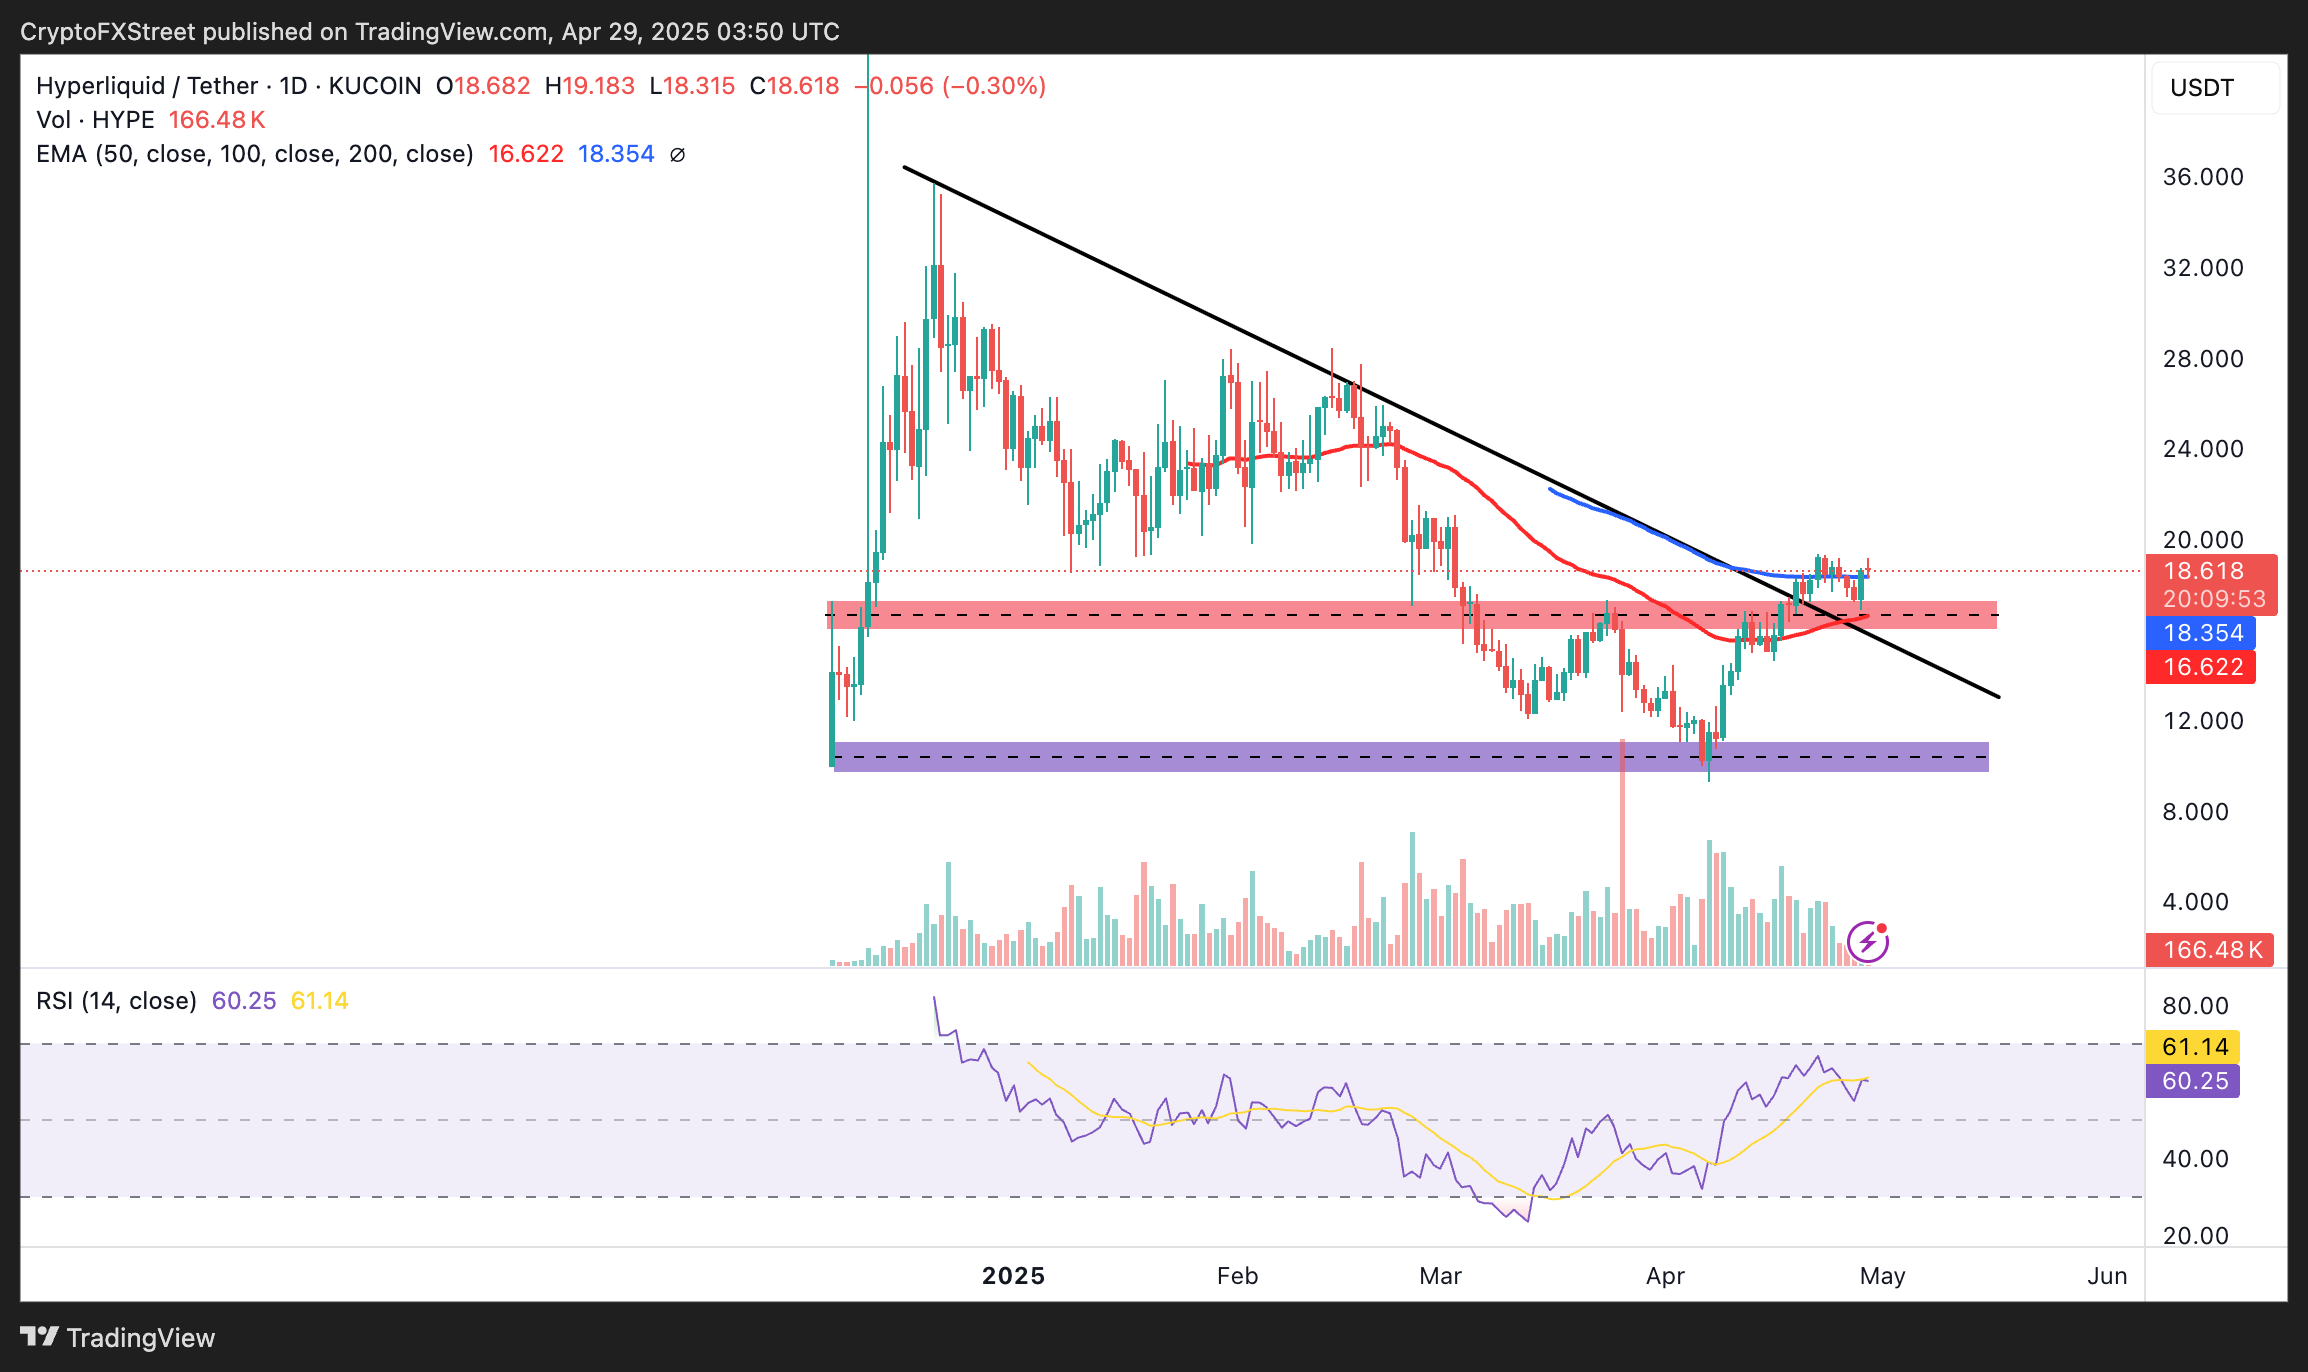
HYPE/USDT daily chart
Based on the RSI indicator's neutral position at 60.25, Hyperliquid is yet to be overbought, implying there's still room for another leg up. Breaching the $20.00 resistance could affirm the bullish grip, prompting traders to hold their positions for gains to $24.00, a level last tested in February.
Cryptocurrency prices FAQs
Token launches influence demand and adoption among market participants. Listings on crypto exchanges deepen the liquidity for an asset and add new participants to an asset’s network. This is typically bullish for a digital asset.
A hack is an event in which an attacker captures a large volume of the asset from a DeFi bridge or hot wallet of an exchange or any other crypto platform via exploits, bugs or other methods. The exploiter then transfers these tokens out of the exchange platforms to ultimately sell or swap the assets for other cryptocurrencies or stablecoins. Such events often involve an en masse panic triggering a sell-off in the affected assets.
Macroeconomic events like the US Federal Reserve’s decision on interest rates influence crypto assets mainly through the direct impact they have on the US Dollar. An increase in interest rate typically negatively influences Bitcoin and altcoin prices, and vice versa. If the US Dollar index declines, risk assets and associated leverage for trading gets cheaper, in turn driving crypto prices higher.
Halvings are typically considered bullish events as they slash the block reward in half for miners, constricting the supply of the asset. At consistent demand if the supply reduces, the asset’s price climbs.
Bài viết đề xuất


