

Ripple Price Forecast: XRP potential bottom could be in sight
- XRP steadies above the intraday low at $1.35 as bulls attempt to reclaim the $1.40 level as support.
- The MVRV-Z Score metric has remained in the negative territory for almost two weeks, a scenario that in the past has preceded sustained recoveries.
- XRP balance on exchanges continues to increase, hindering the chances of a recovery.
Ripple (XRP) edges up above the intraday low of $1.35 at the time of writing on Friday amid mixed price actions across the crypto market. The remittance token failed to hold support at $1.40 the previous day, reflecting risk-off sentiment amid a decline in retail and institutional sentiment.
A decisive break above the pivotal $1.40 level could ease bearish momentum and open the door to an extended recovery. However, traders should not lose sight of the next support at $1.25, as XRP is not out of the woods yet.
XRP MVRV-Z Score signals a potential bottom
XRP has sustained an overall downtrend amid price fluctuations since its record high of $3.66, reached in July. The token hit a yearly low at $1.12 on February 6 amid extremely oversold conditions. While an immediate recovery propelled XRP to $1.54 on the same day, headwinds continue to cap the upside.
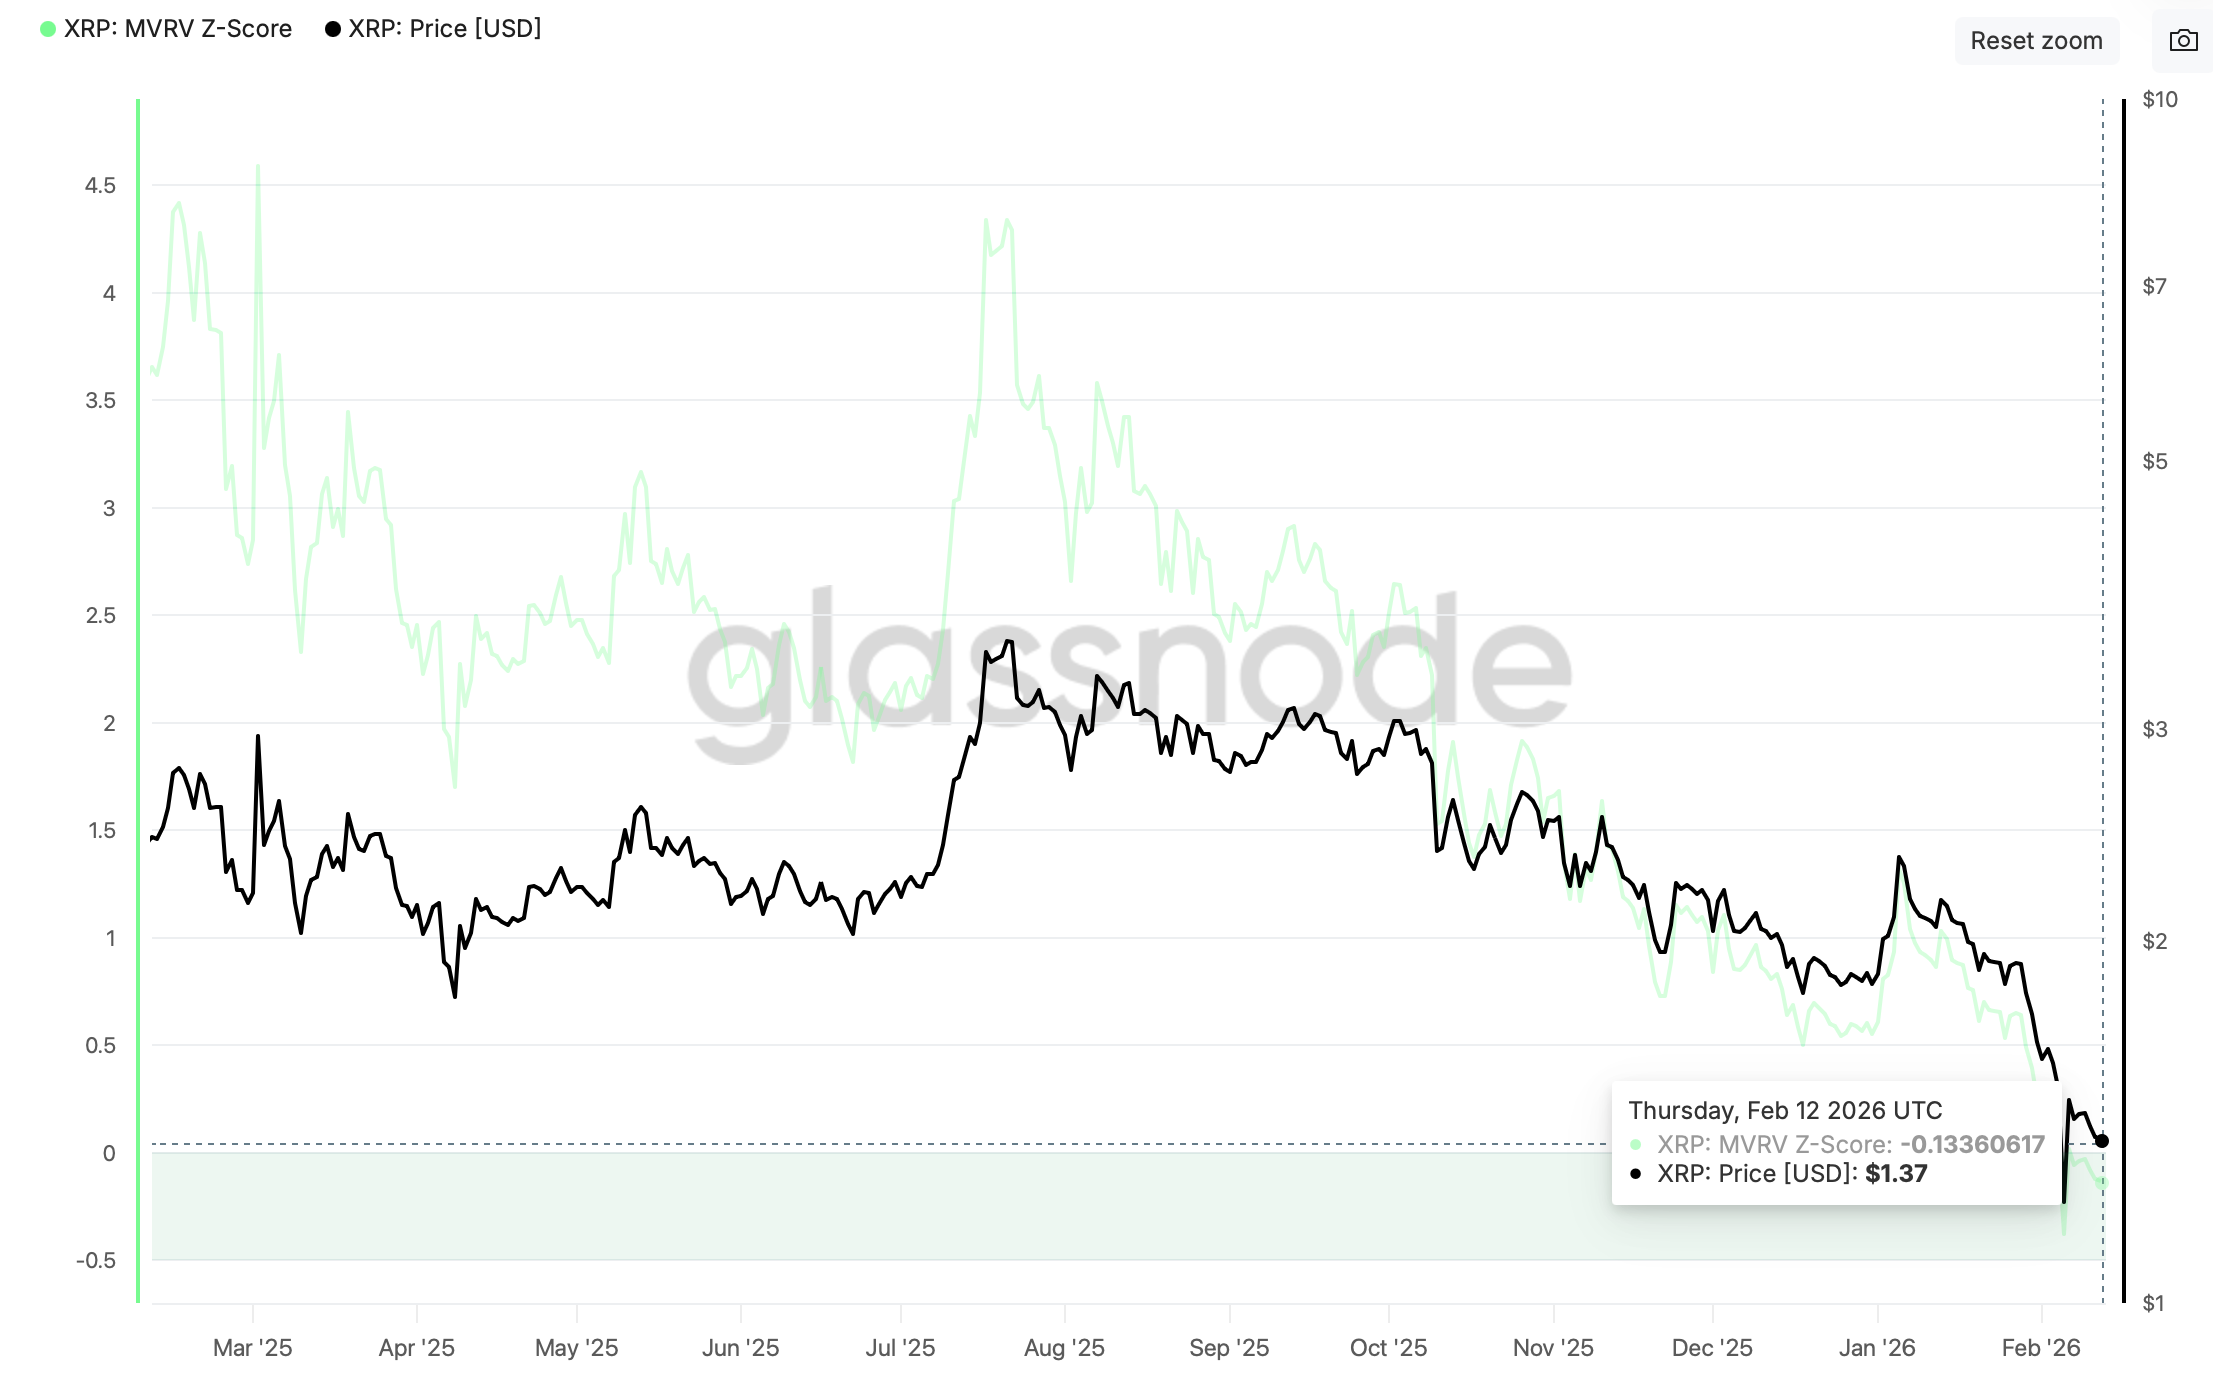
Meanwhile, the MVRV-Z Score, a metric that gauges whether XRP is over or undervalued relative to its fair value, dropped into negative territory in early February, suggesting the token may have bottomed.
Although the duration of the MVRV-Z Score in the negative region varies, historical data show that sustained recoveries often precede such scenarios. For example, in July 2024, when the MVRV-Z Score hit -0.13, XRP surged from $0.45 to $2.91 in December of the same year. Hence, there’s a high probability that the remittance token has bottomed and is poised for an extended recovery, as the MVRV-Z Score remains at -0.13.
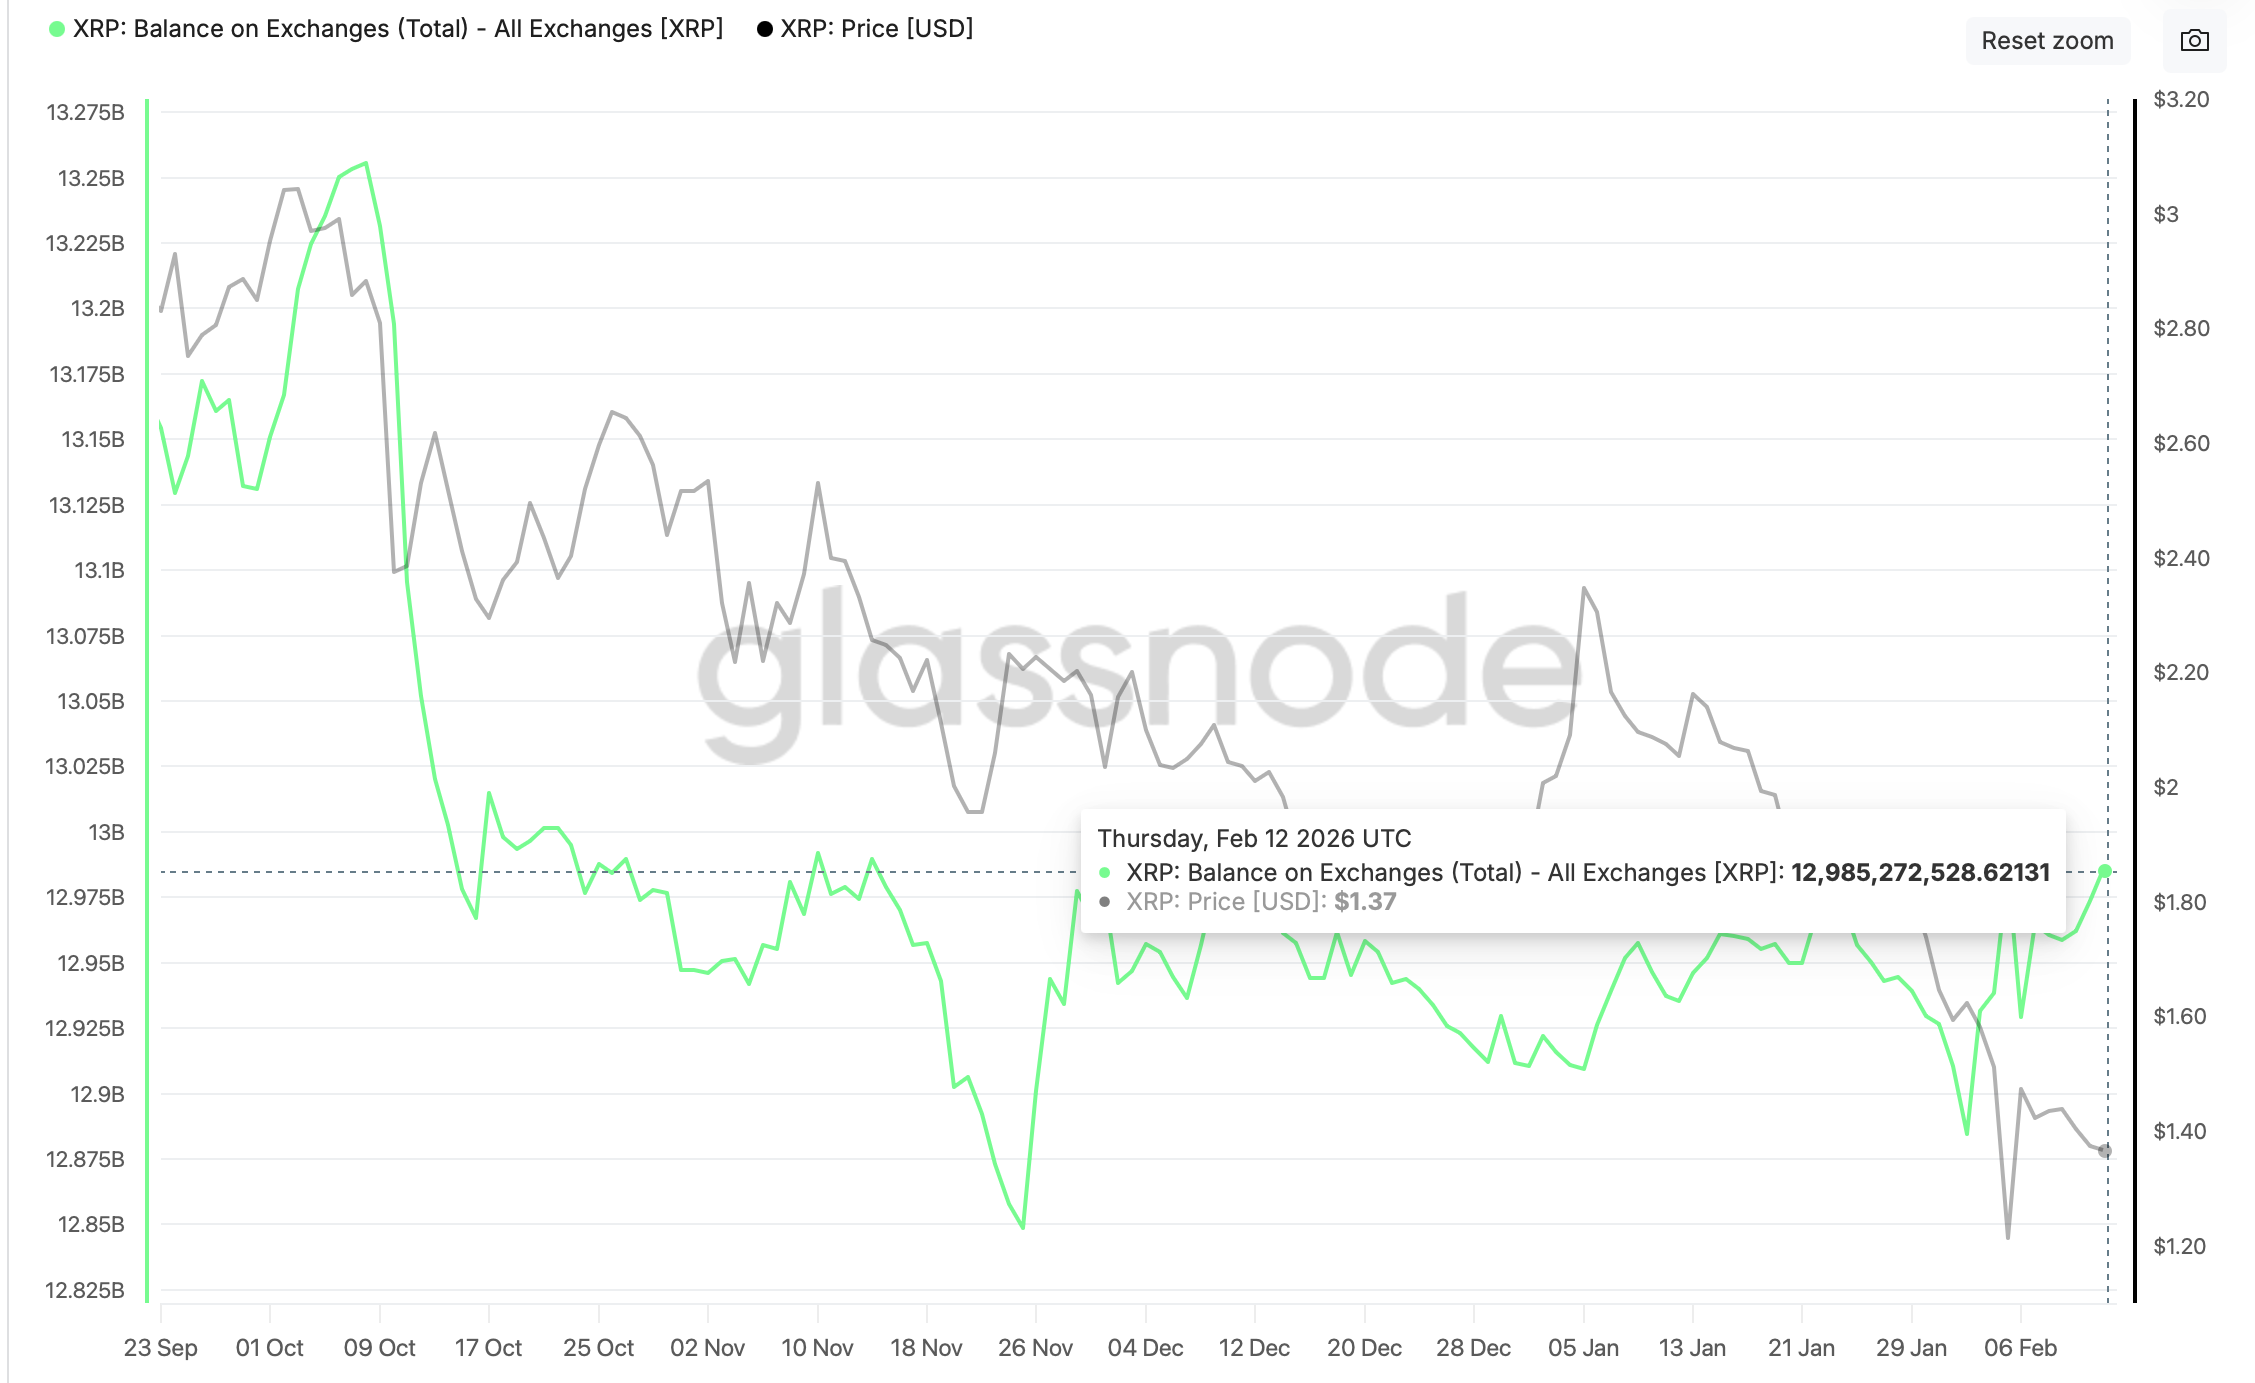
Despite the potential bullish outlook highlighted by the MVRV-Z Score, rising exchange reserves paint a conflicting picture that may hinder recovery. According to Glassnode data, the cumulative balance of the cross-border money transfer token increased to approximately 12.99 billion XRP on Thursday, following a brief dip to 12.93 billion XRP on February 8.
The upsurge, although relatively minor, warrants caution, as it increases the amount of XRP available for sale in the open market. Investors transfer their holdings to exchanges amid market volatility, intending to sell and reduce risk exposure.
Technical outlook: Can XRP steady its recovery?
XRP hovers at $1.36 and sits well below the falling 50-day Exponential Moving Average (EMA) at $1.76, the 100-day EMA at $1.97 and the 200-day EMA at $2.16. All three moving averages are sloping downward, reinforcing a bearish setup.
The Moving Average Convergence Divergence (MACD) remains below the signal line and under the zero mark. Meanwhile, the red histogram bars have been contracting, suggesting downside momentum is fading.
Still, the Relative Strength Index (RSI) at 32 (near oversold) signals subdued strength, while the descending trend line from $3.66 (all-time high) limits rebounds, with resistance seen near $2.13, keeping recovery attempts in check.
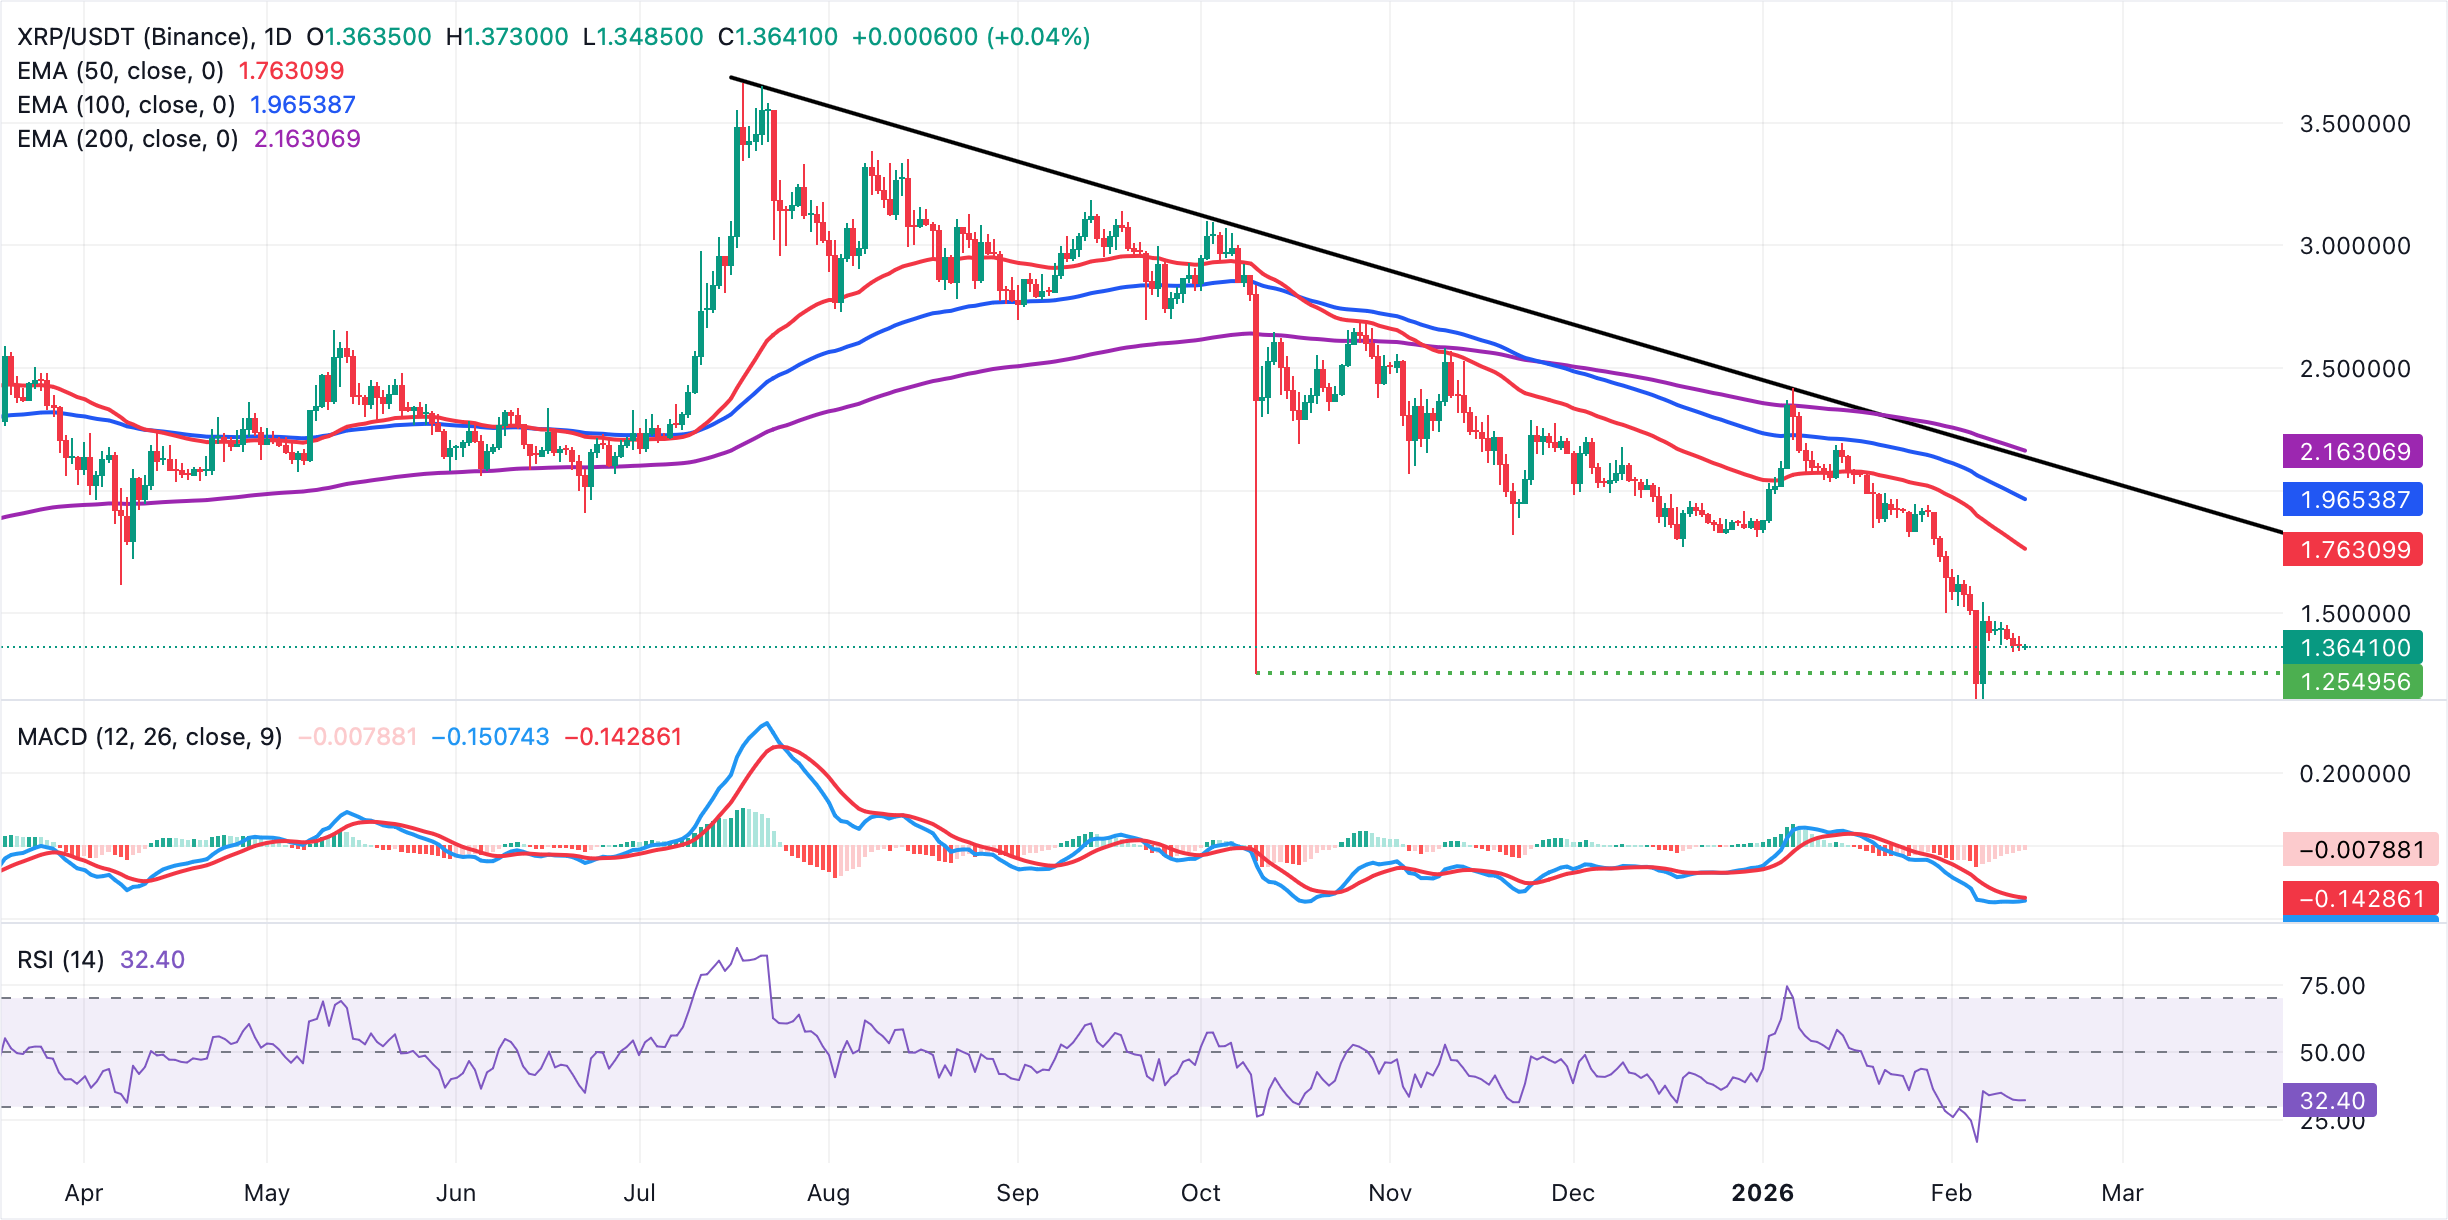
Although the MACD remains below its signal line, it is poised to cross above it. Such a scenario would prompt traders to increase risk exposure and support a stable recovery toward this week's open at $1.43. Nevertheless, XRP is not out of the woods and may extend the correction to the October 10 low at $1.25.
Cryptocurrency metrics FAQs
The developer or creator of each cryptocurrency decides on the total number of tokens that can be minted or issued. Only a certain number of these assets can be minted by mining, staking or other mechanisms. This is defined by the algorithm of the underlying blockchain technology. On the other hand, circulating supply can also be decreased via actions such as burning tokens, or mistakenly sending assets to addresses of other incompatible blockchains.
Market capitalization is the result of multiplying the circulating supply of a certain asset by the asset’s current market value.
Trading volume refers to the total number of tokens for a specific asset that has been transacted or exchanged between buyers and sellers within set trading hours, for example, 24 hours. It is used to gauge market sentiment, this metric combines all volumes on centralized exchanges and decentralized exchanges. Increasing trading volume often denotes the demand for a certain asset as more people are buying and selling the cryptocurrency.
Funding rates are a concept designed to encourage traders to take positions and ensure perpetual contract prices match spot markets. It defines a mechanism by exchanges to ensure that future prices and index prices periodic payments regularly converge. When the funding rate is positive, the price of the perpetual contract is higher than the mark price. This means traders who are bullish and have opened long positions pay traders who are in short positions. On the other hand, a negative funding rate means perpetual prices are below the mark price, and hence traders with short positions pay traders who have opened long positions.
(The technical analysis of this story was written with the help of an AI tool.)
Bài viết đề xuất


