

Binance, Uniswap, Bitget traders see $14.8B market cap rise as exchange tokens rebound
- BNB, UNI and BGB prices recorded over 3% gains as crypto markets rebounded on Friday
- Exchange native tokens market cap grew by $14.8 billion in the last 24 hours.
- Historical trends indicate that increased demand for exchange tokens signals the formation of a market bottom.
Exchange native tokens including Binance Coin (BNB), Uniswap (UNI), Bitget (BGB) rallied on Friday as crypto markets flashed early rebound signals. Could this trigger a major breakout phase in the coming days?
Exchange tokens surge as Crypto market hints at local bottom
Binance Coin (BNB), Uniswap (UNI) and Bitget Token (BGB) all posted notable gains on Friday, reigniting optimism across the cryptocurrency market.
This rally follows a week-long consolidation phase during which major cryptocurrencies struggled to reclaim lost ground amid macroeconomic uncertainties.
The newfound momentum in exchange tokens could signify a pivotal shift in market sentiment, hinting at the possibility of a broader breakout phase.
Exchange native tokens performance, January 10 | Source: Coingecko
As depicted above, BNB price gained 1.8% within 24 hours, nearing the $700 resistance level.
Similarly, UNI price climbed 8.2%, marking its highest daily gain this week. Bitget Token, often viewed as an under-the-radar performer, surged by an impressive 5.7%.
Zooming out, the aggregate market capitalization of exchange native tokens rose 1% in the last 24 hours, reflecting a $14.8 billion increase.
Historical patterns reveal that increased trading activity on platforms like Binance and Uniswap typically coincides with heightened investor confidence.
Hence, this $14.8 billion surge in exchange tokens valuation on Friday demand could reflect the formation of a local bottom and the beginning of an upward trend reversal.
However, the prospect of a sustained crypto market recovery in the coming days still relies heavily on external factors, including macroeconomic stability and institutional inflows.
BNB Price Forecast: $700 breakout ahead
Binance Coin (BNB) is the native token of the Binance exchange and the BNB Chain DeFi ecosystem. BNB price rose 1.8% in the past session to move above the Volume Weighted Average Price (VWAP) at $692.25.
The daily time frame shows a breakout from a falling wedge, a bullish technical pattern that often signals the end of a downtrend.
Additionally, the narrowing gap in the Moving Average Convergence Divergence (MACD) lines and the histogram turning less negative suggest weakening bearish momentum, hinting at a potential upward continuation.
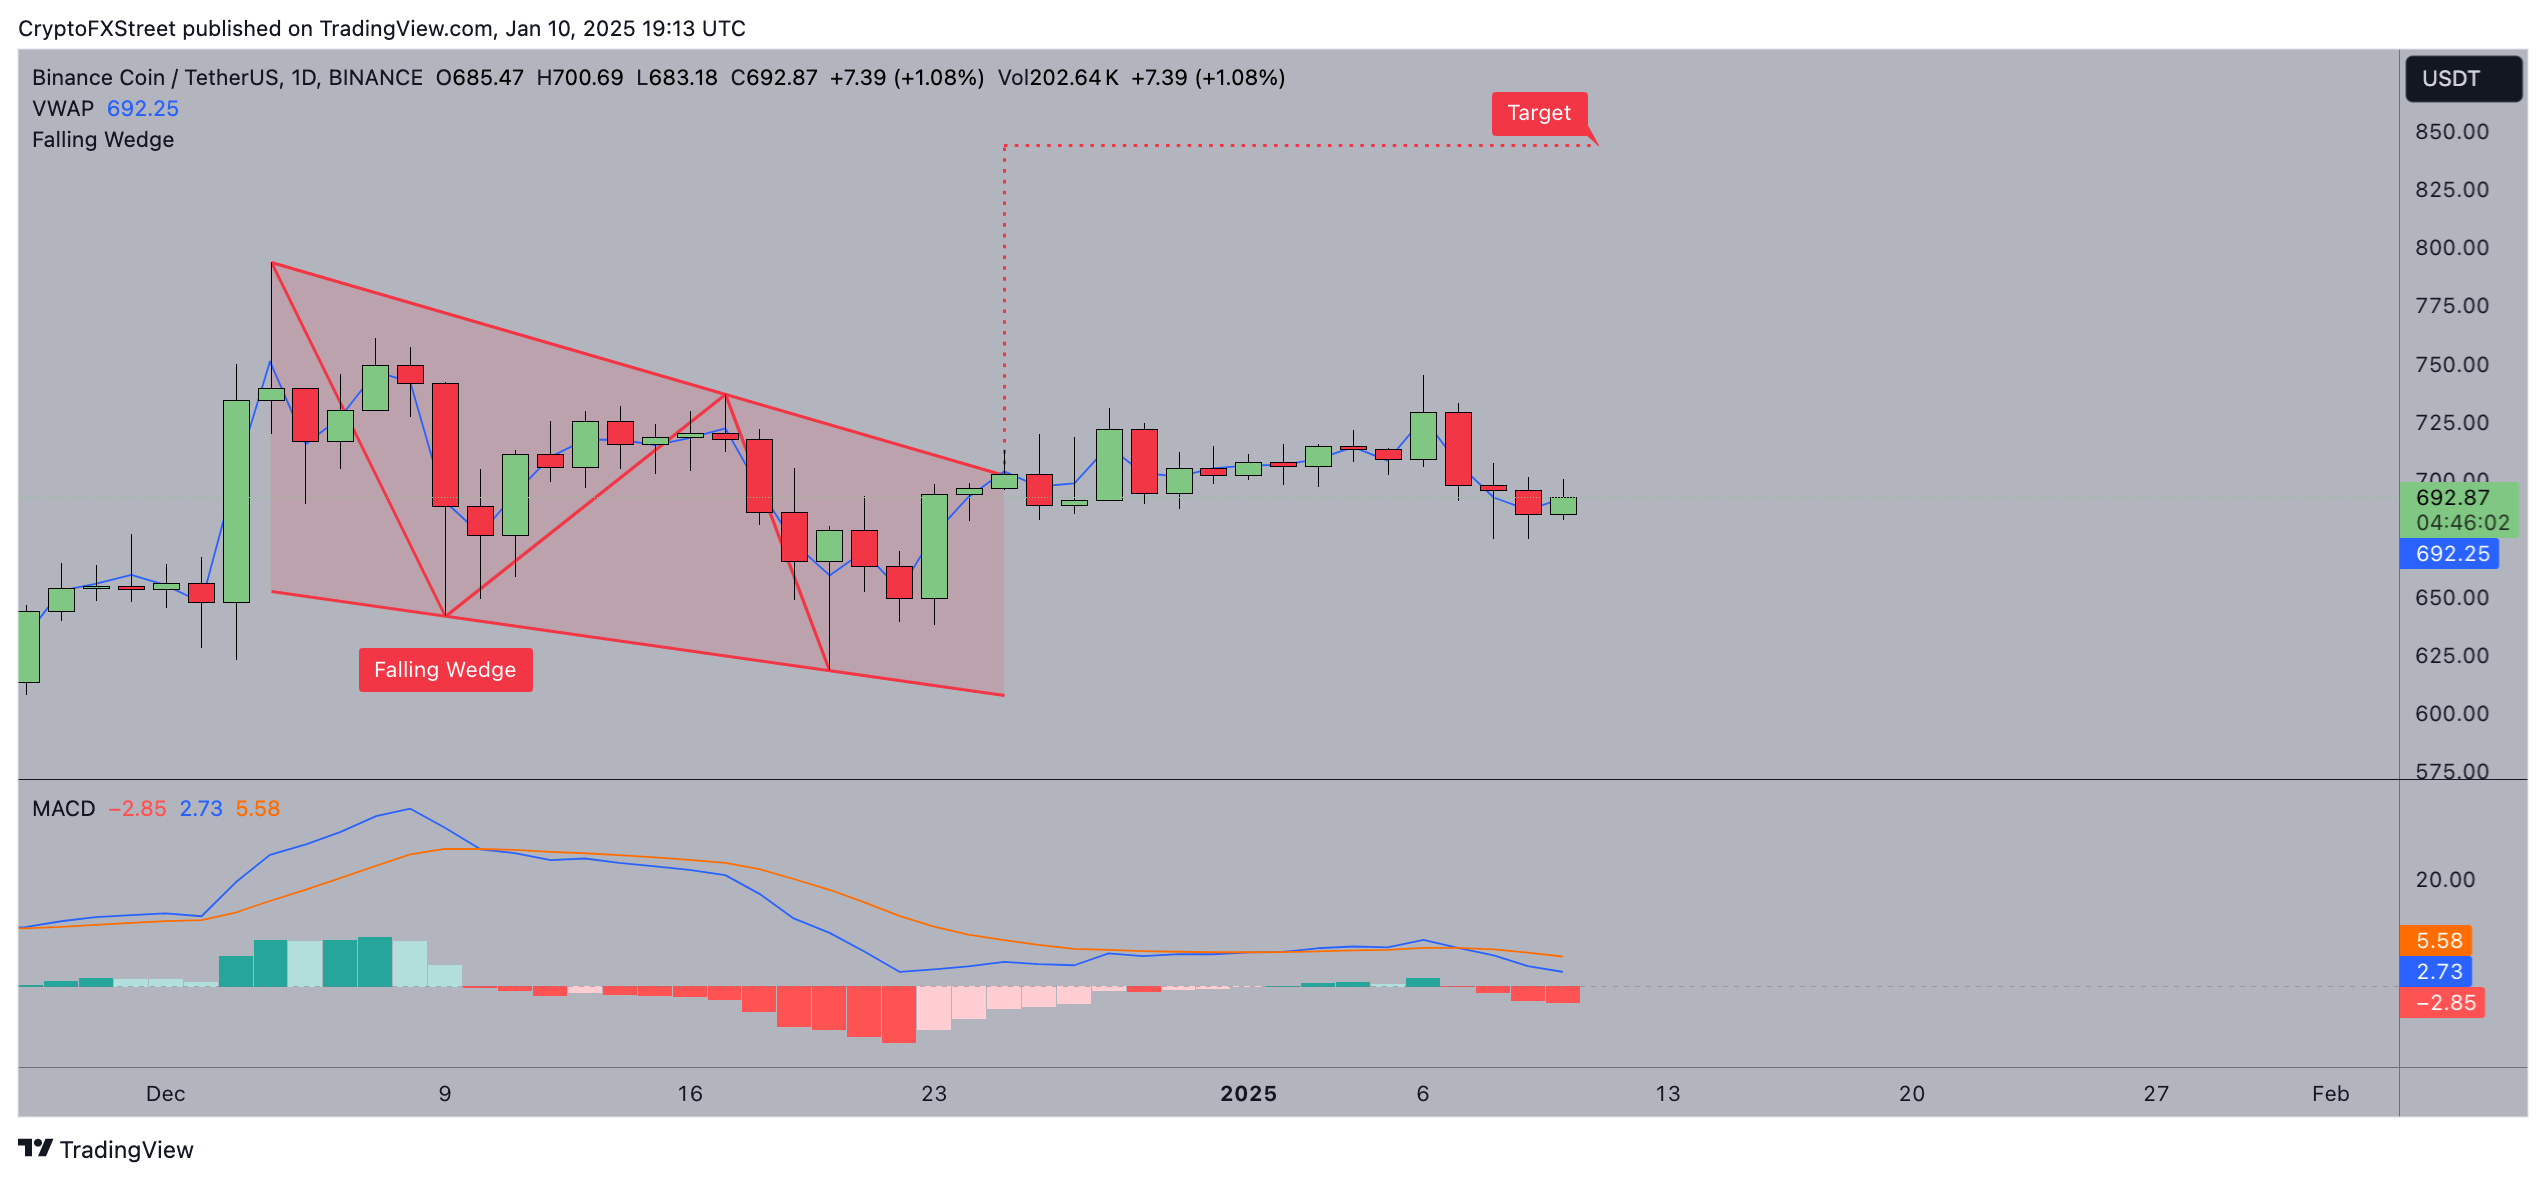 BNB price forecast | BNBUSD
If the breakout holds, BNB could target $700, a critical resistance reinforced by psychological and technical levels.
On the bearish side, the rejection from the $700 level and the inability to sustain gains above the Volume Weighted Average Price (VWAP) could reverse recent progress.
The MACD, while improving, has not yet confirmed a bullish crossover, leaving room for downside risk.
A failure to hold above the wedge breakout line could see BNB revisiting $675 and possibly $650, the next major support zones.
To confirm a sustained rally, BNB must decisively break $700 with increased volume and a bullish MACD crossover
BGB Price Forecast: Bulls eyeing $8 breakout?
Bitget Token (BGB) is trading at $6.644, up 4.71% in the past session. On the daily chart, the Relative Strength Index (RSI) stands at 65, approaching overbought territory but still leaving room for upside momentum.
BGB’s price recovery prospect is supported by the middle Bollinger Band at $6.613, while the upper Bollinger Band at $7.982 acts as a potential resistance, aligning with the $8 psychological level. The token's close above the VWAP at $6.613 strengthens the bullish outlook.
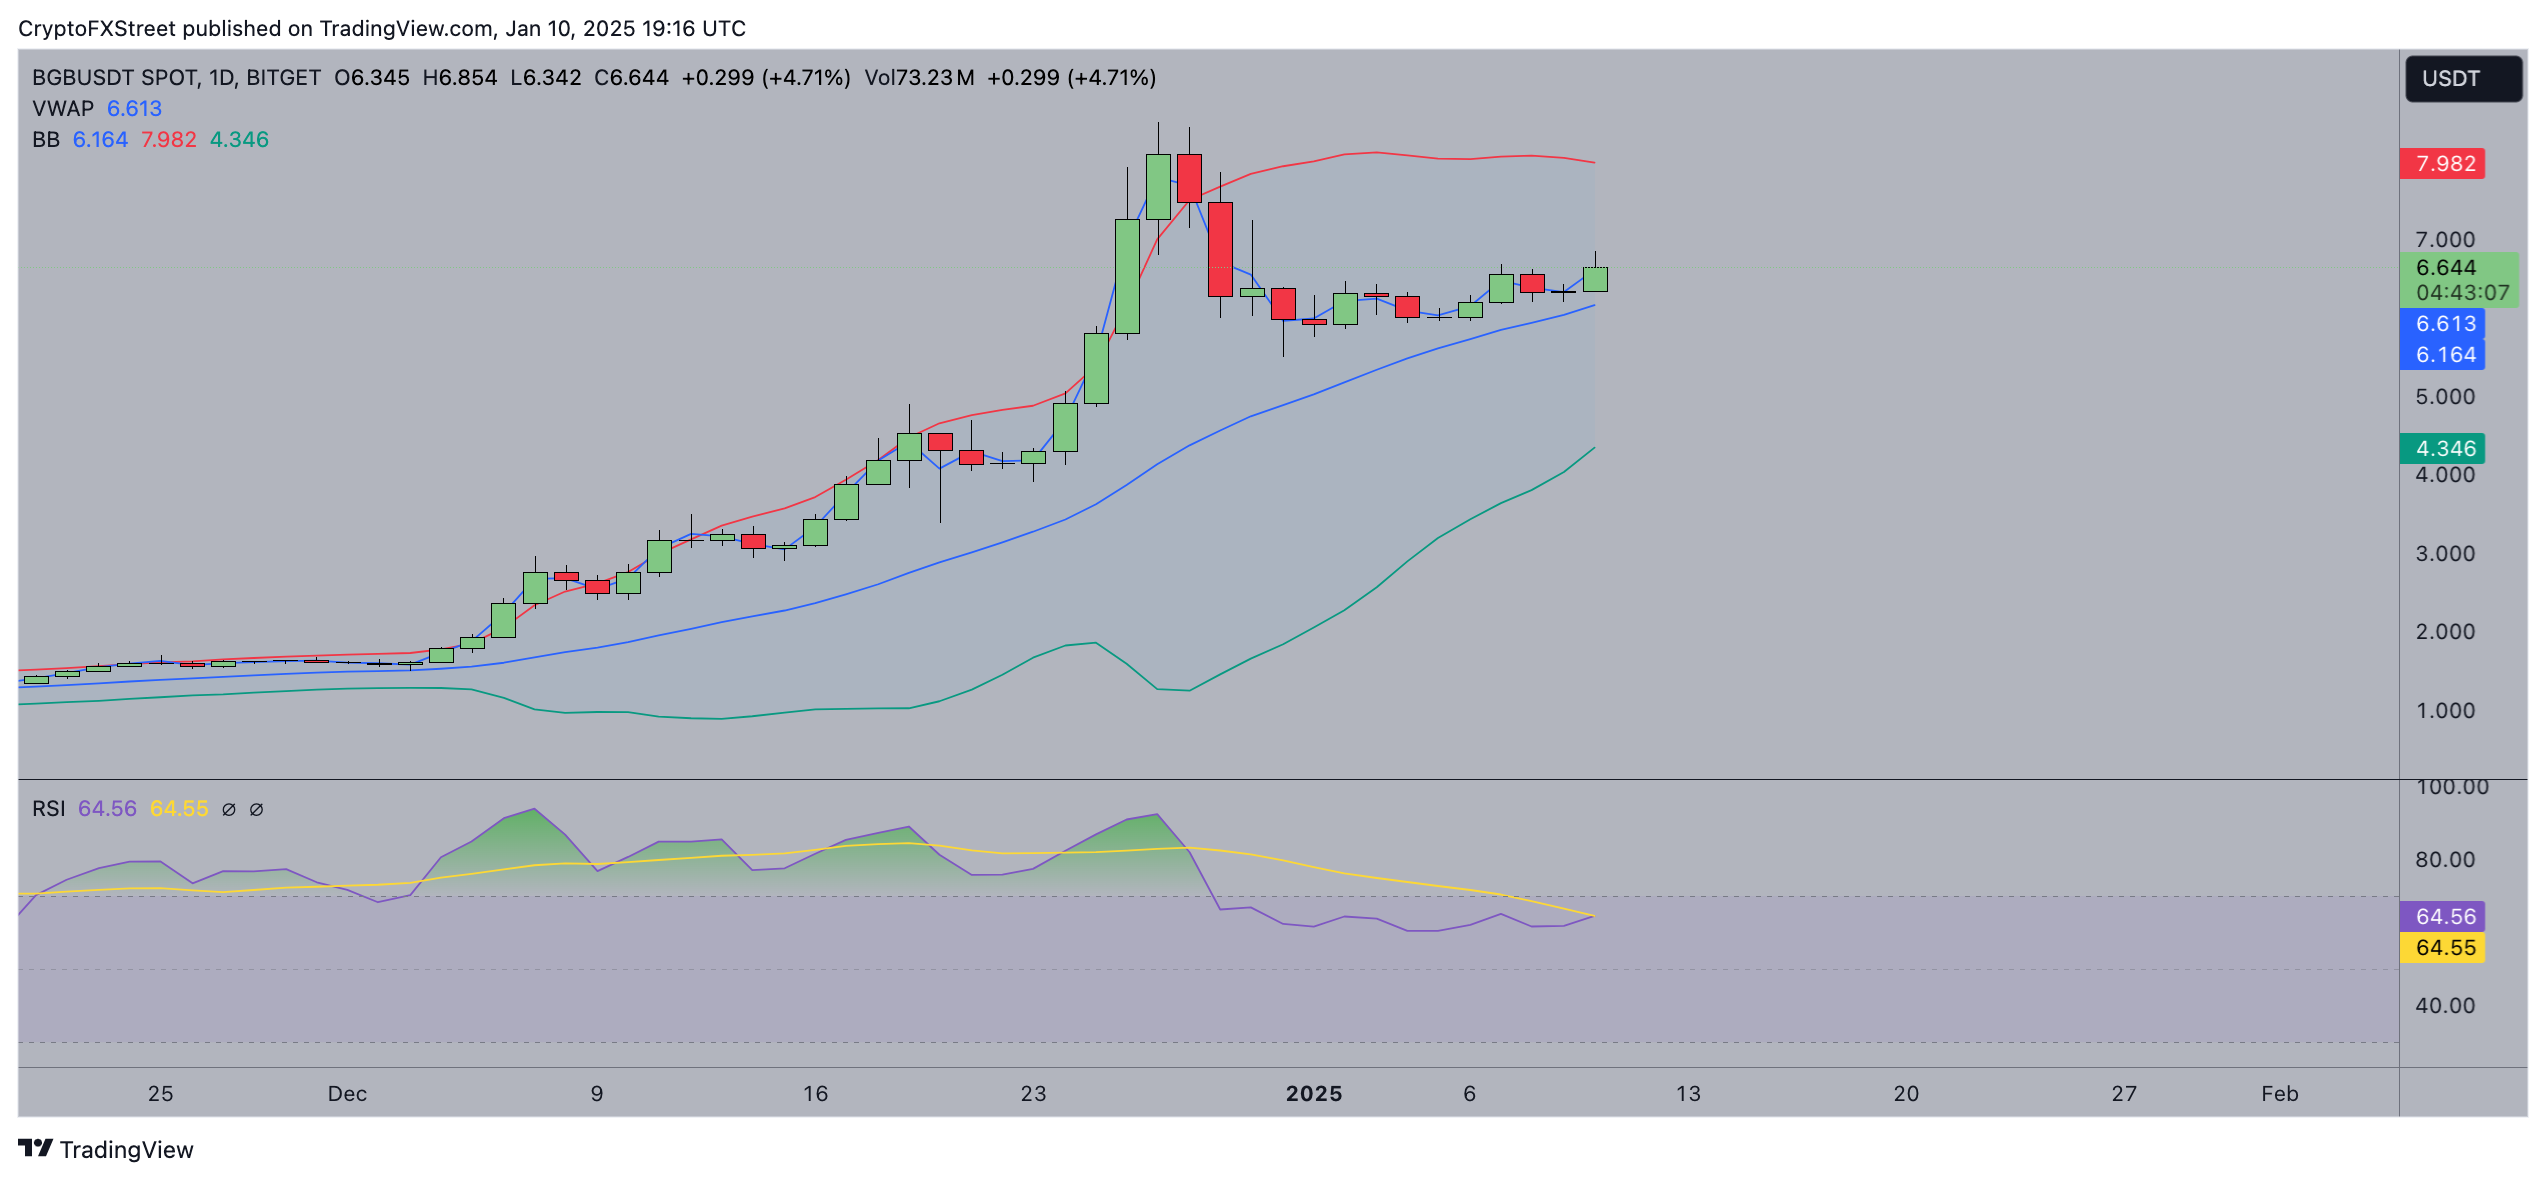 Bitget Token (BGB) Price Forecast
A bullish scenario could see BGB surging toward $7.50, supported by continued momentum and the RSI climbing toward 70. A breakout above $7.982 would confirm a rally toward $8, a key psychological and technical level.
However, caution is warranted. The RSI nearing overbought levels signals the possibility of a bearish reversal. If BGB fails to maintain support at $6.613, it could test the lower Bollinger Band at $6.164, with further declines toward $5 likely if bearish pressure intensifies.
The short-term momentum currently favors the bulls, but a decisive breakout above $8 remains critical to sustaining upward momentum.
Uniswap Price Forecast: All eyes on $14 resistance
Uniswap (UNI) is trading at $13.876, up 7.83% on the day, as bullish momentum resurfaces.
The Donchian Channel’s upper band at $15.645 acts as a critical resistance, while support lies at the lower band of $12.371.
The Average Directional Index (ADX) at 17.85 suggests a weak trend, indicating limited momentum for significant price shifts in either direction.
In a bullish scenario, UNI needs to break above the $14.008 mid-line of the Donchian Channel to sustain upward pressure.
Such a move could set the stage for a rally toward the $15.645 resistance.
However, the ADX's weak reading underscores the importance of increased buying volume to confirm a trend reversal.
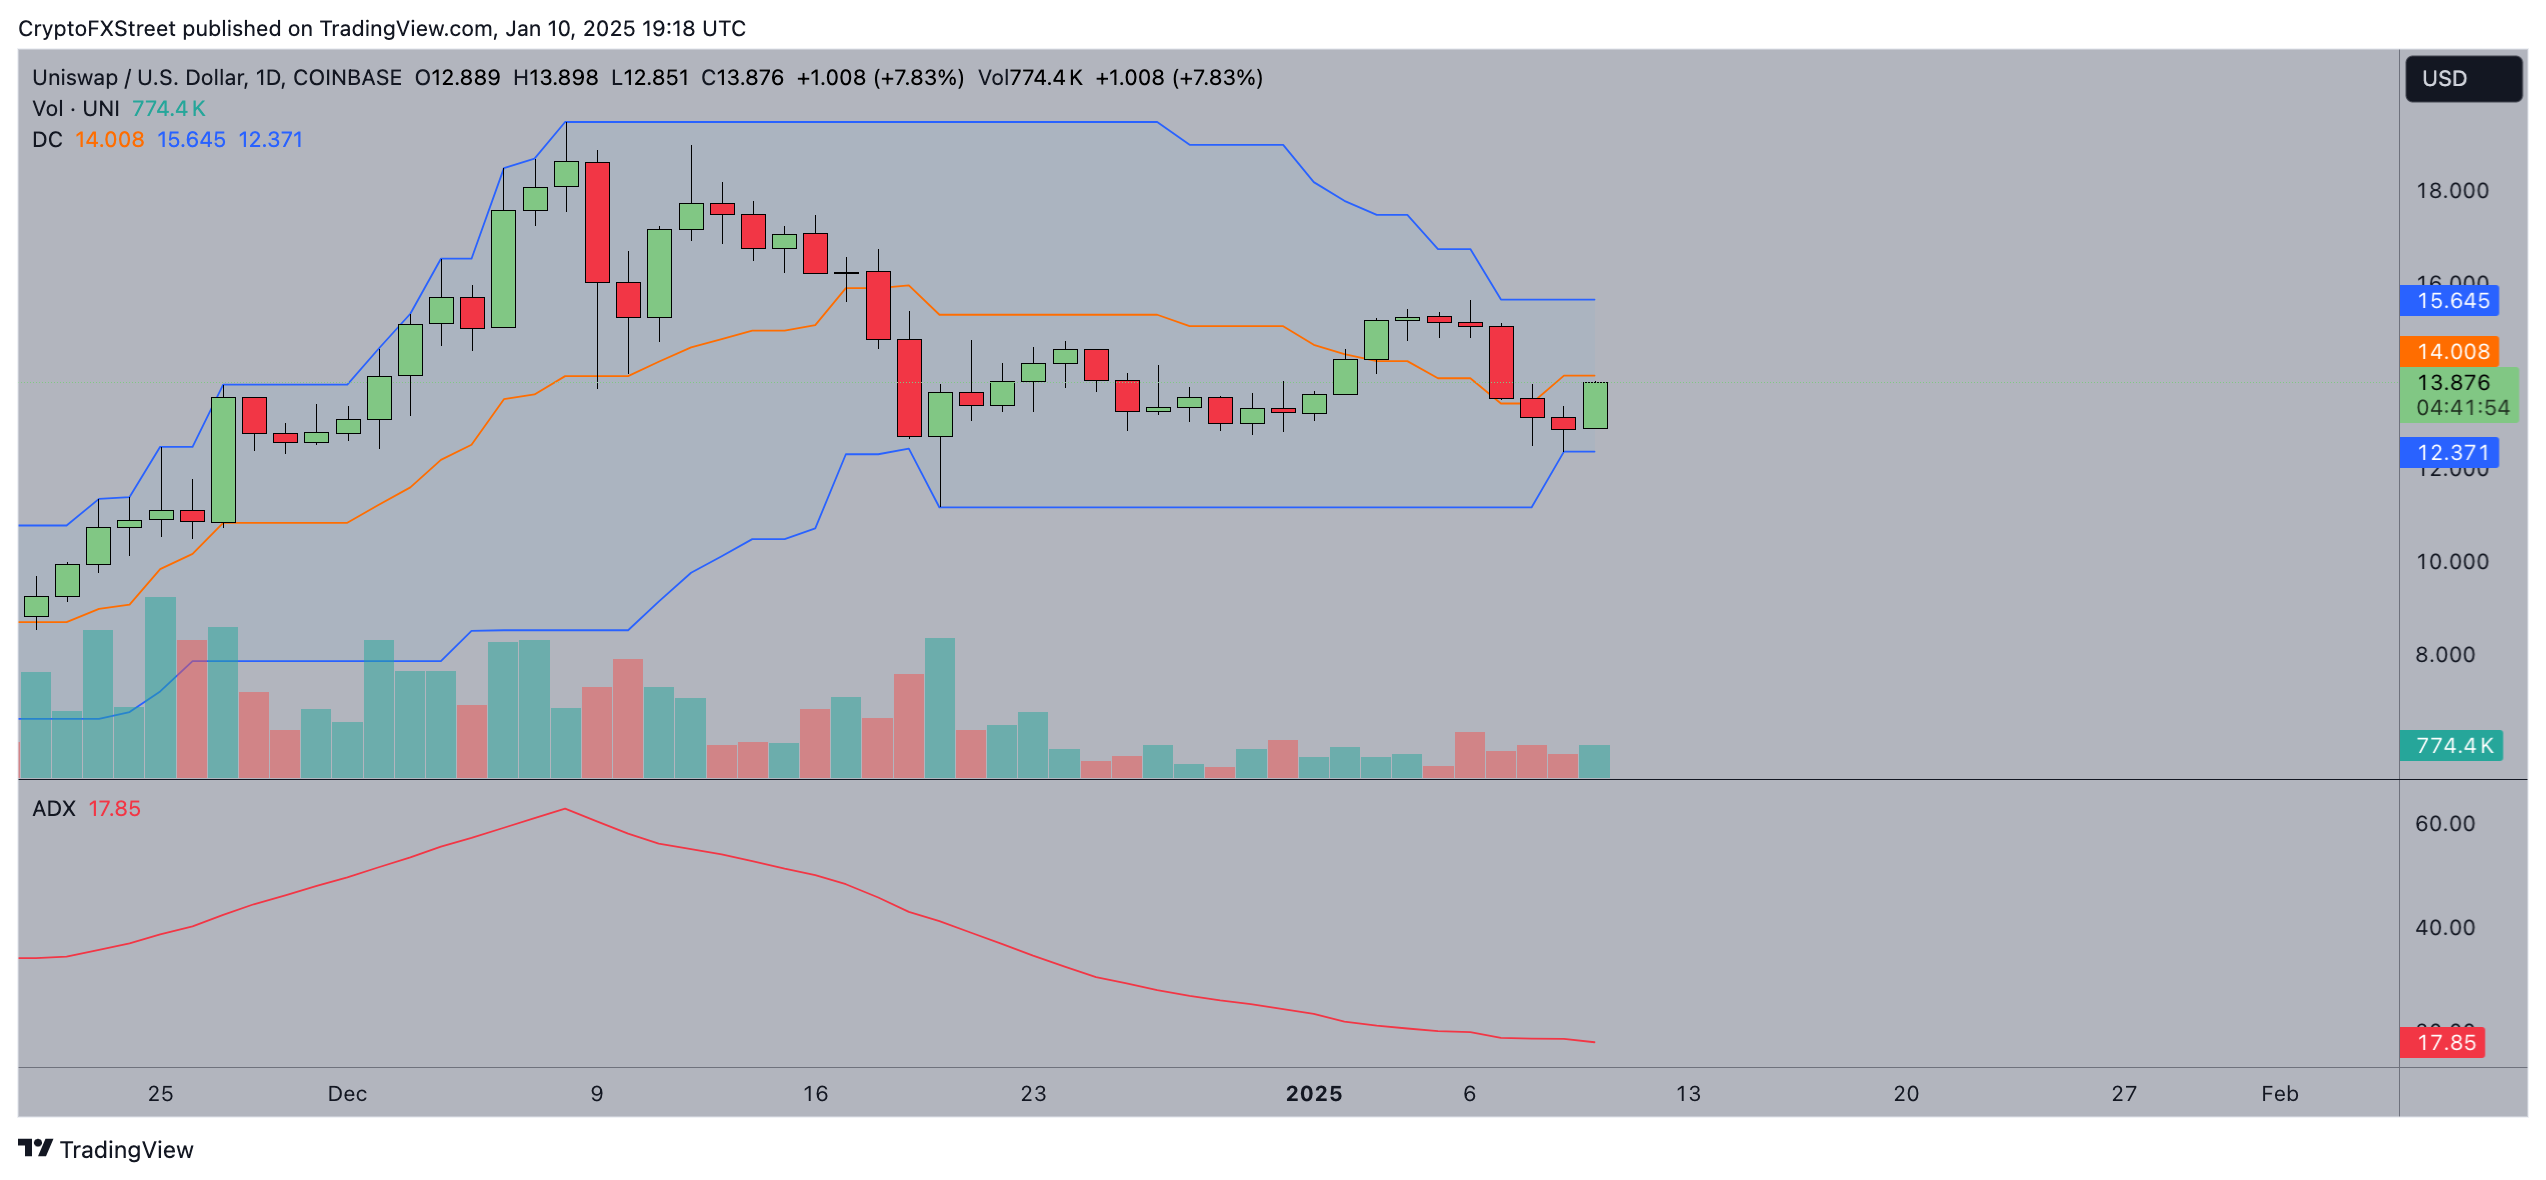 Uniswap (UNI) Price Forecast
On the bearish side, failure to maintain the current level could see UNI retesting $12.371.
This would indicate a bearish dominance, especially if the ADX continues its downtrend, signaling reduced market conviction.
While the price remains within a consolidating range, a decisive move above $14 or below $12.371 will likely define the next trend.
Bài viết đề xuất


