


Ripple Price Forecast: XRP gains momentum despite investors pulling capital
- XRP rises by more than 2% on Wednesday and trades above the key $1.00 level.
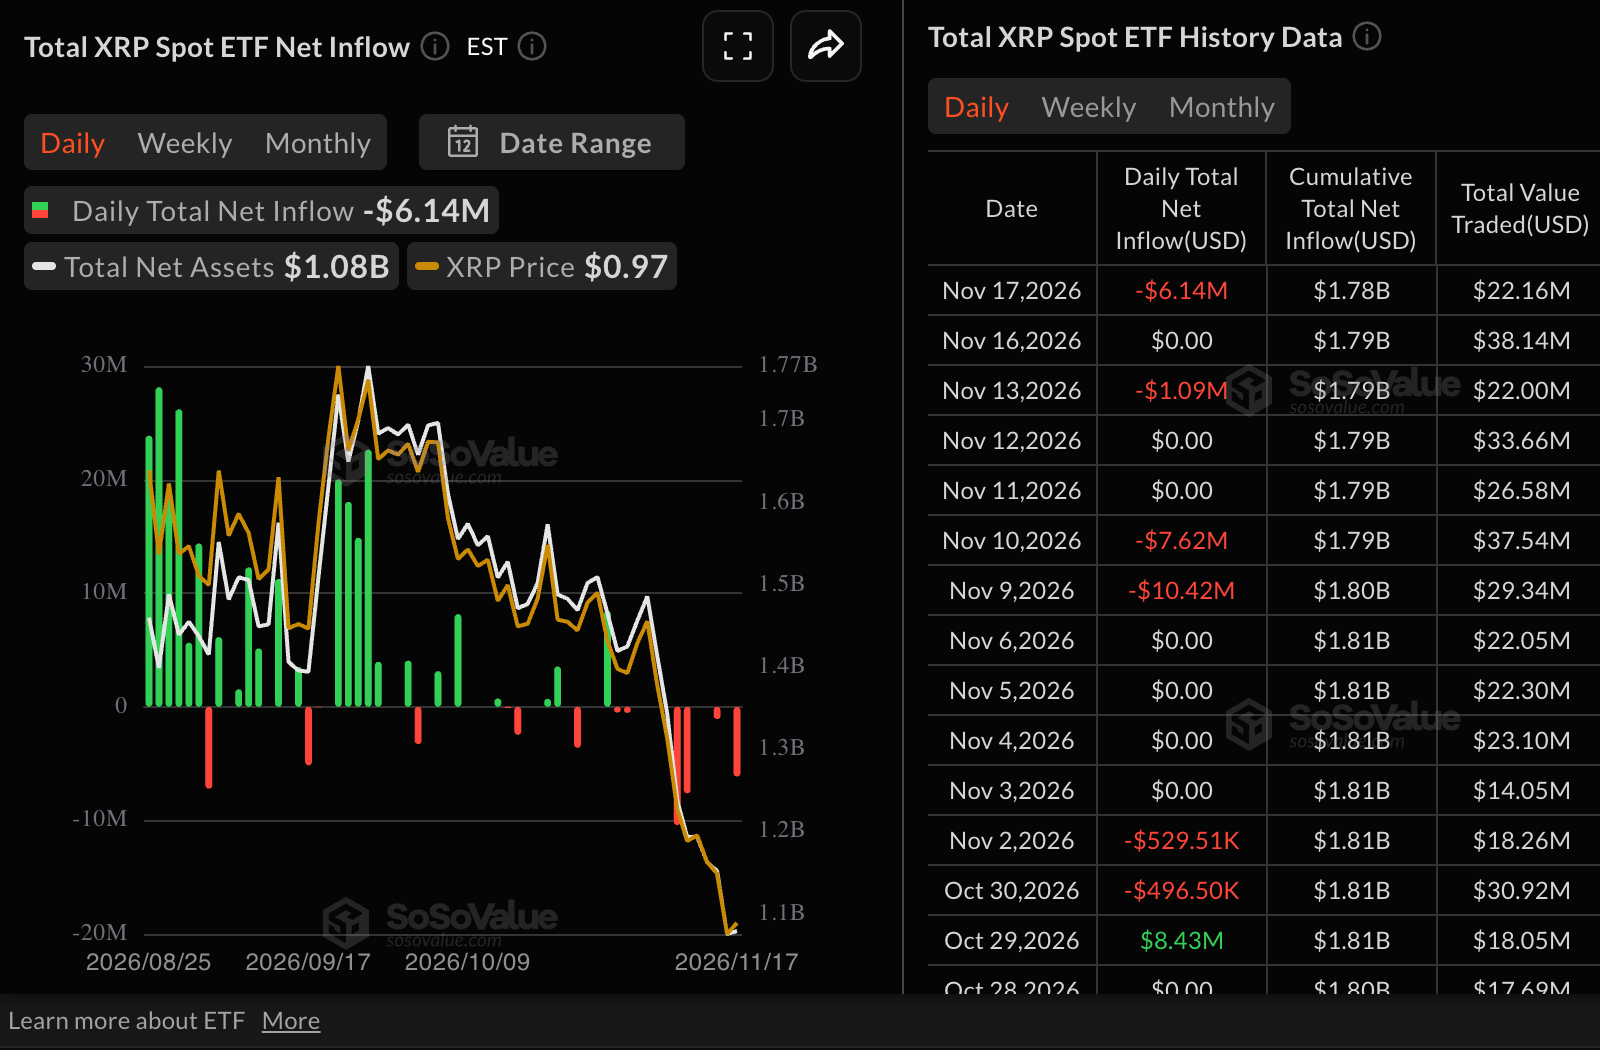
- US-listed XRP spot ETFs recorded $6 million in outflows on Tuesday, as institutional investors retreat.
- XRP bulls eye a sustained move above $1.00 as momentum indicators support a short-term recovery.
Ripple (XRP) rises near $1.00 on Wednesday, defying the broader crypto market’s bearish outlook. The remittance token is up over 2% on the day and against the backdrop of a sharp sell-off that tested lows last seen in November 2024 around $0.89.
A daily close above $1.00 could reinforce the path of least resistance on the upside, raising the odds of a sustained recovery toward the next key resistance at $1.20.
XRP ETF outflows mount as investor confidence fades
XRP spot Exchange-Traded Funds (ETFs) recorded roughly $6 million in outflows on Tuesday, following muted activity the day before and mild $1.1 million withdrawals last Friday. Despite the US-listed ETFs trading actively for one year, cumulative inflows stand at $1.78 billion, suggesting slow institutional uptake. Net assets under management stand at $1.08 billion, reinforcing subdued investor interest.
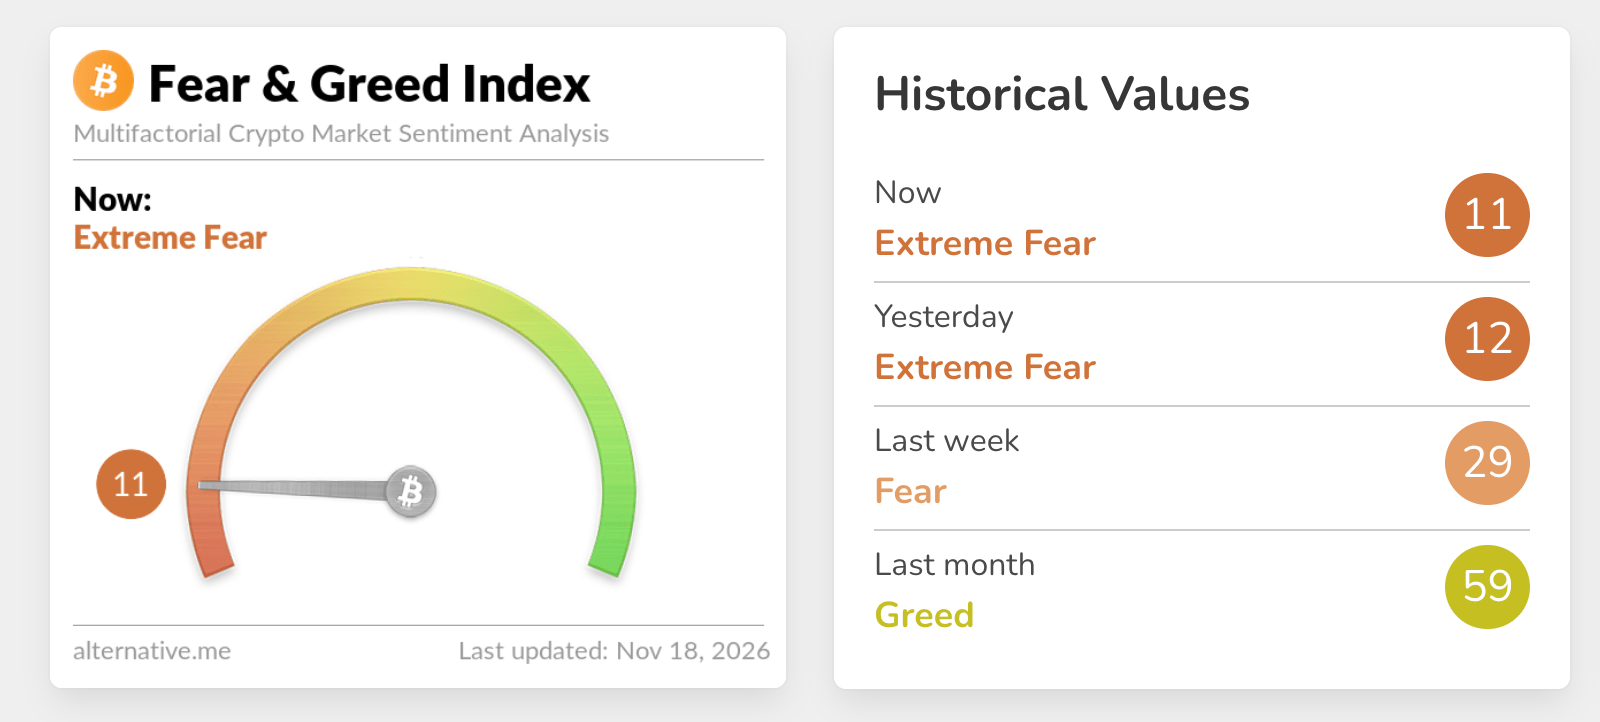
The Fear & Greed Index is down to 11 in the Extreme Fear territory, down only marginally from 12 the day in the same range the day before. This setup suggests appetite has significantly faded, weighing on demand for risk assets.
“Demand is shrinking fast. Total demand growth is contracting at its fastest pace since July 1, led by spot buyers,” CryptoQuant said in a recent report.
Technical analysis: XRP recovery gains momentum
XRP trades near $1.00 as the pair remains in a bearish near-term setup, holding well below the 50-day, 100-day, and 200-day Exponential Moving Averages (EMAs) at $1.21, $1.26, and $1.34, which collectively cap upside and underline a dominant downside bias.
The Parabolic SAR at $1.02 also sits above spot, reinforcing overhead pressure, while the Relative Strength Index (RSI) at 33 has bounced from oversold territory but still reflects weak demand. The Moving Average Convergence Divergence (MACD) remains negative, hinting that bearish momentum is easing only gradually.
Initial resistance lies at the Parabolic SAR barrier near $1.02, ahead of a more meaningful cluster of dynamic resistance at the 50-day EMA at $1.21, followed by the 100-day EMA at $1.26 and the longer-term 200-day EMA at $1.34. Unless buyers can reclaim and hold above these EMAs, the broader downtrend is likely to persist, with momentum gauges such as the RSI and MACD suggesting that any recovery attempts could struggle to sustain traction.
(The technical analysis of this story was written with the help of an AI tool. Know more.)
Bitcoin, altcoins, stablecoins FAQs
Bitcoin is the largest cryptocurrency by market capitalization, a virtual currency designed to serve as money. This form of payment cannot be controlled by any one person, group, or entity, which eliminates the need for third-party participation during financial transactions.
Altcoins are any cryptocurrency apart from Bitcoin, but some also regard Ethereum as a non-altcoin because it is from these two cryptocurrencies that forking happens. If this is true, then Litecoin is the first altcoin, forked from the Bitcoin protocol and, therefore, an “improved” version of it.
Stablecoins are cryptocurrencies designed to have a stable price, with their value backed by a reserve of the asset it represents. To achieve this, the value of any one stablecoin is pegged to a commodity or financial instrument, such as the US Dollar (USD), with its supply regulated by an algorithm or demand. The main goal of stablecoins is to provide an on/off-ramp for investors willing to trade and invest in cryptocurrencies. Stablecoins also allow investors to store value since cryptocurrencies, in general, are subject to volatility.
Bitcoin dominance is the ratio of Bitcoin's market capitalization to the total market capitalization of all cryptocurrencies combined. It provides a clear picture of Bitcoin’s interest among investors. A high BTC dominance typically happens before and during a bull run, in which investors resort to investing in relatively stable and high market capitalization cryptocurrency like Bitcoin. A drop in BTC dominance usually means that investors are moving their capital and/or profits to altcoins in a quest for higher returns, which usually triggers an explosion of altcoin rallies.
Bài viết đề xuất


