

Chainlink Price Forecast: LINK holds key support as ETF outflows, bearish bias persist

Nguồn Fxstreet
  • Chainlink hovers above $9 on Wednesday, maintaining a crucial support level after last week’s 10% decline.
  • LINK-focused ETFs recorded their third consecutive day of outflows, with $1.33 million withdrawn on Tuesday.
  • The technical outlook for LINK is mixed as persistent downside momentum approaches oversold conditions.

Chainlink (LINK) shows a relief attempt above $9.00 on Wednesday, defending a crucial support level near $8.60 after last week’s 10% losses. LINK-focused Exchange Traded Funds (ETFs) continue to face selling pressure from institutional investors, recording over $2 million in outflows so far this week amid mixed signals from the derivatives market. Chainlink could extend its decline toward the $7.00 round figure if selling pressure persists.

LINK ETF outflows extend for the fourth week

Institutional investors continue to reduce their exposure to LINK for the fourth straight week. SoSoValue data shows LINK ETFs mirrored Monday’s $1.33 million in outflows on Tuesday, extending the previous week’s outflow of $705,590. 

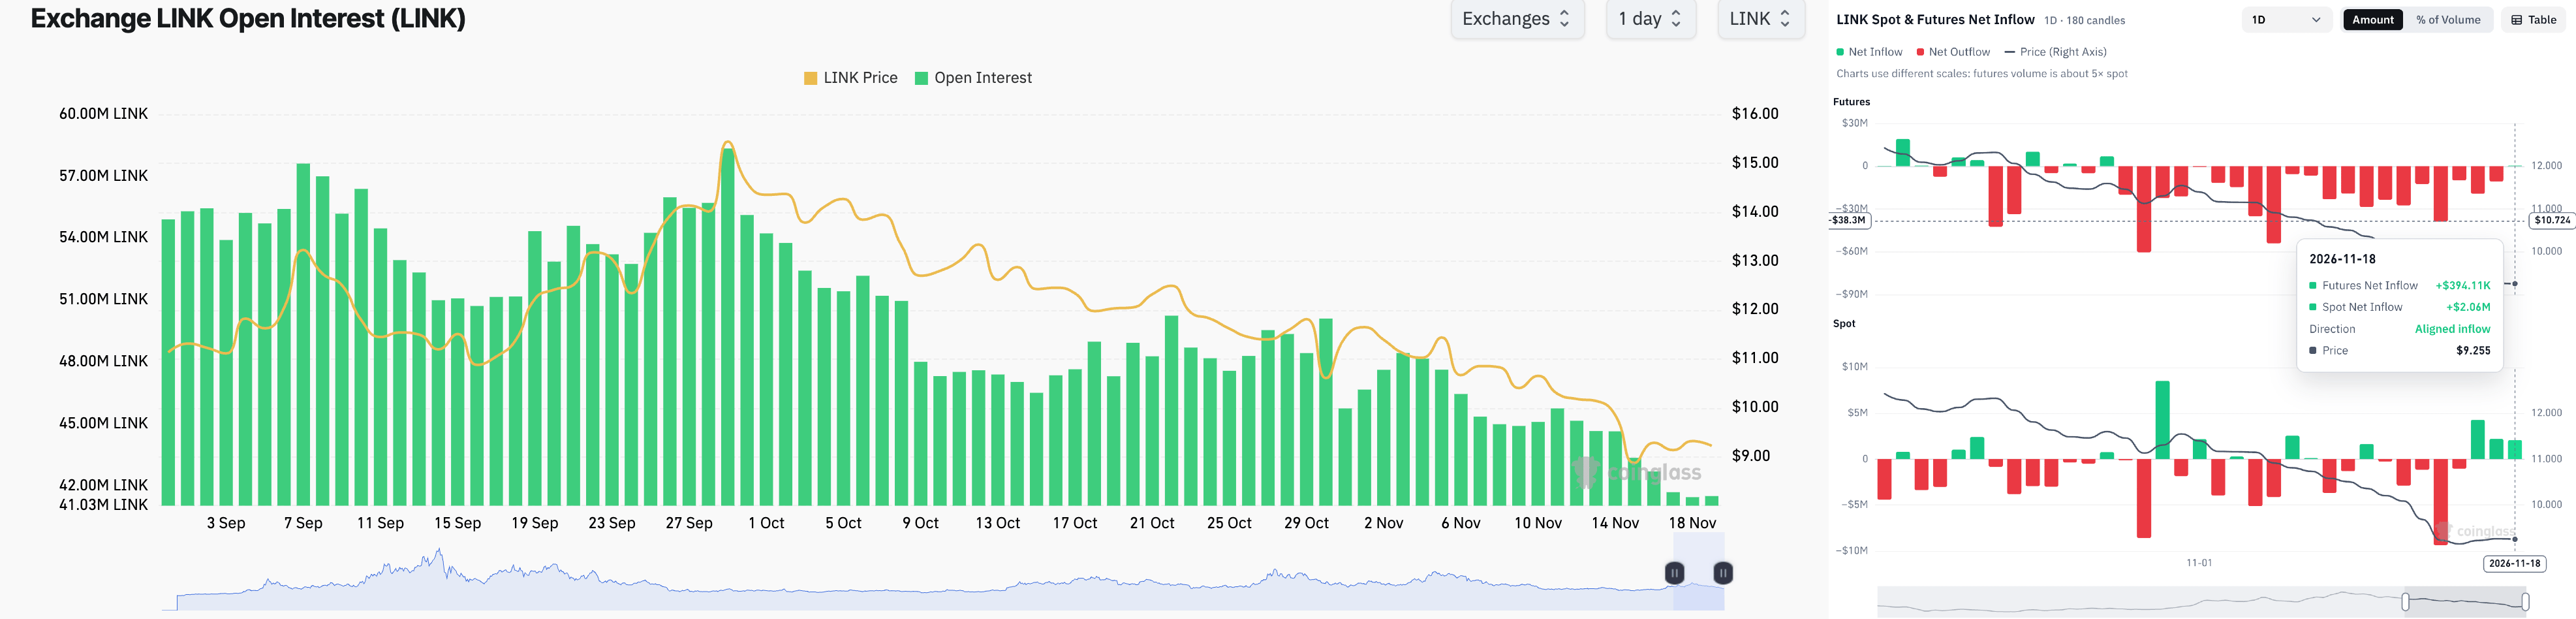
On the derivatives side, CoinGlass data shows the Chainlink futures Open Interest (OI) is down to 41.50 million LINK, from 45.75 million LINK last week, indicating a positional wipeout. Meanwhile, the futures and spot net inflows are at $394,110 and $2.06 million so far on Wednesday, hinting at potential capital inflows that could support its near-term recovery.
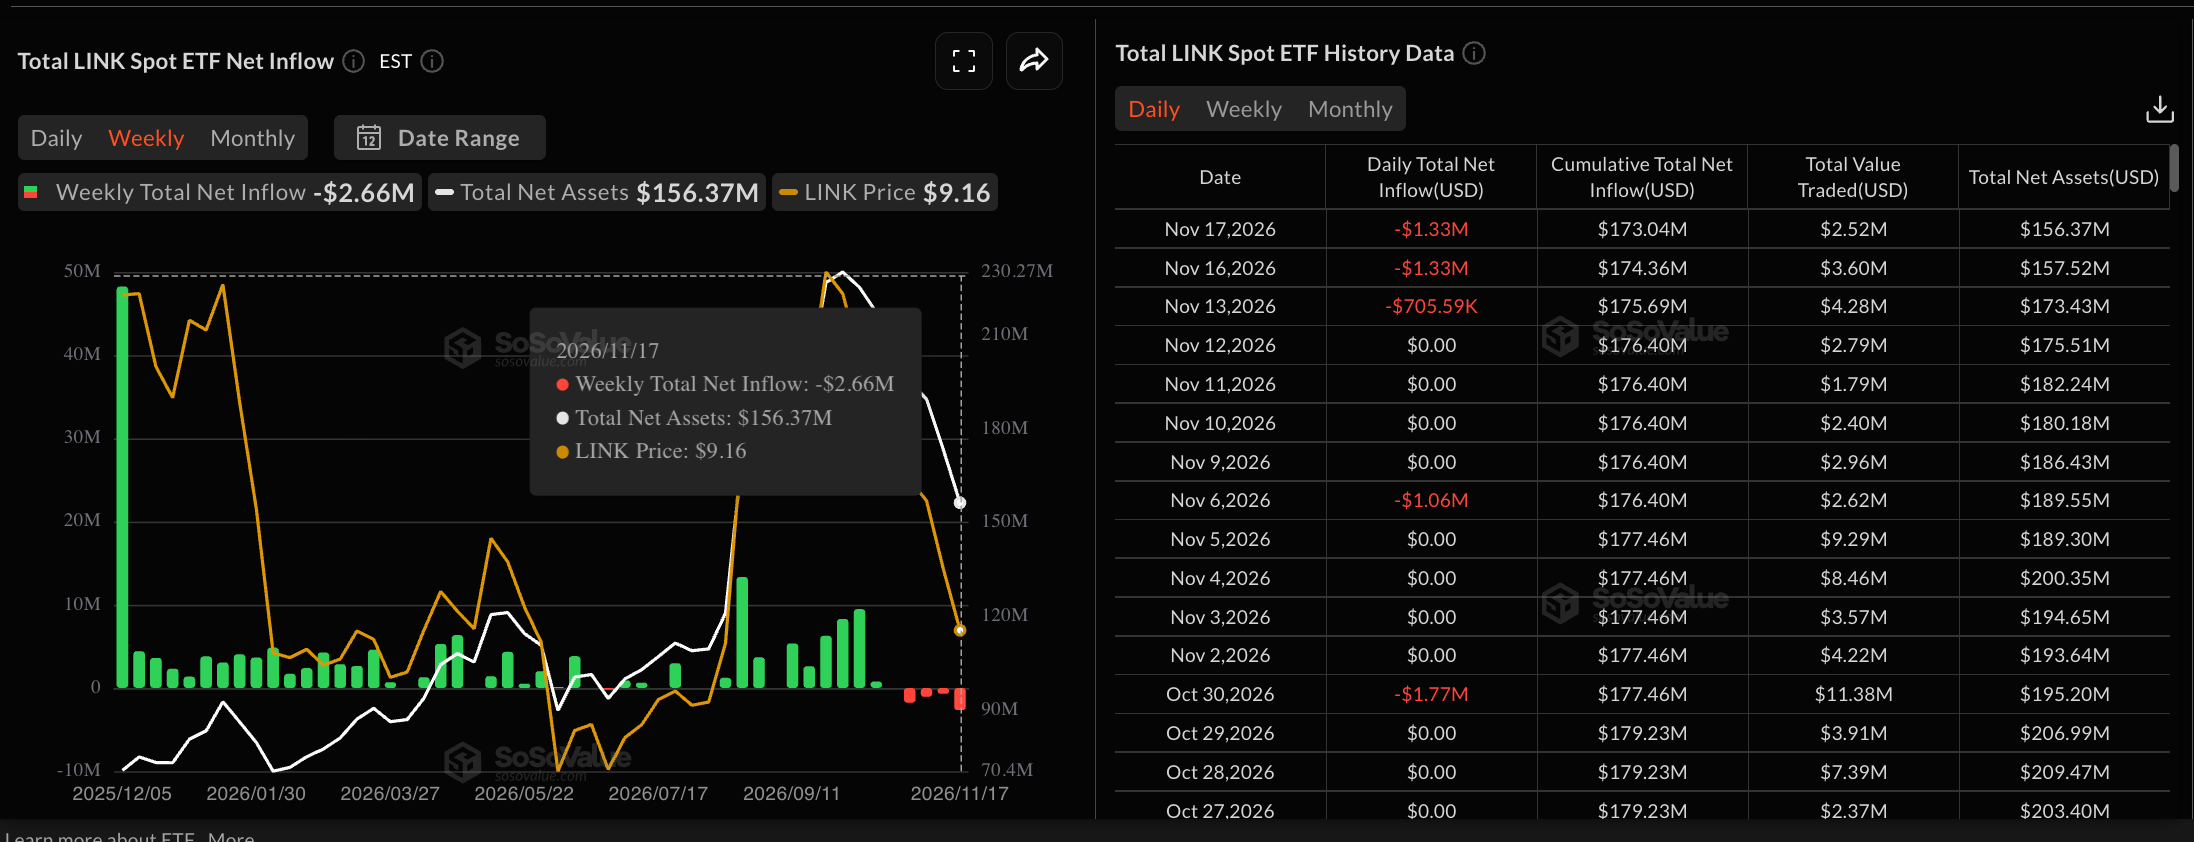
LINK ETFs data. Source: Sosovalue
LINK derivatives data. Source: CoinGlass

Technical outlook: Will LINK’s recovery reclaim $10?

Chainlink trades at $9.26 at press time on Wednesday, holding a bearish near-term bias well below the 200-day and 50-day Exponential Moving Averages (EMAs) at $10.89 and $11.09, respectively. This configuration suggests rallies are likely to be capped while the pair trades under this dense overhead band.

The Moving Average Convergence Divergence (MACD) line edges higher in negative territory, and the Relative Strength Index (RSI) stabilizes just above the oversold level of 34, hinting at slowing downside momentum rather than a confirmed reversal.

On the topside, initial resistance is seen at the horizontal barrier around $10.87, followed closely by the 200-day EMA at $10.89 and the 50-day EMA at $11.09, forming a critical confluence zone that bulls would need to reclaim to ease the broader bearish pressure, ahead of higher hurdles at $12.40 and $15.53.

Chart Analysis LINK/USDT (Binance)
LINK/USDT daily price chart.

Looking down, immediate support emerges at $8.60, with a deeper floor near $7.01, where buyers would be expected to show stronger interest if selling resumes.

(The technical analysis of this story was written with the help of an AI tool. Know more.)

Tuyên bố miễn trừ trách nhiệm: Chỉ dành cho mục đích thông tin. Hiệu suất trong quá khứ không đảm bảo cho kết quả trong tương lai.
placeholder
Dự báo giá vàng: XAU/USD trôi dạt cao hơn trên 3.050$ do căng thẳng thương mại Mỹ-Trung gia tăngGiá Vàng (XAU/USD) nhích lên khoảng 3.080$ trong phiên giao dịch muộn của Mỹ vào thứ Tư. Nhu cầu trú ẩn an toàn giữa những căng thẳng thương mại leo thang giữa Mỹ và Trung Quốc cung cấp một số hỗ trợ cho kim loại quý này
Tác giả  FXStreet
ngày10 tháng 4 năm 2025
Giá Vàng (XAU/USD) nhích lên khoảng 3.080$ trong phiên giao dịch muộn của Mỹ vào thứ Tư. Nhu cầu trú ẩn an toàn giữa những căng thẳng thương mại leo thang giữa Mỹ và Trung Quốc cung cấp một số hỗ trợ cho kim loại quý này
placeholder
WTI kéo dài đà tăng trên mức 70,50$ trước thềm công bố Doanh số bán lẻ của MỹWest Texas Intermediate (WTI), chuẩn dầu thô của Mỹ, đang giao dịch quanh mức 70,60$ trong giờ giao dịch châu Á vào thứ Ba. Giá WTI tăng cao hơn giữa những rủi ro địa chính trị dai dẳng ở Trung Đông
Tác giả  FXStreet
ngày17 tháng 6 năm 2025
West Texas Intermediate (WTI), chuẩn dầu thô của Mỹ, đang giao dịch quanh mức 70,60$ trong giờ giao dịch châu Á vào thứ Ba. Giá WTI tăng cao hơn giữa những rủi ro địa chính trị dai dẳng ở Trung Đông
placeholder
Giá vàng tăng thêm vượt qua 5.050$ nhờ nhu cầu về tài sản trú ẩn an toàn và kỳ vọng ôn hòa từ FedVàng (XAU/USD) thu hút giao dịch mua bùng nổ theo đà trong ngày thứ hai liên tiếp và tăng vượt qua mốc tâm lý 5.000$ trong phiên giao dịch châu Á vào thứ Tư giữa bối cảnh dòng tiền toàn cầu tìm đến sự an toàn.
Tác giả  FXStreet
2 tháng 04 ngày Thứ Tư
Vàng (XAU/USD) thu hút giao dịch mua bùng nổ theo đà trong ngày thứ hai liên tiếp và tăng vượt qua mốc tâm lý 5.000$ trong phiên giao dịch châu Á vào thứ Tư giữa bối cảnh dòng tiền toàn cầu tìm đến sự an toàn.
placeholder
Dự báo giá bạc: XAG/USD giảm xuống mức thấp nhất trong 13 tháng do triển vọng diều hâu của FedGiá bạc (XAG/USD) giảm sau khi ghi nhận mức tăng khiêm tốn vào ngày trước đó, giao dịch quanh mức 45,80$ mỗi ounce troy trong phiên giao dịch châu Á vào thứ Tư.
Tác giả  FXStreet
7 giờ trước
Giá bạc (XAG/USD) giảm sau khi ghi nhận mức tăng khiêm tốn vào ngày trước đó, giao dịch quanh mức 45,80$ mỗi ounce troy trong phiên giao dịch châu Á vào thứ Tư.
placeholder
Giá vàng chạm mức thấp gần 1,5 năm dưới 3.800 USD khi phe gấu đe dọa giảm về 3.500 USD Giá vàng giảm thủng ngưỡng 3.800 USD, chạm mức thấp mới kể từ tháng 9/2025, đòi hỏi mức độ cảnh giác cao trước rủi ro giảm giá về mốc 3.500 USD.Ngày 18/11, giá vàng giao ngay quốc tế (XAU
Tác giả  FXStreet
2 giờ trước
Giá vàng giảm thủng ngưỡng 3.800 USD, chạm mức thấp mới kể từ tháng 9/2025, đòi hỏi mức độ cảnh giác cao trước rủi ro giảm giá về mốc 3.500 USD.Ngày 18/11, giá vàng giao ngay quốc tế (XAU
sản phẩm liên quan
goTop
quote