


Ripple Price Forecast: XRP bulls struggle as Binance whale withdrawals surge
- XRP trades marginally above $0.95 as bulls push to gain ground, but upside remains strongly capped.
- XRP whales withdrew $21 million from Binance on Monday, extending broader $127 million outflows since November 10.
- The XRP technical outlook remains significantly weak, with the negative MACD and an oversold RSI.
Ripple (XRP) trades slightly above $0.95 on Tuesday, with the price largely confined between the psychological level at $0.94 and resistance at $0.98. Despite the recent correction below $1.00, the path of least resistance remains downward, weighed by weak technical levels, capital outflows from related products such as spot Exchange-Traded Funds (ETFs), and soaring whale withdrawals.
XRP wobbles as Binance whale withdrawals mount
The drop in XRP price below $1.00 appeared to have driven whales to the edge, as reflected in the surge in withdrawals from Binance, the largest cryptocurrency exchange. Large-volume investors withdrew about $21 million worth of XRP on Monday, with daily net outflows ranging from $12 million to $33 million over the past week, according to CryptoQuant’s on-chain analyst, Darkfost.
More broadly, whales have withdrawn about $127 million net from Binance since November 10, signaling a notable shift in investor behavior. Looking back, inflows stood out in August, during the XRP rally, with daily deposits averaging $75 million.
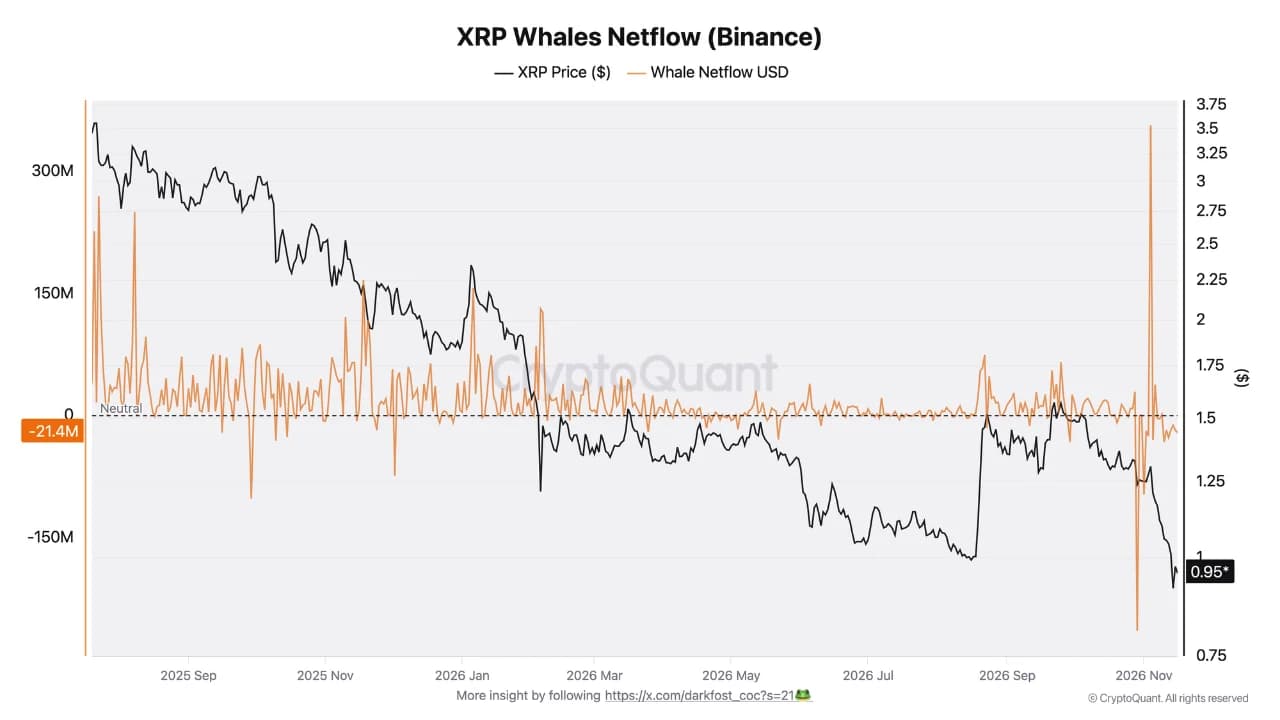
The bearish outlook remains intact across key investment products, given that spot ETFs recorded roughly $19 million in outflows during the week ending November 13.
“This dominance of withdrawals could therefore reflect a growing willingness among whales to accumulate and hold XRP for the longer term, a potentially very positive development for establishing a stronger price floor just below the $1.00 mark,” Darkfost stated.
However, the analyst warns that traders should temper their expectations, as some withdrawals could be linked to Binance’s internal transfers. This perspective looks back to the $6.3 billion Binance hack, as the exchange was forced to replenish its reserves.
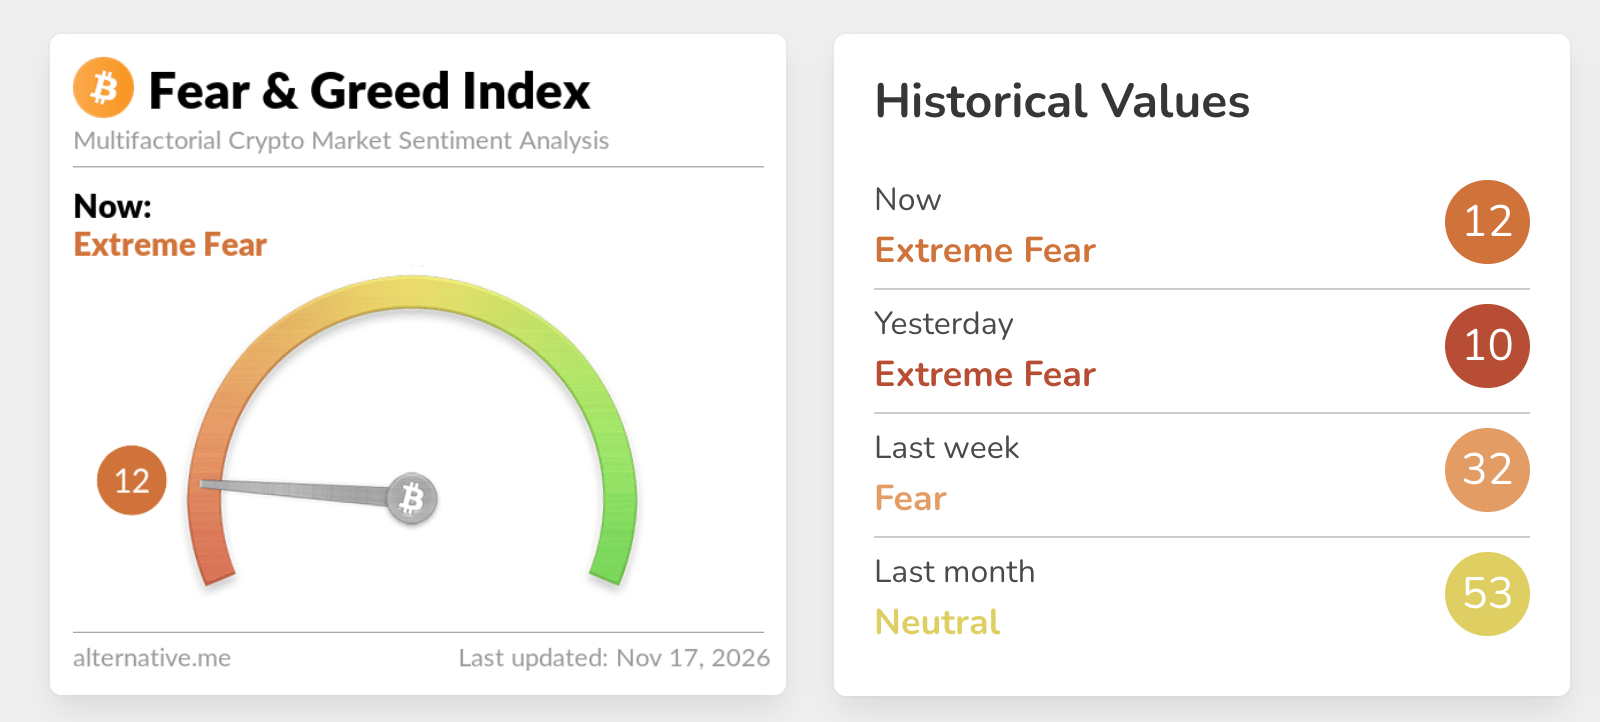
Similarly, the Fear & Greed Index has fallen significantly and now sits in the Fear territory at 12 on Tuesday, up only marginally from 10 the previous day. With the lack of appetite for risk assets still dominant, sustaining a recovery may be an uphill task in the short to medium term.
Technical analysis: XRP consolidation offers little relief as sellers retain control
XRP trades above $0.95, extending its slide well below the main Exponential Moving Averages (EMAs) and keeping a clear bearish near-term bias. The 50-day, 100-day and 200-day EMAs) cluster far overhead between $1.22 and $1.33, suggesting the broader trend remains under heavy pressure, while the SuperTrend line at $1.13 reinforces the idea that the market is still capped by prior breakdown levels.
Momentum is weak, with the Relative Strength Index (RSI) at 26 in oversold territory and the Moving Average Convergence Divergence (MACD) in negative territory, which hints that while a corrective bounce is possible, selling pressure still dominates.
Initial resistance appears at the SuperTrend barrier around $1.13, ahead of the 50-day EMA at $1.22. A stronger recovery would face a more significant hurdle near the former trendline break level at $1.24, followed by the 100-day EMA at $1.26, while the 200-day EMA at $1.33 marks a broader bearish pivot that would need to be reclaimed to ease the prevailing downtrend.
With no clear structural support on the daily chart below the current price, short-term traders may watch intraday reactions around these overhead levels to gauge whether XRP can build a base or remains vulnerable to further downside.
(The technical analysis of this story was written with the help of an AI tool. Know more.)
Cryptocurrency metrics FAQs
The developer or creator of each cryptocurrency decides on the total number of tokens that can be minted or issued. Only a certain number of these assets can be minted by mining, staking or other mechanisms. This is defined by the algorithm of the underlying blockchain technology. On the other hand, circulating supply can also be decreased via actions such as burning tokens, or mistakenly sending assets to addresses of other incompatible blockchains.
Market capitalization is the result of multiplying the circulating supply of a certain asset by the asset’s current market value.
Trading volume refers to the total number of tokens for a specific asset that has been transacted or exchanged between buyers and sellers within set trading hours, for example, 24 hours. It is used to gauge market sentiment, this metric combines all volumes on centralized exchanges and decentralized exchanges. Increasing trading volume often denotes the demand for a certain asset as more people are buying and selling the cryptocurrency.
Funding rates are a concept designed to encourage traders to take positions and ensure perpetual contract prices match spot markets. It defines a mechanism by exchanges to ensure that future prices and index prices periodic payments regularly converge. When the funding rate is positive, the price of the perpetual contract is higher than the mark price. This means traders who are bullish and have opened long positions pay traders who are in short positions. On the other hand, a negative funding rate means perpetual prices are below the mark price, and hence traders with short positions pay traders who have opened long positions.
Bài viết đề xuất


