


Bitcoin Price Forecast: BTC slips below $75,000 ahead of US CPI data
- Bitcoin trades below $75,000 on Tuesday after closing below the key 200-day EMA around $76,444 last week.
- Market participants await the US CPI report on Tuesday, which could shift Fed rate hike expectations and trigger fresh volatility in BTC.
- US-listed spot ETFs recorded $201.08 million in net outflows on Monday, while Strategy added 1,036 BTC to its treasury.
Bitcoin (BTC) remains under pressure, trading below $75,000 on Tuesday after closing below the key technical support zone last week. Institutional demand remains mixed, with Exchange Traded Funds (ETFs) recording continuing to record outflows while Strategy (MSTR) added 1,036 BTC to its treasury.
Meanwhile, traders are now focused on the upcoming US October Consumer Price Index (CPI) data on Tuesday, which could influence Federal Reserve (Fed) rate-hike expectations and trigger fresh volatility in the Crypto King.
US CPI in focus
All eyes remain on the high-impact US CPI data, which could determine whether risky assets such as BTC recover or extend losses sharply.
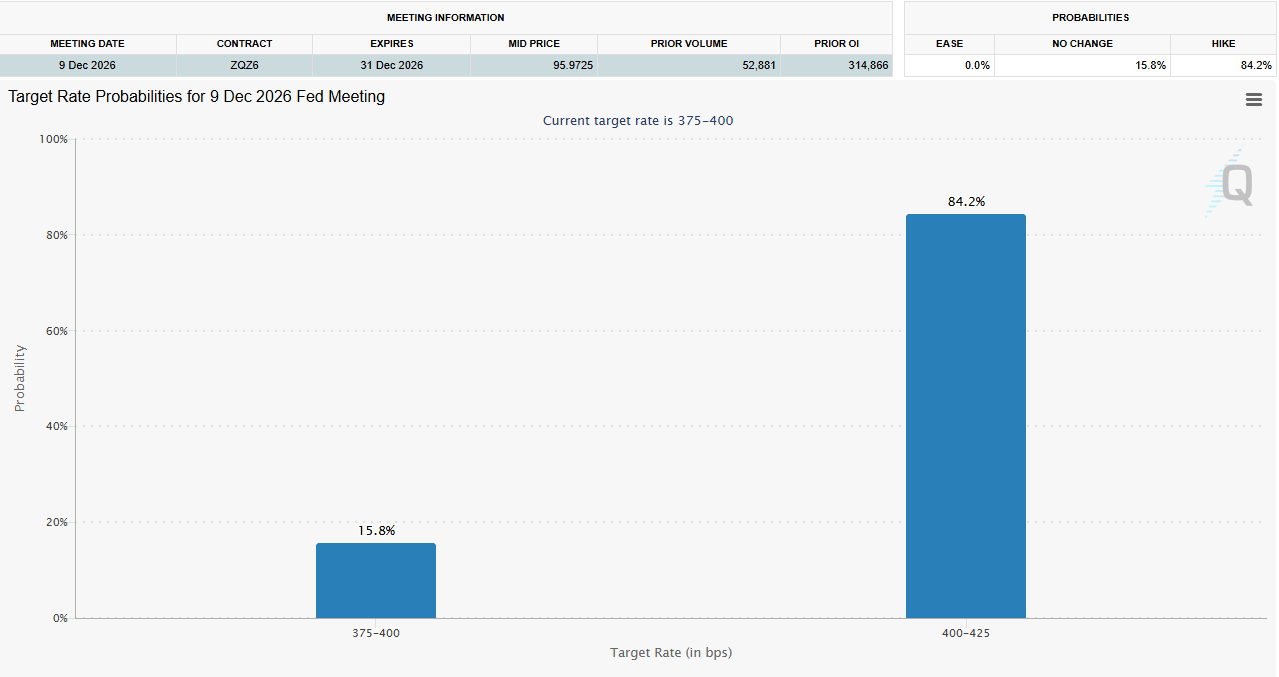
Last week’s stronger-than-expected US payrolls reinforced expectations that the Fed could keep interest rates higher for longer. According to the CME Group’s FedWatch Tool, traders are now pricing in over an 80% chance that the US central bank will raise borrowing costs again in December. This macroeconomic outlook has continued to support the US Dollar (USD) while weighing on risky assets such as BTC, though USD bulls are waiting for the US CPI report before placing fresh bets.
Tuesday’s inflation data will be watched for more cues on the Fed’s policy path. A hotter-than-expected reading could increase expectations of a rate hike, putting further pressure on risk assets.
Meanwhile, on the geopolitical front, mixed signals over US-Iran peace talks keep risk premium in play, dampening risk appetite. US President Donald Trump said that there is positive momentum towards ending the war on Iran, and that a resumption of strikes is quite unlikely, declaring the conflict effectively over.
However, Mohsen Rezaei, Secretary of Iran’s Supreme National Security Council, dismissed reports of active negotiations as fake news and reiterated that Washington must accept Tehran’s seven conditions to end the conflict. This keeps the geopolitical risk premium in play and supports the safe-haven USD, while continuing to weigh on BTC’s recovery prospects.
Institutional demand continues to weaken
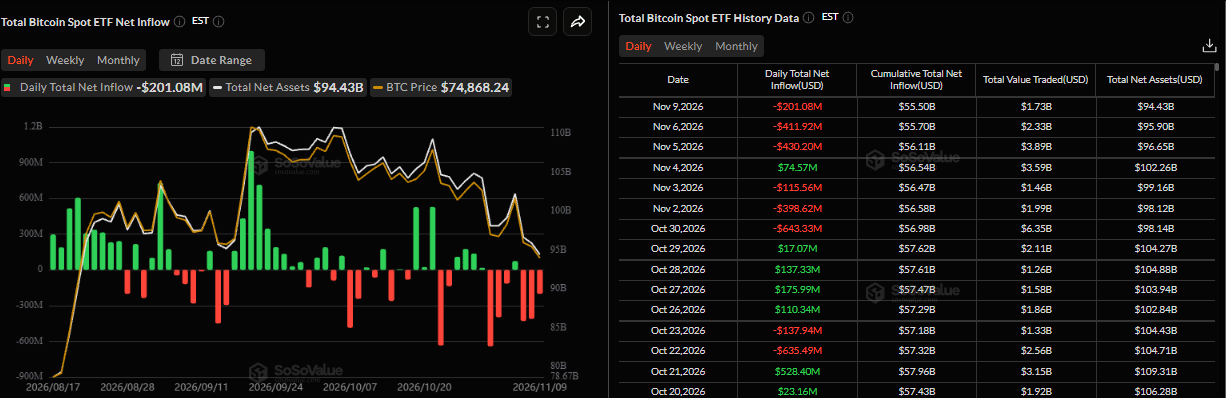
Institutional demand for Bitcoin started the week on a negative note. SoSoValue data shows BTC spot ETFs recorded net outflows of $201.08 million on Monday after $1.28 billion in outflows last week, the highest weekly withdrawal since the end of June. If this outflow trend continues and intensifies throughout this week, it could put additional pressure on BTC, pushing its price into a deeper correction.
On the corporate side, Michael Saylor announced on Monday that his firm, Strategy, acquired 1,036 BTC. The company currently holds 850,364 BTC and $4.9 billion in USD assets. These latest purchases suggest that corporate Bitcoin accumulation remains active, and such buying could provide some cushion if BTC prices continue to fall.
Bitcoin technical outlook: BTC trades below 200-day EMA
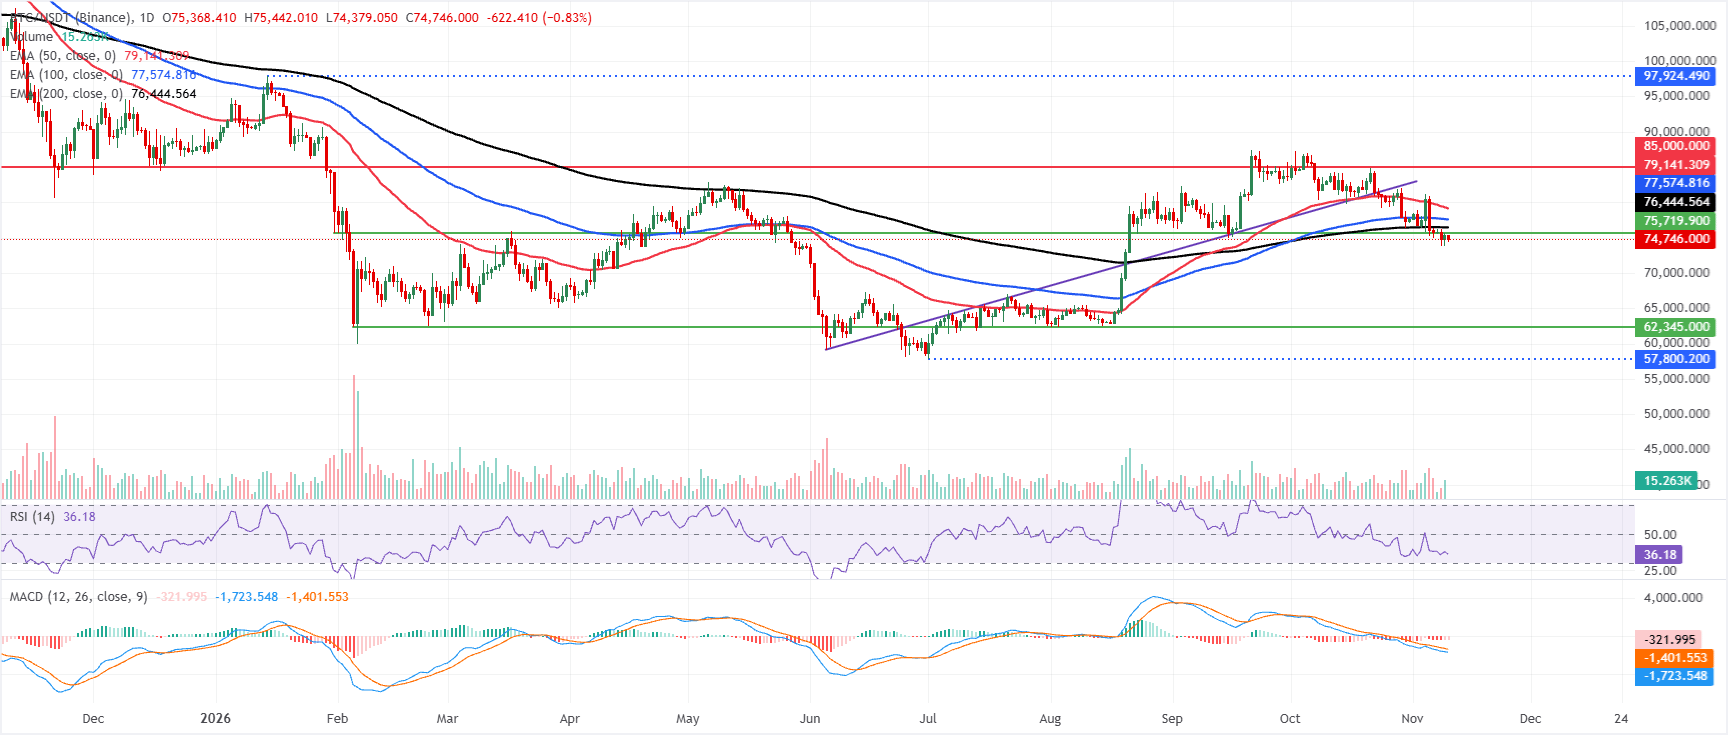
Bitcoin price trades at $74,746 on Tuesday, maintaining a bearish near-term bias as it holds beneath the major Exponential Moving Averages (EMAs). The 200-day EMA at around $76,444 is the first cap above spot, with the 100-day EMA near $77,574 and the 50-day EMA close to $79,141 reinforcing a stacked band of overhead supply.
The Relative Strength Index (RSI) hovers near 36, keeping momentum tilted to the downside, while the Moving Average Convergence Divergence (MACD) remains in negative territory, which suggests rallies are still likely to meet selling pressure into these clustered EMAs.
On the topside, immediate resistance is at the 200-day EMA around $76,444, followed by the 100-day EMA near $77,574 and then the 50-day EMA near $79,141, with a higher horizontal barrier at roughly $85,000.
On the downside, the lack of nearby mapped support suggests that any break below current levels would send BTC toward the psychological support zone around $70,000 before stabilizing.
(The technical analysis of this story was written with the help of an AI tool. Know more.)
Bitcoin, altcoins, stablecoins FAQs
Bitcoin is the largest cryptocurrency by market capitalization, a virtual currency designed to serve as money. This form of payment cannot be controlled by any one person, group, or entity, which eliminates the need for third-party participation during financial transactions.
Altcoins are any cryptocurrency apart from Bitcoin, but some also regard Ethereum as a non-altcoin because it is from these two cryptocurrencies that forking happens. If this is true, then Litecoin is the first altcoin, forked from the Bitcoin protocol and, therefore, an “improved” version of it.
Stablecoins are cryptocurrencies designed to have a stable price, with their value backed by a reserve of the asset it represents. To achieve this, the value of any one stablecoin is pegged to a commodity or financial instrument, such as the US Dollar (USD), with its supply regulated by an algorithm or demand. The main goal of stablecoins is to provide an on/off-ramp for investors willing to trade and invest in cryptocurrencies. Stablecoins also allow investors to store value since cryptocurrencies, in general, are subject to volatility.
Bitcoin dominance is the ratio of Bitcoin's market capitalization to the total market capitalization of all cryptocurrencies combined. It provides a clear picture of Bitcoin’s interest among investors. A high BTC dominance typically happens before and during a bull run, in which investors resort to investing in relatively stable and high market capitalization cryptocurrency like Bitcoin. A drop in BTC dominance usually means that investors are moving their capital and/or profits to altcoins in a quest for higher returns, which usually triggers an explosion of altcoin rallies.
Bài viết đề xuất


