


Bitcoin Weekly Forecast: Uptober or Rektober?
- Bitcoin trades around $82,500 on Friday, down over 4% this week as mounting losses put its bullish outlook at risk.
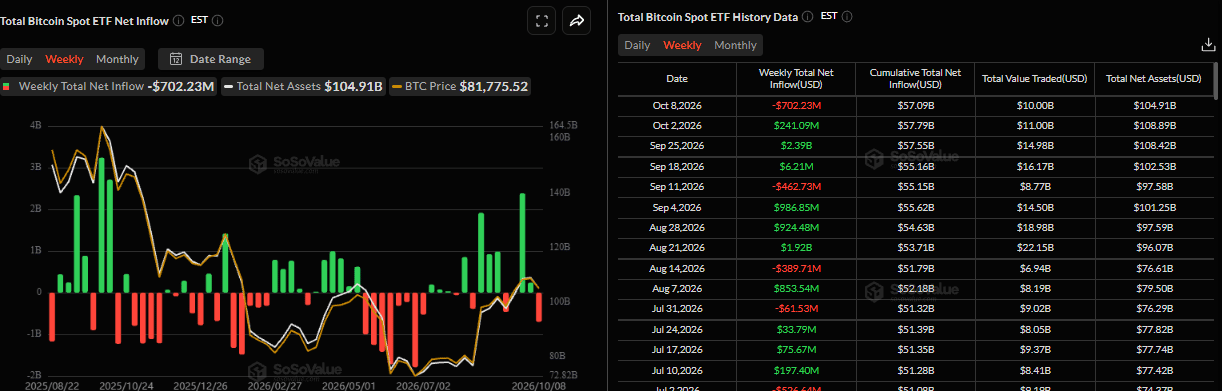
- US-listed BTC spot ETFs are on track to snap a three-week inflow streak, recording $702.23 million in net outflows through Thursday.
- Profit-taking, long liquidations, rising US Treasury yields and a stronger US Dollar weigh on BTC.
Bitcoin (BTC) price is down over 4% so far this week, trading below $83,000 at the time of writing on Friday as mounting selling pressure threatens to derail the seasonal “Uptober” rally.
Profit-taking, a surge in long liquidations and weakening demand from institutional investors are weighing on BTC. Meanwhile, rising US Treasury yields and a stronger US Dollar (USD) add to the headwinds, raising the risk of further downside for the Crypto King, with market sentiment turning “Rektober”.
Institutional demand cools down
Institutional demand for Bitcoin shows early signs of weakness so far this week. SoSoValue data show spot ETFs are on track to snap a three-week inflow streak, recording $702.23 million in net outflows through Thursday. If these withdrawals continue and intensify on Friday, BTC could see further correction.
On-chain activity also points to a cautious outlook. Lookonchain reported on X on Friday that US government-linked wallets deposited 17,733 BTC ($1.48 billion) and 50 WBTC ($62 million) into CoinbasePrime over the past three days, potentially increasing short-term selling pressure.
“During this period, the price of BTC dropped 6.9%,” Lookonchain noted.
In addition, long-dormant Bitcoin whales are becoming active. Another whale transferred 4,500 BTC on Thursday after more than four years of inactivity. If these funds are moved to an exchange, it could signal potential selling pressure and weigh further on BTC’s price.
Rising liquidations and profit-taking activity threaten BTC
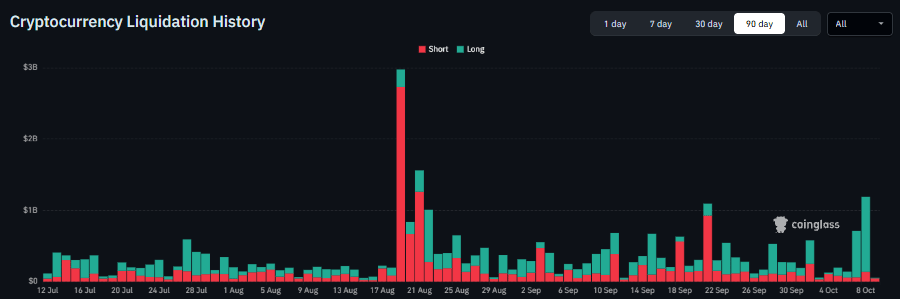
The cryptocurrency market faced a sharp pullback mid-week, with BTC falling nearly $2,000 in 20 minutes as $400 million in levered longs were liquidated in under one hour, according to The Kobeissi Letter X post.
The Coinglass cryptocurrency liquidation history chart below shows liquidations surged on Wednesday and Thursday, with long positions being the most wiped out, indicating overly bullish positioning and leaving leveraged traders vulnerable to further downside. Moreover, Thursday’s liquidations were the highest since August 21.
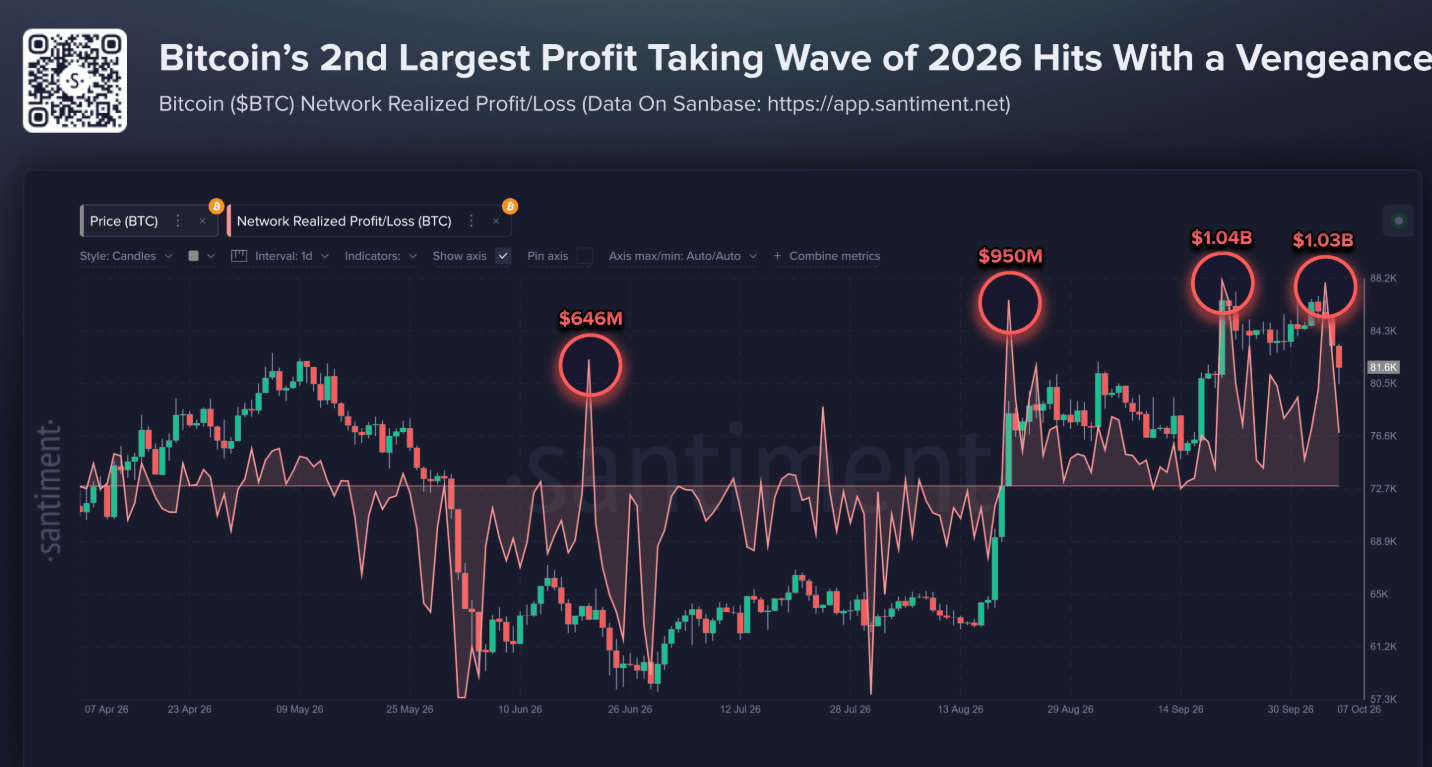
In addition, the decline in Crypto King’s price may also be attributed to elevated profit-taking this week, reaching the second-highest realized profit day, with over $1.03 billion in profits, narrowly below the year’s $1.04 billion peak.
Hawkish Fed and soaring yields cap BTC bulls
On the macroeconomics front, a stronger US Dollar and soaring 10-year US Treasury yields further cap the upside momentum for the Crypto King.
The US Dollar Index (DXY) reached an intraday high of $102.53 on Monday, levels not seen since early April 2025, and stabilized around $102.10 on Friday. Similarly, the 10-year US Treasury yield rose and posted a fresh two-decade high this week, now holding strong around 5.20%. These higher yields make traditional fixed-income assets more attractive than risky assets.
Moreover, the Federal Open Market Committee (FOMC) Minutes from the September 15-16 meeting revealed that the committee voted unanimously to raise the federal funds rate target range. Most officials expect that another rate increase would likely be appropriate by year-end to combat persistent inflation, further supporting US bond yields and the USD, which caps the Crypto King.
Elevated geopolitical tensions dampen risk appetite
On the geopolitical front, the Pentagon reportedly told US Central Command (CENTCOM) several days ago to conclude preparations for resuming major combat operations in Iran as US President Donald Trump weighs a specific date for launching strikes.
The US and Israeli sources said that US attacks could happen before America’s midterm elections and possibly the Israeli elections due a week earlier. However, Trump said on Thursday that the US would refrain from resuming military strikes against Iran before the midterm elections, adding that Washington was engaged in productive discussions with Tehran.
These developments indicate ongoing uncertainty and mixed signals, dampening risk appetite and weighing on risk-sensitive assets such as BTC.
Bitcoin technical outlook: Faces rejection from key level
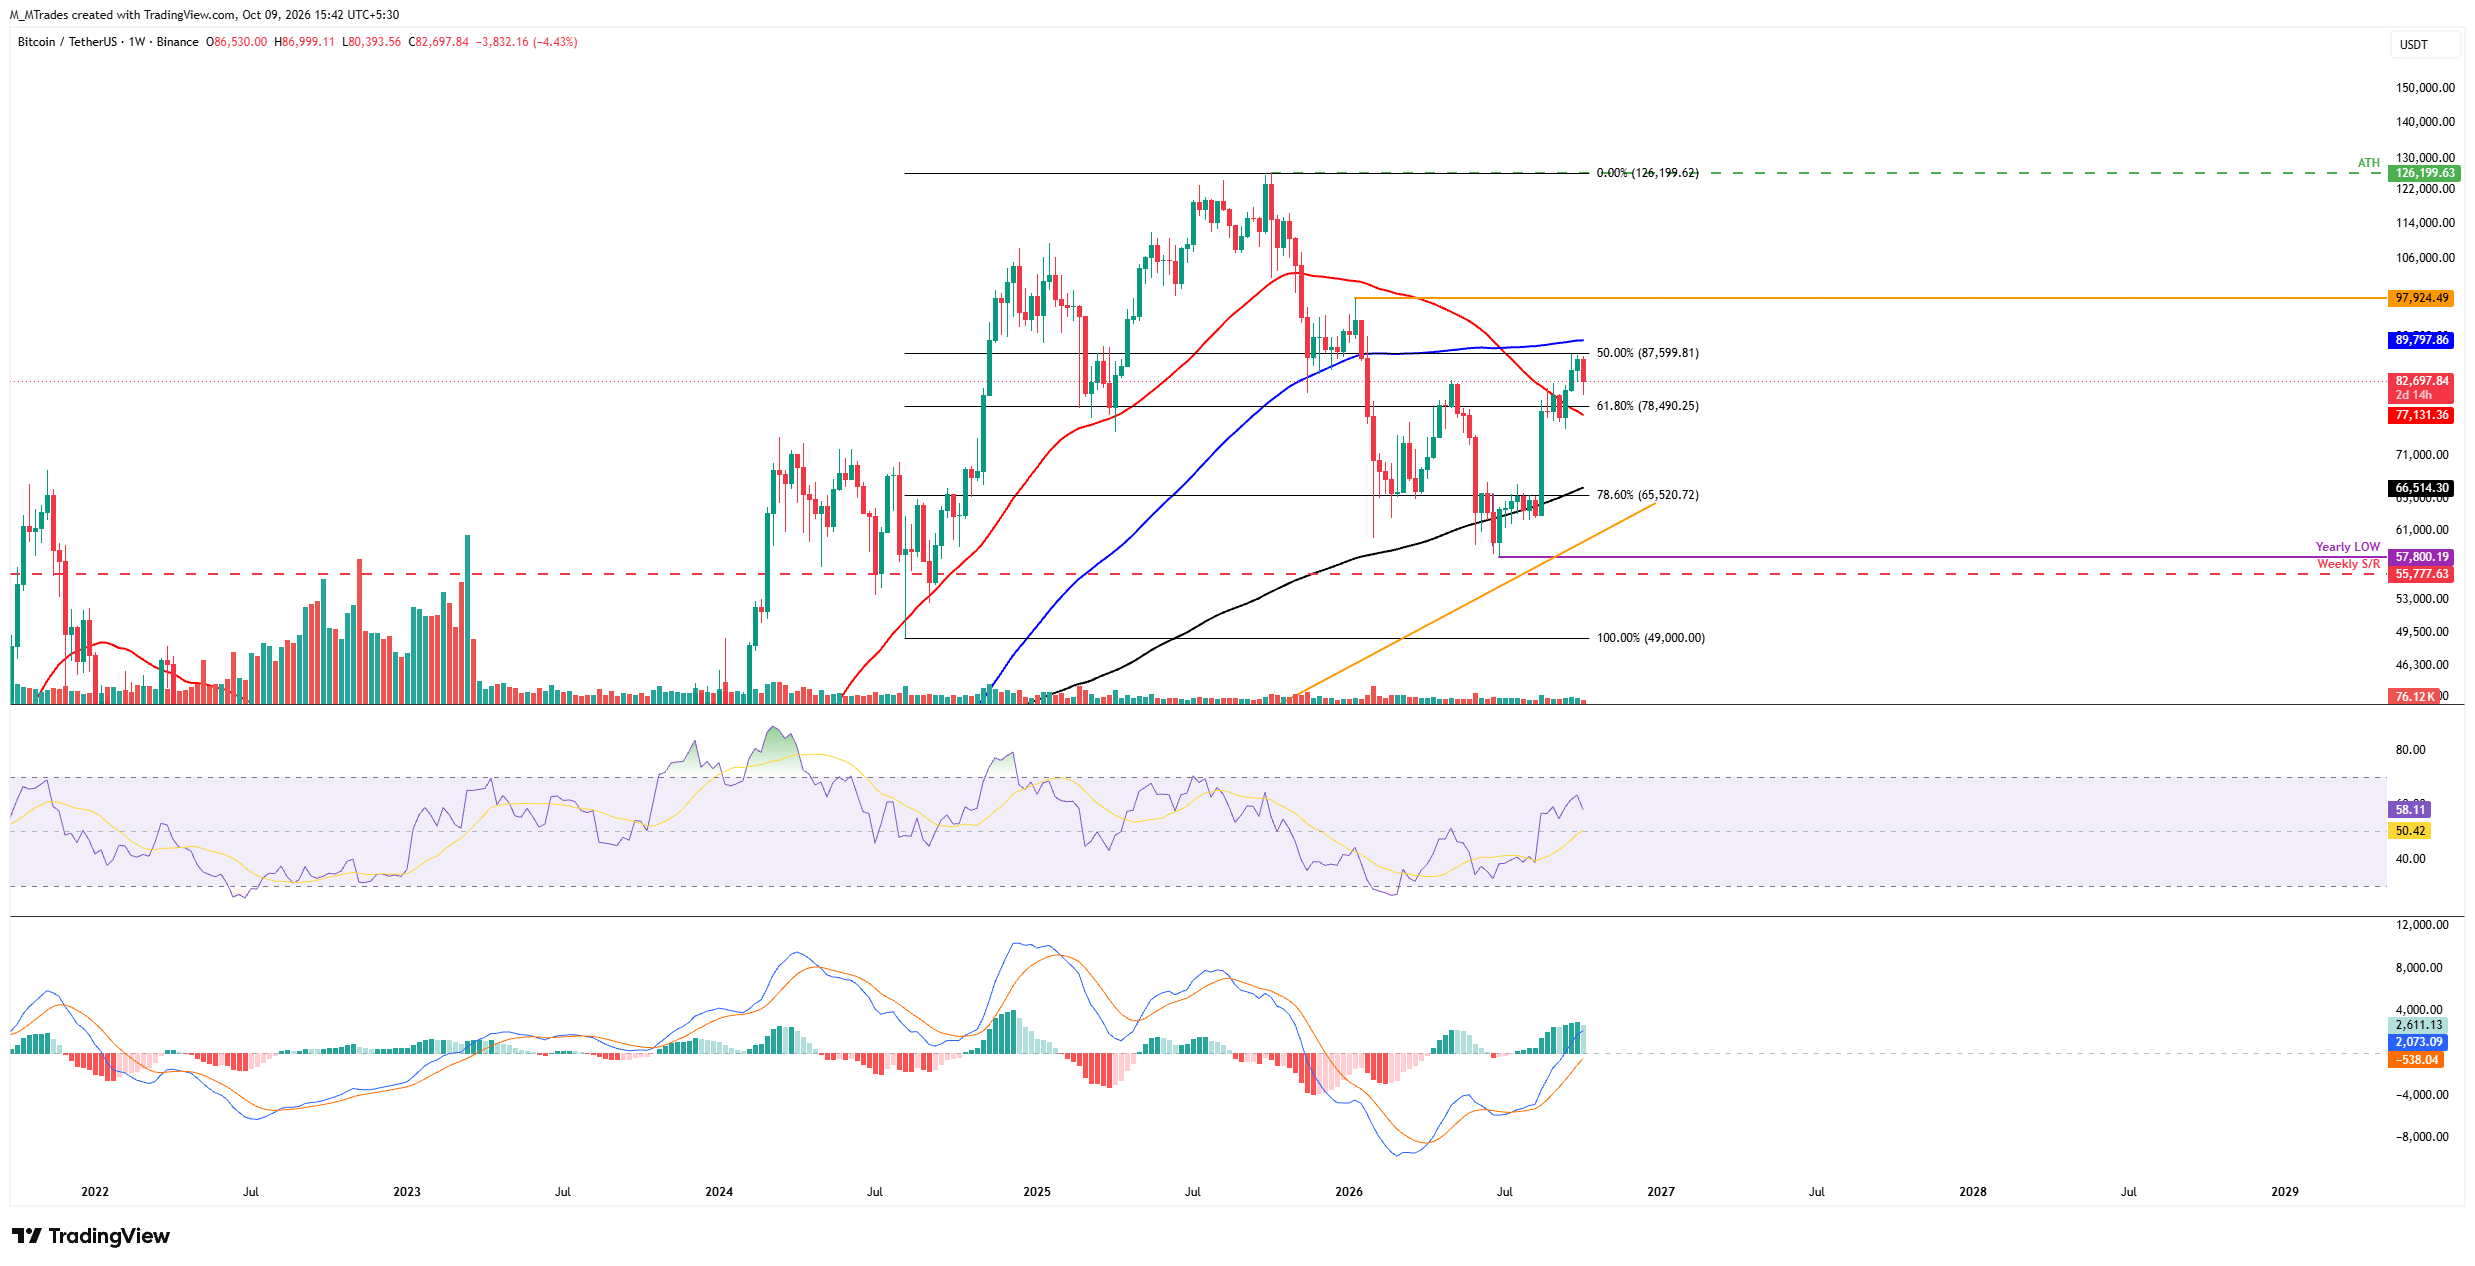
The Crypto King faced rejection at the 50% retracement level of $87,599 (drawn from the August 2024 low of $49,000 to the October 2025 record high of $126,199), correcting over 4% so far this week, and trading around $82,600 on Friday.
If BTC continues its correction, it could extend the losses toward the 61.8% Fibonacci retracement level of $78,490, which roughly coincides with the 50-week Simple Moving Average (SMA) at $77,131.
The Relative Strength Index (RSI) on the weekly chart around 58 shows mildly positive momentum without reaching overbought conditions. At the same time, the Moving Average Convergence Divergence (MACD) histogram remains firmly in positive territory, hinting that upside pressure persists despite nearby resistance and ongoing pullback.
If BTC recovers, it could extend the advance toward $87,599, then the 100-week SMA at $89,797.
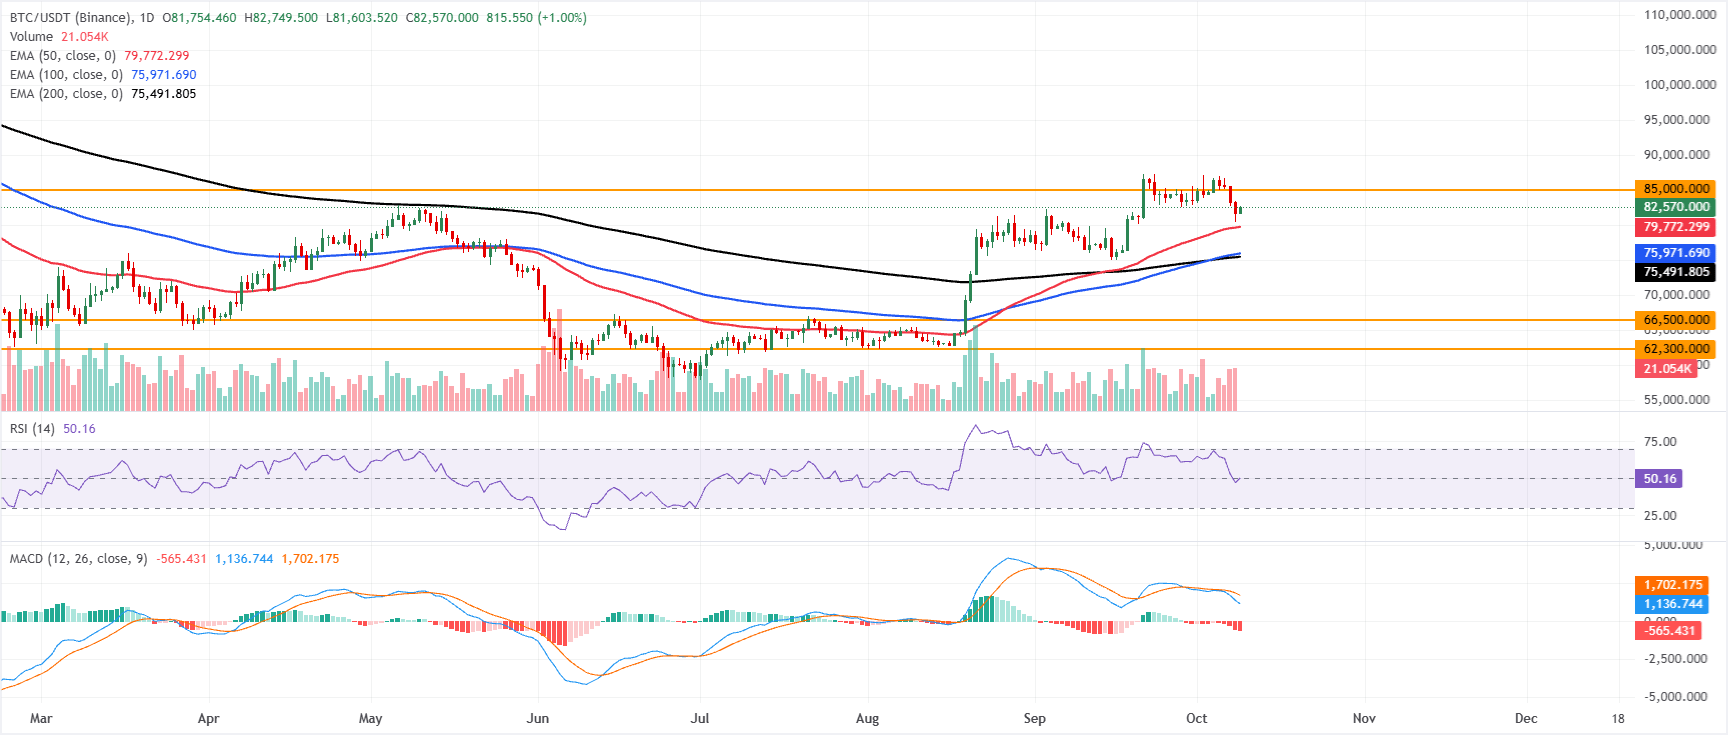
Despite this correction, BTC holds a mild constructive bias on the daily chart, as it remains above the 50-day, 100-day, and 200-day Exponential Moving Averages (EMAs), clustered between roughly $75,500 and $79,800.
However, momentum has cooled, with the daily RSI slipping back toward the neutral 50 area and the Moving Average Convergence Divergence (MACD) histogram entrenched below zero, suggesting upside may be slowing even as the broader trend stays supported.
On the downside, initial support is seen at the 50-day EMA near $79,772, followed by the 100-day EMA at $75,971 and the 200-day EMA at $75,491. These levels collectively reinforce the underlying bullish structure ahead of deeper supports at $66,500 and $62,300.
On the topside, the next key hurdle is the horizontal resistance at $85,000; a sustained break above this barrier would open the way for a fresh extension of the uptrend, while failure to clear it could leave BTC consolidating above the EMA cluster.
(The technical analysis of this story was written with the help of an AI tool. Know more.)
Bitcoin, altcoins, stablecoins FAQs
Bitcoin is the largest cryptocurrency by market capitalization, a virtual currency designed to serve as money. This form of payment cannot be controlled by any one person, group, or entity, which eliminates the need for third-party participation during financial transactions.
Altcoins are any cryptocurrency apart from Bitcoin, but some also regard Ethereum as a non-altcoin because it is from these two cryptocurrencies that forking happens. If this is true, then Litecoin is the first altcoin, forked from the Bitcoin protocol and, therefore, an “improved” version of it.
Stablecoins are cryptocurrencies designed to have a stable price, with their value backed by a reserve of the asset it represents. To achieve this, the value of any one stablecoin is pegged to a commodity or financial instrument, such as the US Dollar (USD), with its supply regulated by an algorithm or demand. The main goal of stablecoins is to provide an on/off-ramp for investors willing to trade and invest in cryptocurrencies. Stablecoins also allow investors to store value since cryptocurrencies, in general, are subject to volatility.
Bitcoin dominance is the ratio of Bitcoin's market capitalization to the total market capitalization of all cryptocurrencies combined. It provides a clear picture of Bitcoin’s interest among investors. A high BTC dominance typically happens before and during a bull run, in which investors resort to investing in relatively stable and high market capitalization cryptocurrency like Bitcoin. A drop in BTC dominance usually means that investors are moving their capital and/or profits to altcoins in a quest for higher returns, which usually triggers an explosion of altcoin rallies.
Bài viết đề xuất


