


Crypto Today: Bitcoin, Ethereum, XRP post modest gains ahead of Fed rate decision
- Bitcoin struggles to extend its rebound above $64,000 amid persistent ETF outflows ahead of the Fed rate decision.
- Ethereum remains broadly stable, holding above $1,900 as ETFs record the second consecutive day of inflows.
- XRP is poised to challenge the $1.10 pivotal resistance despite a relatively weak technical structure and muted ETF activity.
Cryptocurrency prices are broadly stable on Wednesday ahead of the Federal Reserve (Fed) interest rate decision. Bitcoin (BTC) holds above $64,000 but is struggling to sustain its rebound while Ethereum (ETH) sits above the short-term $1,900 support. Meanwhile, Ripple (XRP) is approaching the pivotal $1.10 resistance, a level that could shape the token’s upward trajectory if it is breached.
Focus shifts to Fed as crypto market stabilizes
Crypto market participants are stuck in risk-averse mode ahead of the Fed interest rate decision. The Federal Open Market Committee (FOMC) is widely expected to leave interest rates unchanged in the 3.50%-3.75% range. However, the CME FedWatch tool shows that investors are pricing in a 30% chance of a 25-basis-point (bps) hike.
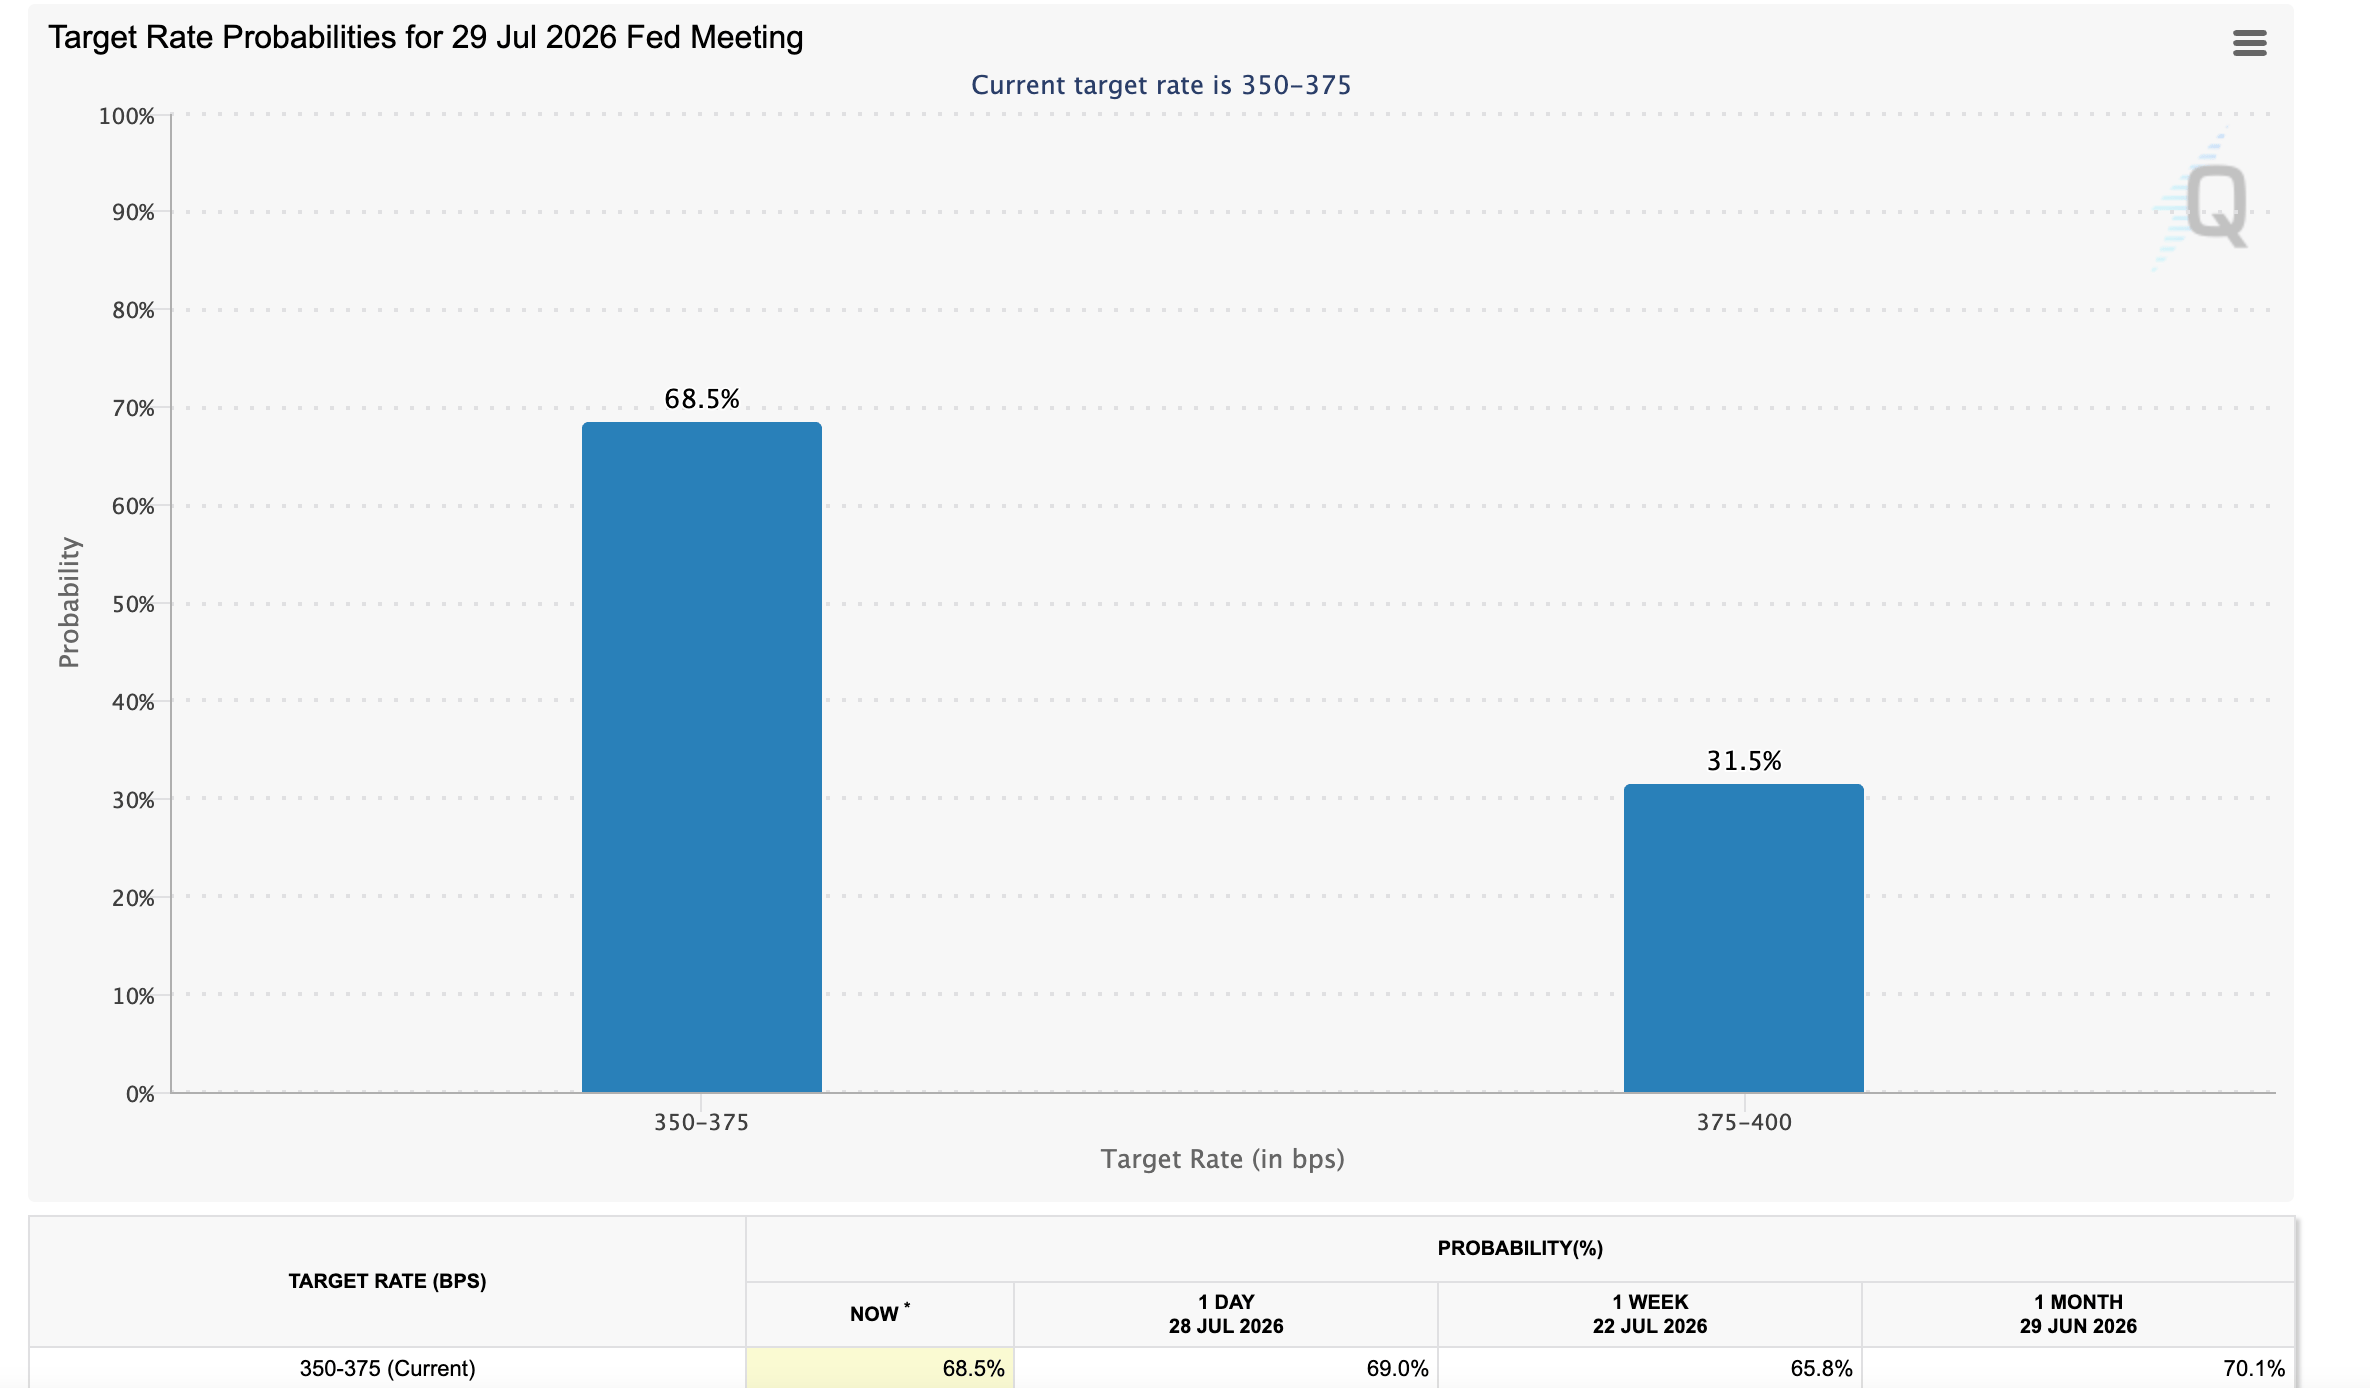
Focus is expected on Fed Chair Kevin Warsh's post-meeting press conference, where investors will look for insights into the central bank’s policy direction, including future monetary review cycles.
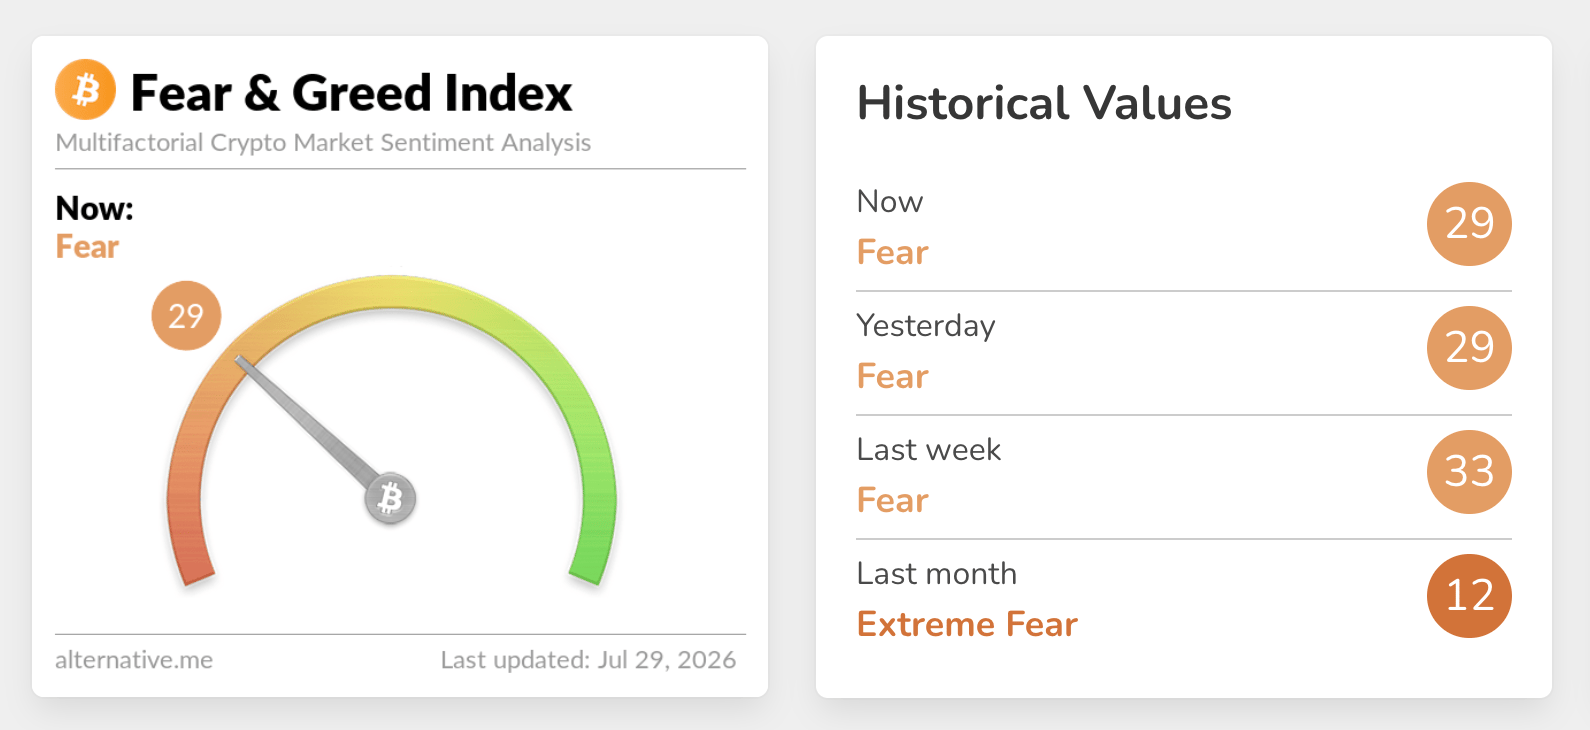
Crypto market sentiment remains largely unresponsive and in the Fear territory, as reflected in the Fear & Greed Index. The index, which broadly tracks investor behavior, holds steady at 29. This prevailing market condition continues to weigh on risk assets.
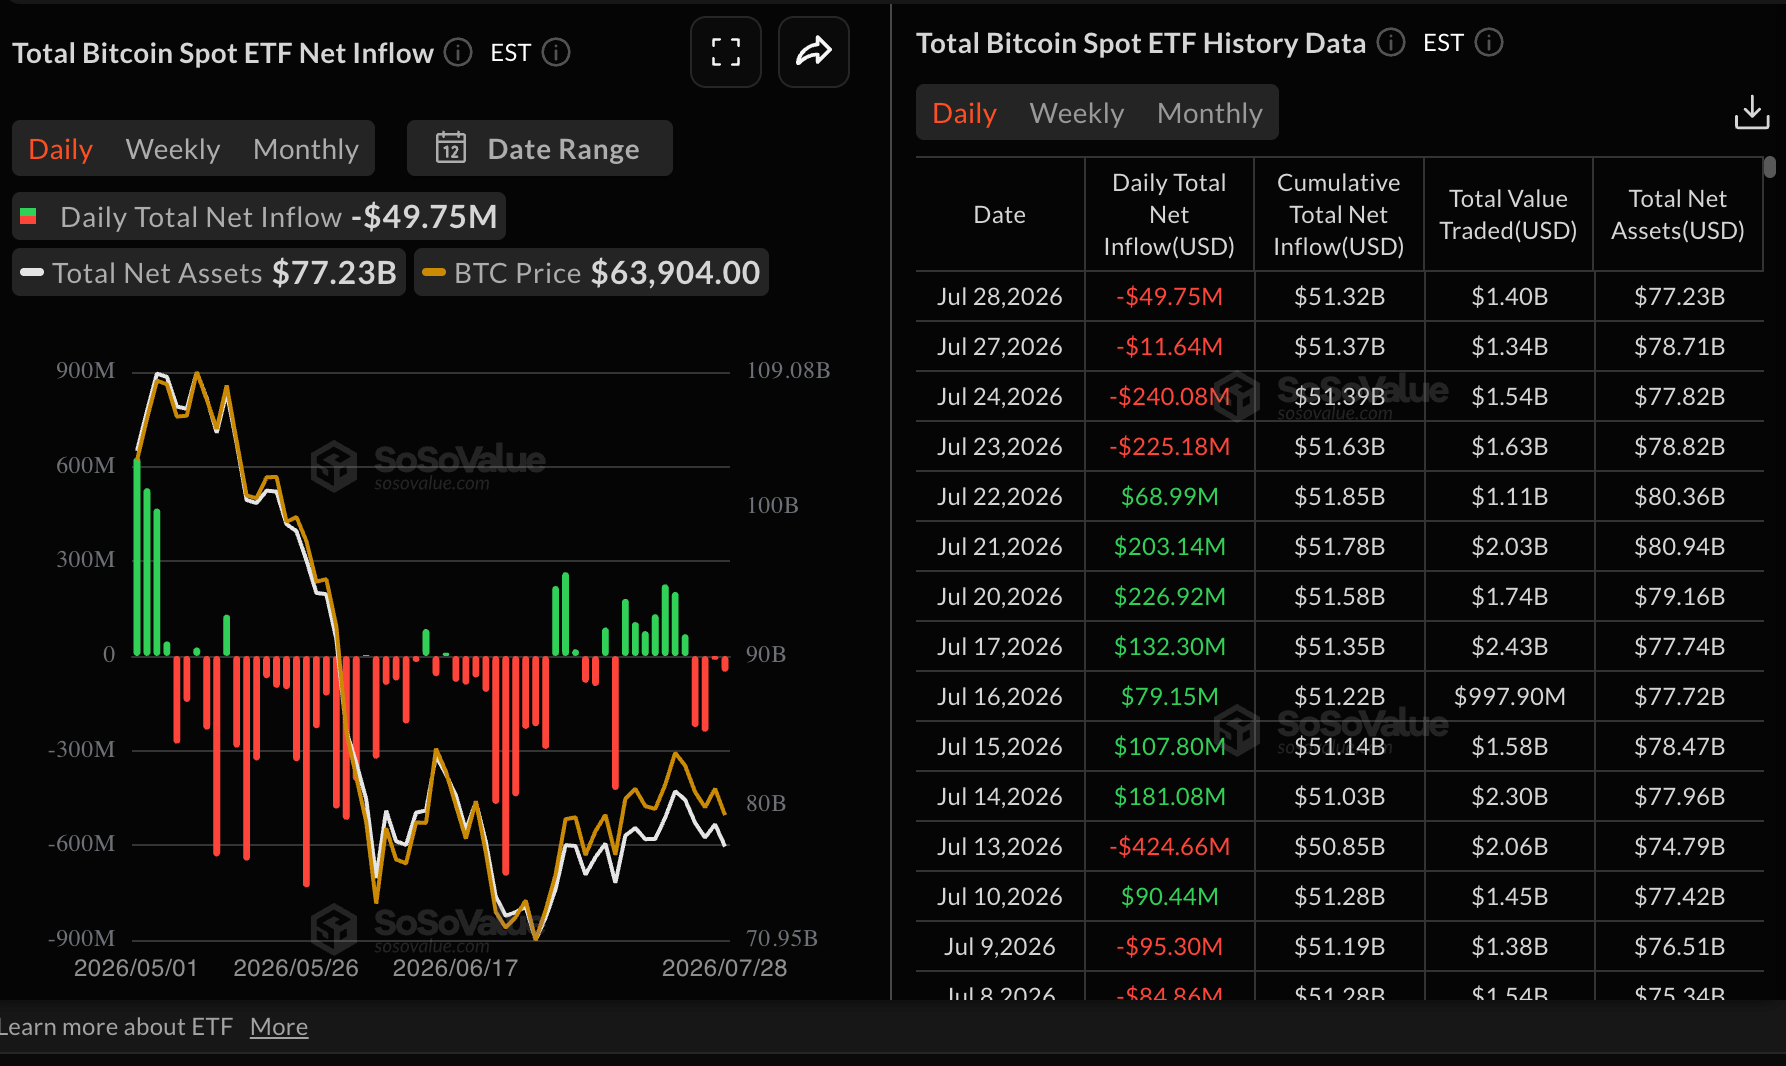
Bitcoin spot Exchange-Traded Funds (ETFs) extended the bearish streak for a fourth consecutive day, with outflows approaching $50 million on Tuesday. According to SoSoValue data, institutional withdrawals amount to $61 million through Tuesday this week, undermining risk exposure.
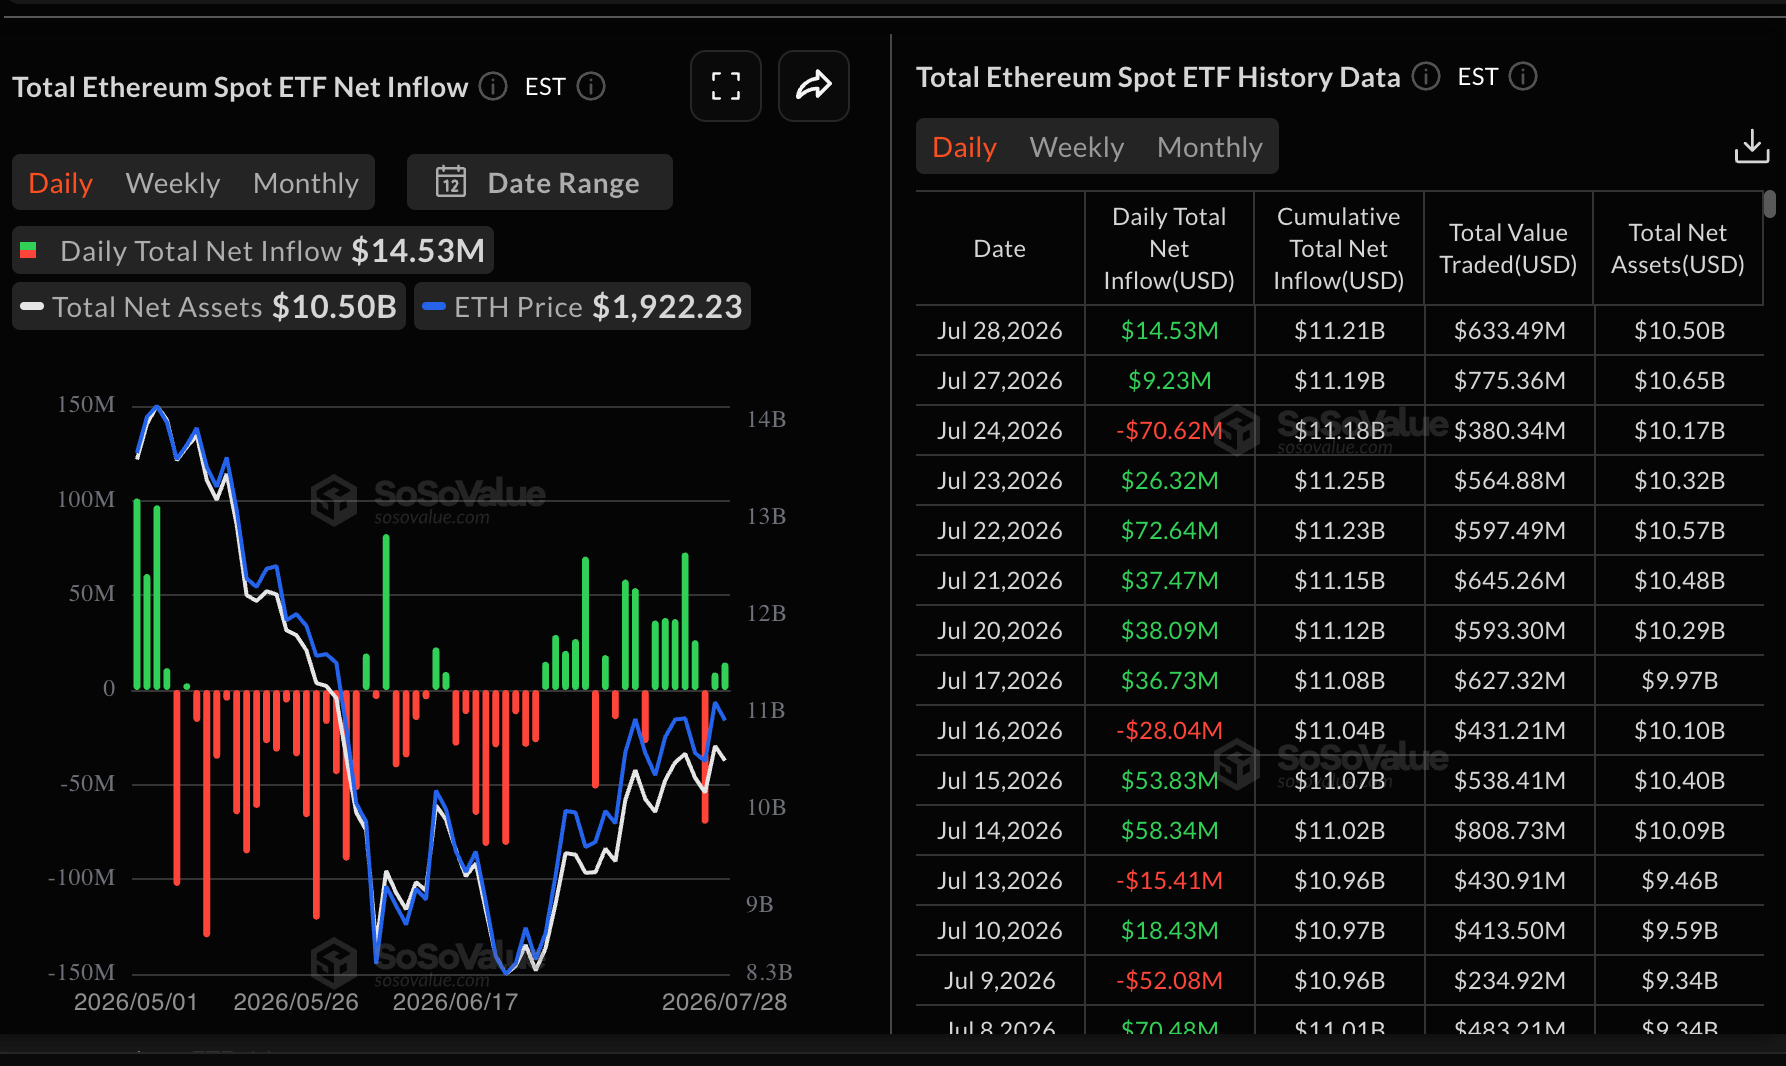
Ethereum spot ETFs continued to outpace Bitcoin, with inflows reaching roughly $15 million on Tuesday, up from $9 million on Monday. Cumulative inflows stand at $11.21 billion, while net assets average $10.5 billion.
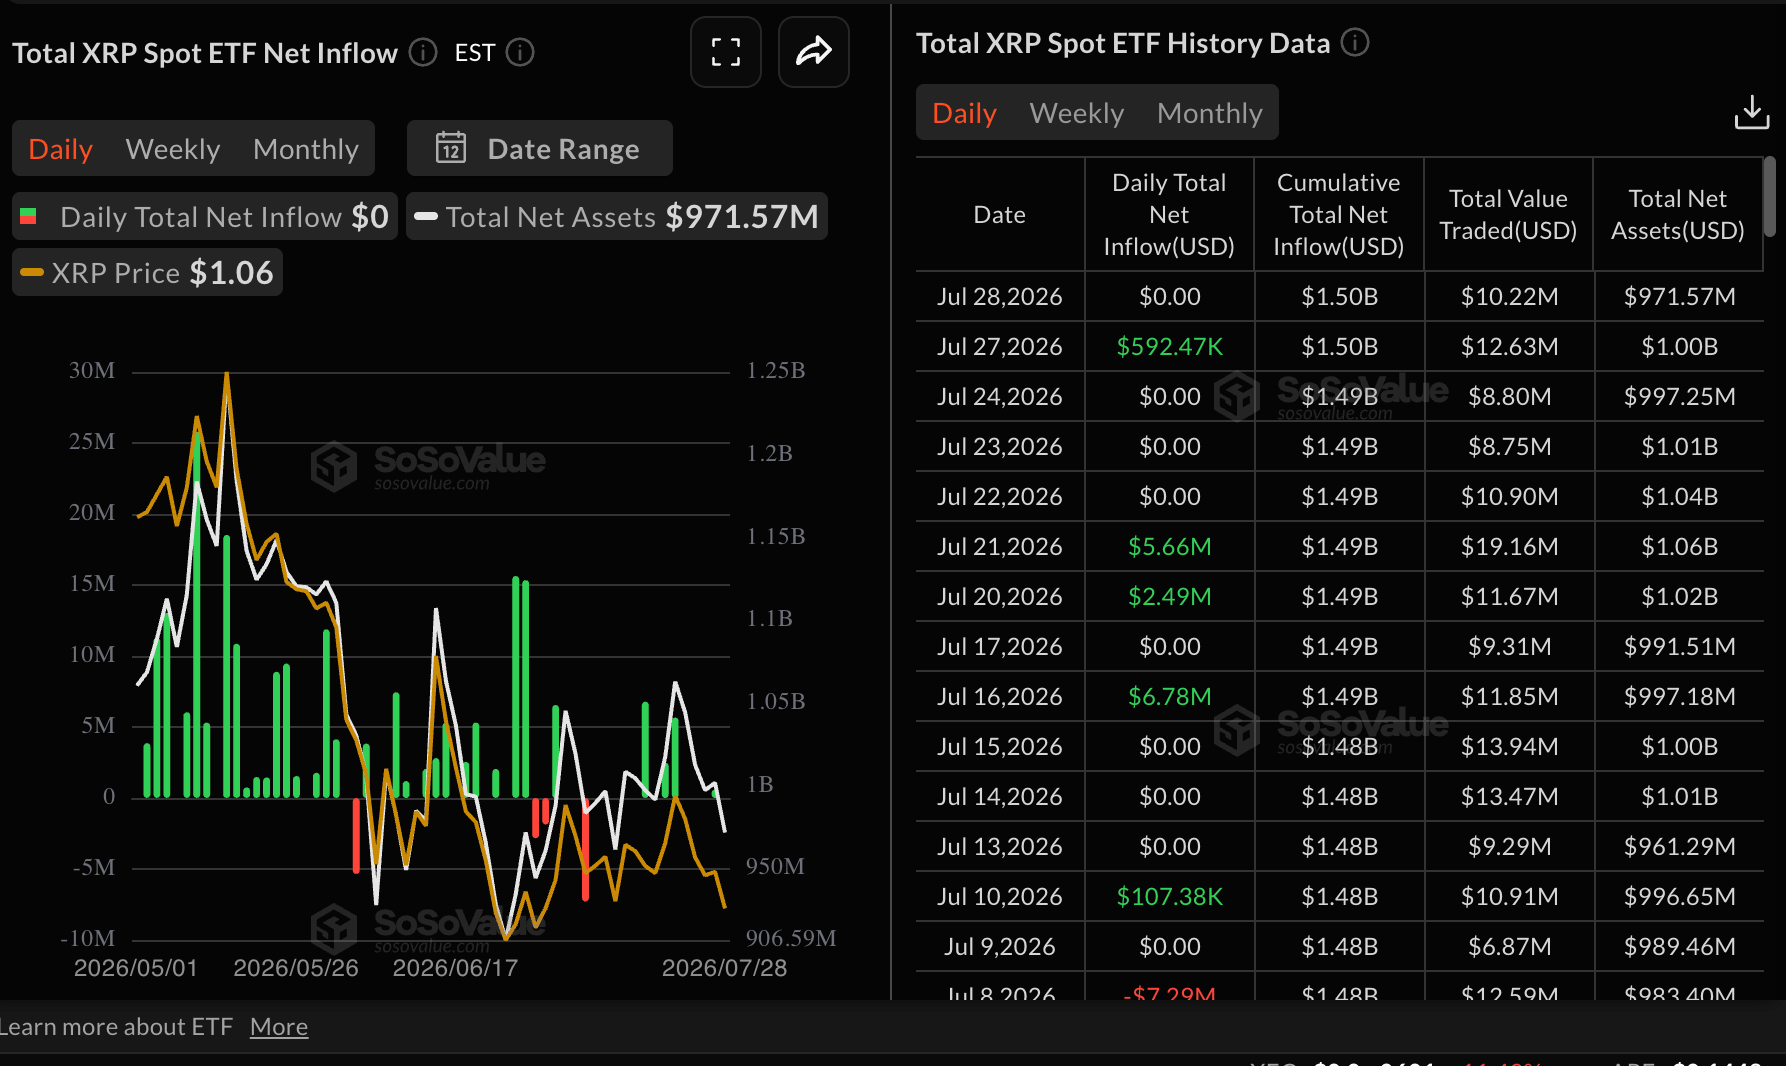
As for XRP spot ETFs, flows rolled back with activity staying neutral on Tuesday following very mild inflows of $592,000 the day before. Cumulative inflows are steady at $1.50 billion, with net assets under management averaging $972 million, according to SoSoValue.
Technical outlook: Bitcoin reclaims short-term support
Bitcoin trades above $64,000, keeping a mildly bearish near-term tone as it holds above the SuperTrend support at $61,034, but remains capped by a dense band of moving averages. The pair sits below the 50-day Exponential Moving Average (EMA) at $64,963 as well as the 100-day and 200-day EMAs at $67,593 and $73,159 respectively. This outlook suggests rallies are still occurring within a broader corrective phase.
At the same time, a flat Relative Strength Index (RSI) around 50 on the daily chart and a negative Moving Average Convergence Divergence (MACD) reading hint at lacklustre upside momentum.
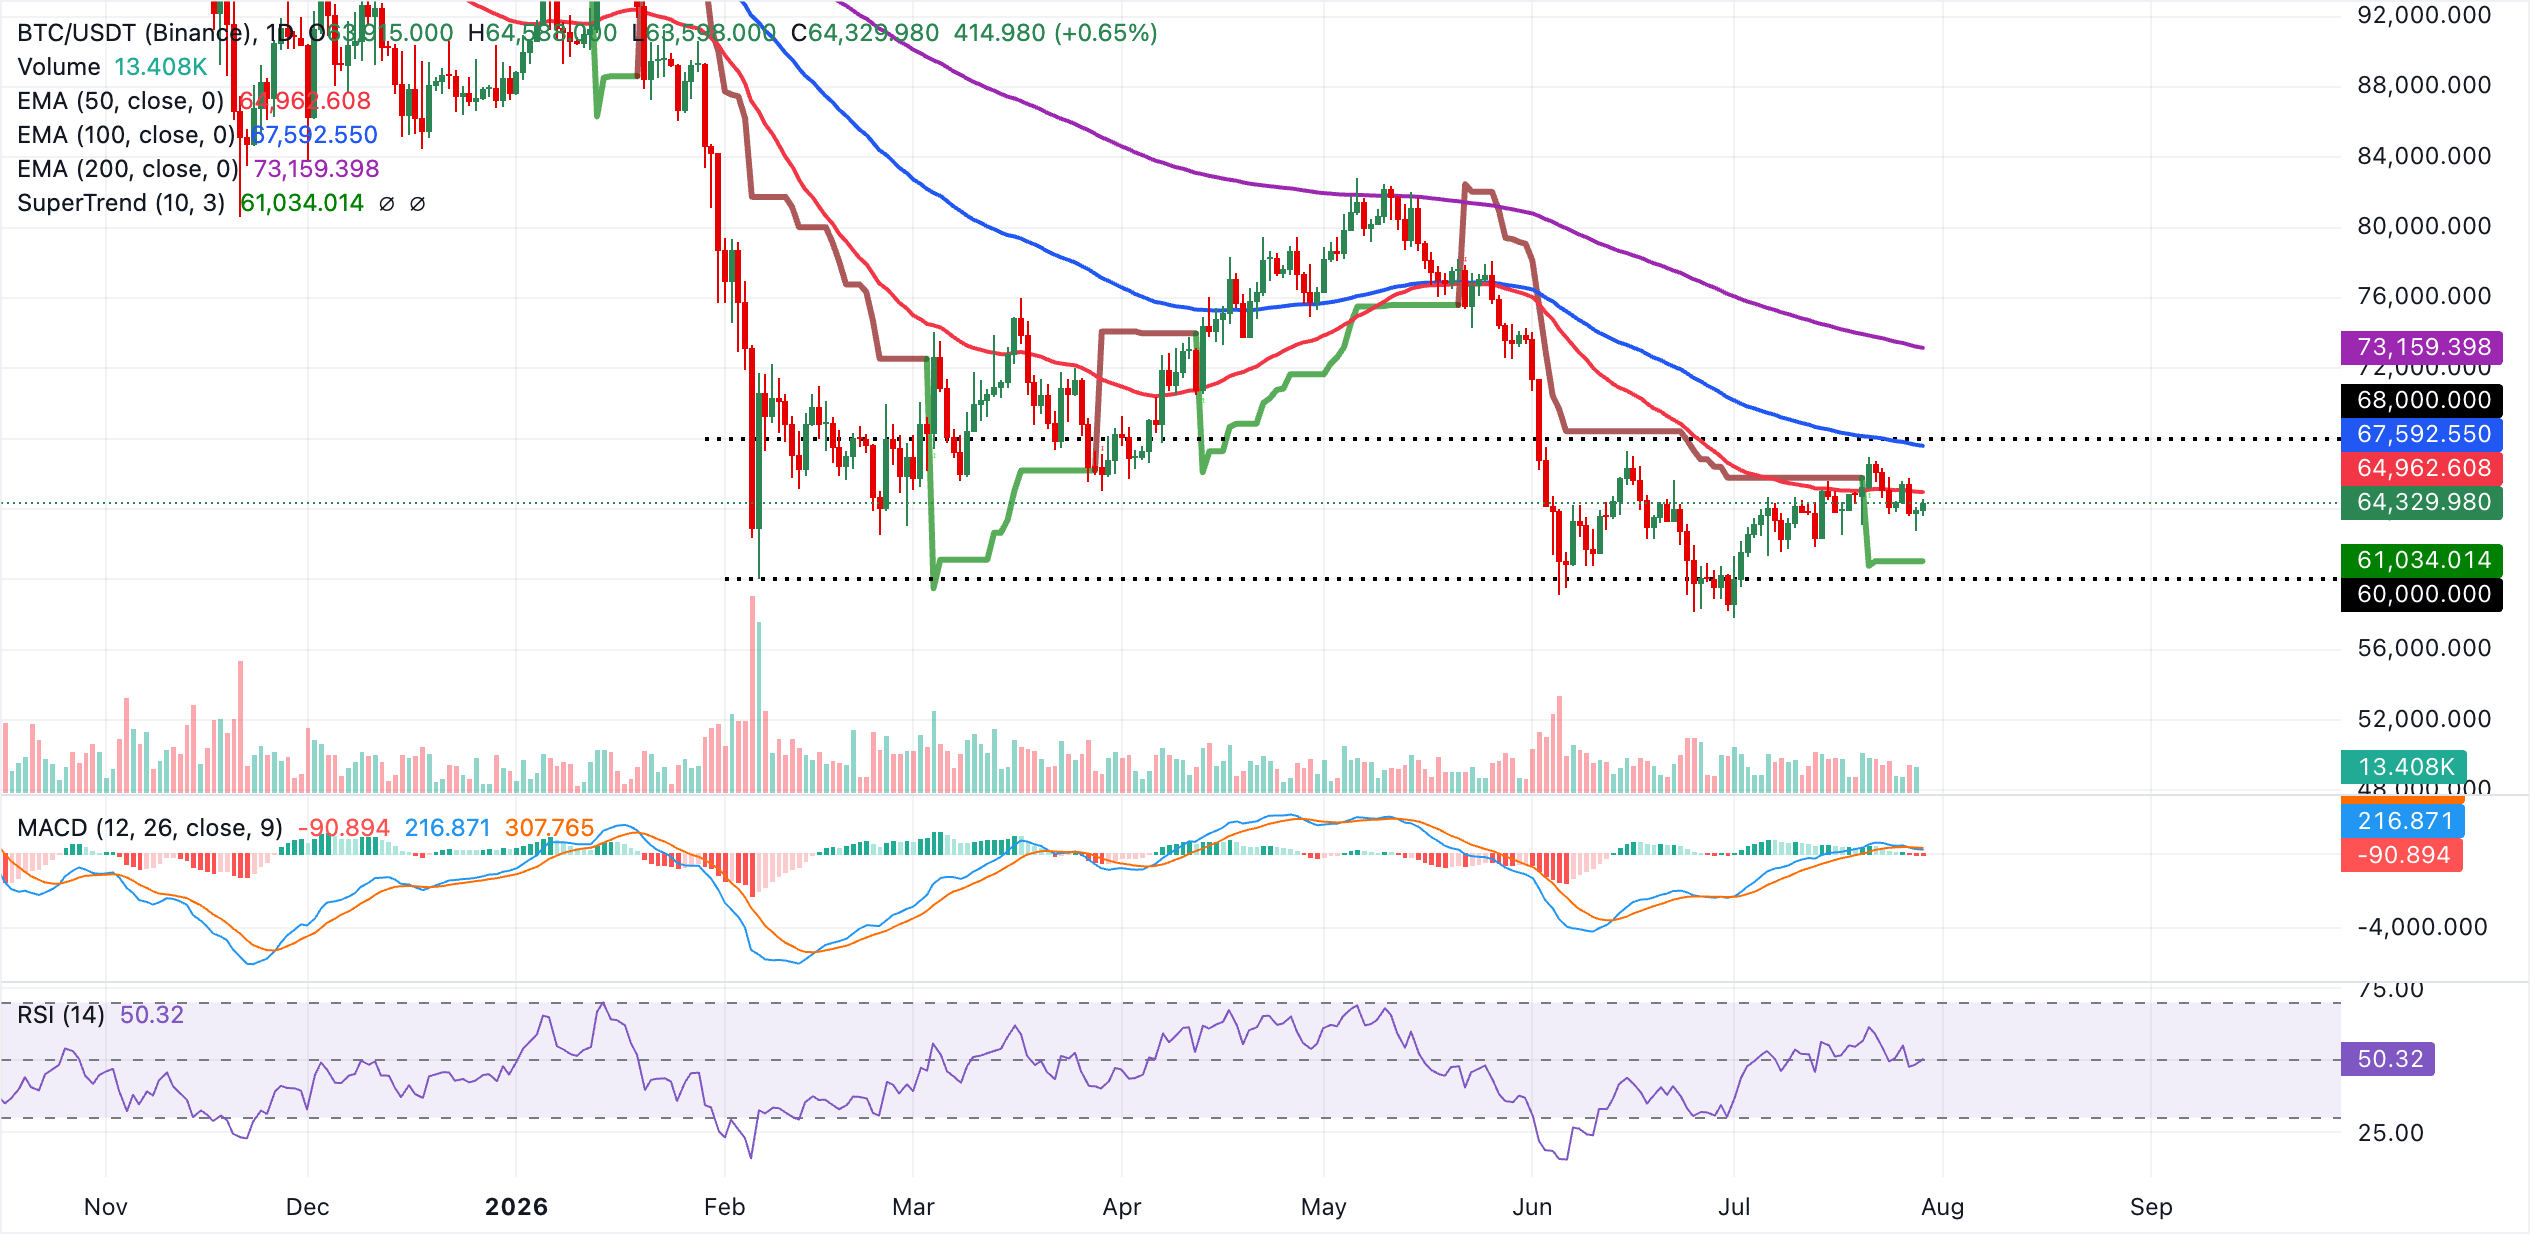
Immediate resistance lies at the 50-day EMA near $64,963, followed by the 100-day EMA around $67,593 and the 200-day EMA close to $73,159, levels that would need to be reclaimed to ease the current downside bias and reopen a sustained advance. On the downside, initial support is provided by the daily SuperTrend line at $61,034, where a break would likely expose lower levels and signal a deeper retracement within the broader range.
Altcoins technical outlook: Ethereum and XRP upside capped
Ethereum trades at $1,915, holding a neutral-to-bullish tone as it stays above the short-term 50-day EMA at roughly $1,846 and the SuperTrend support near $1,741, while still operating below the medium and long-term 100-day and 200-day EMAs at about $1,933 and $2,169, respectively.
The RSI around 57 on the daily chart hints at mildly positive momentum, but the MACD line hovering just below zero with a flat profile suggests that upside traction is not yet decisive.
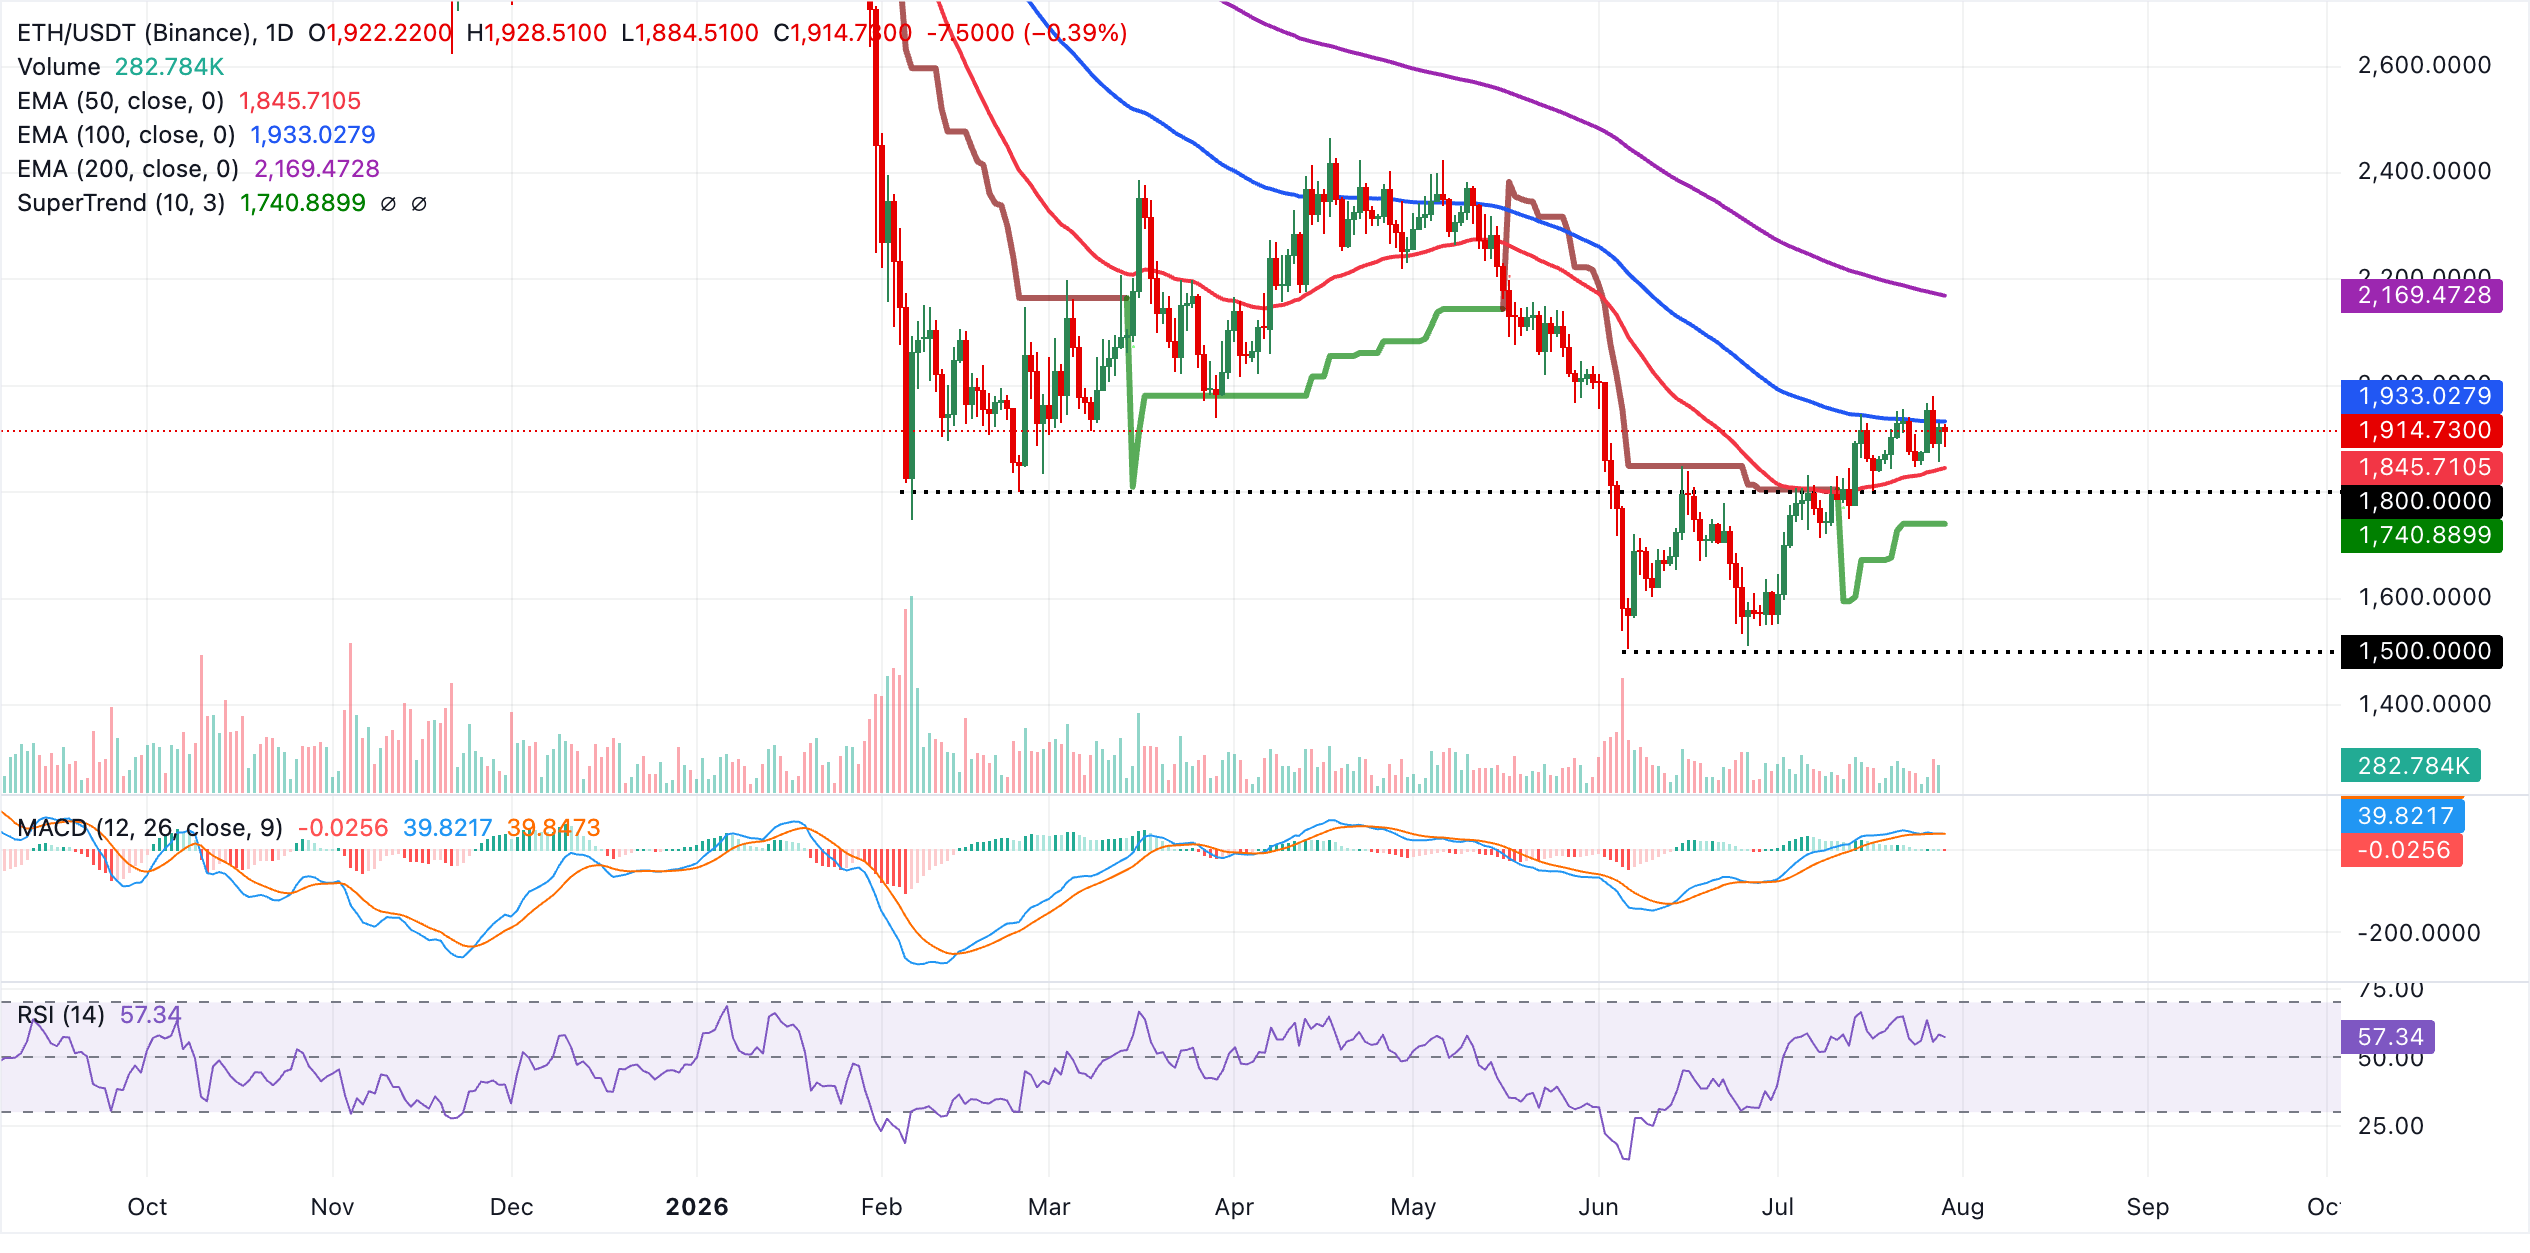
On the topside, initial resistance emerges at the 100-day EMA near $1,933, with a more substantial barrier at the 200-day EMA around $2,169, a reclaim of which would be needed to reinforce a sustained bullish continuation. Immediate support is seen at the 50-day EMA around $1,846, ahead of the SuperTrend line clustered near $1,741. A break below these levels would expose ETH to a deeper corrective phase within the broader range.
XRP, on the other hand, edges higher at $1.08. Still, the token retains a bearish near‑term tone as price holds below a stack of moving averages and the active SuperTrend line. The RSI, hovering around 47 on the daily chart and a slightly negative MACD reading hint that recovery attempts lack strong momentum.
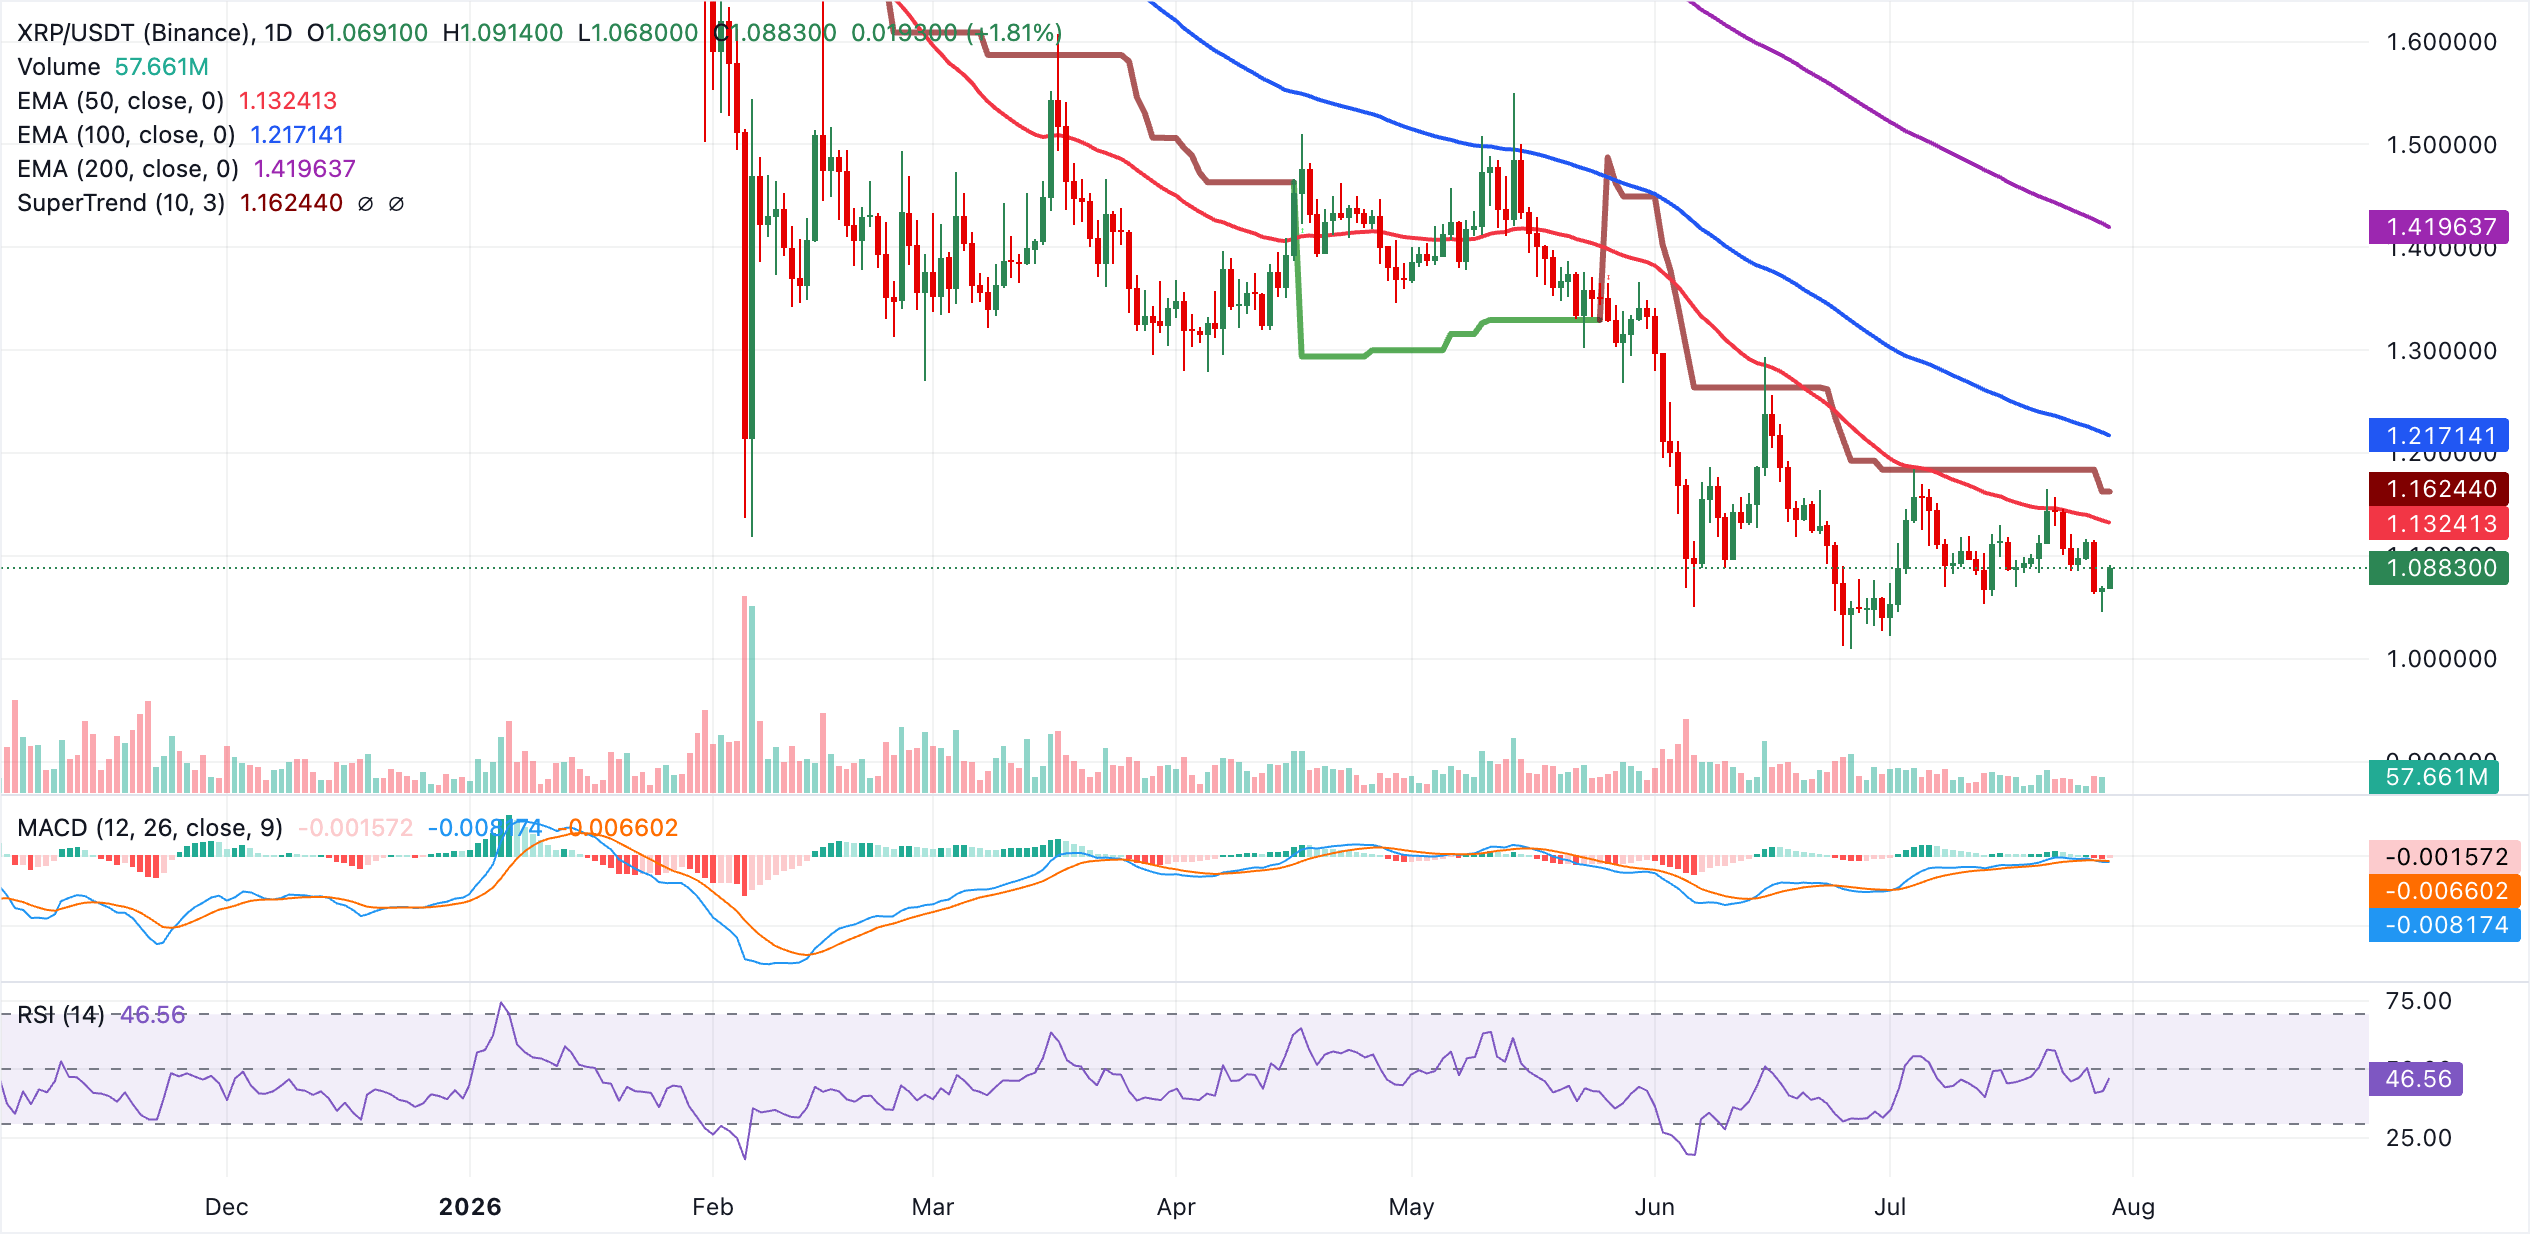
Immediate resistance is seen at the 50-day EMA near $1.13, with further barriers at the SuperTrend line around $1.16 and then the 100-day EMA close to $1.22. A daily close above these clustered levels would start to ease the prevailing downward pressure. Beyond that, the 200-day EMA near $1.42 stands as a more distant structural cap. On the downside, investors may need to rely on former horizontal support levels such as $1.05 and $1.00 to gauge whether to reengage.
(The technical analysis of this story was written with the help of an AI tool. Know more.)
Crypto ETF FAQs
An Exchange-Traded Fund (ETF) is an investment vehicle or an index that tracks the price of an underlying asset. ETFs can not only track a single asset, but a group of assets and sectors. For example, a Bitcoin ETF tracks Bitcoin’s price. ETF is a tool used by investors to gain exposure to a certain asset.
Yes. The first Bitcoin futures ETF in the US was approved by the US Securities & Exchange Commission in October 2021. A total of seven Bitcoin futures ETFs have been approved, with more than 20 still waiting for the regulator’s permission. The SEC says that the cryptocurrency industry is new and subject to manipulation, which is why it has been delaying crypto-related futures ETFs for the last few years.
Yes. The SEC approved in January 2024 the listing and trading of several Bitcoin spot Exchange-Traded Funds, opening the door to institutional capital and mainstream investors to trade the main crypto currency. The decision was hailed by the industry as a game changer.
The main advantage of crypto ETFs is the possibility of gaining exposure to a cryptocurrency without ownership, reducing the risk and cost of holding the asset. Other pros are a lower learning curve and higher security for investors since ETFs take charge of securing the underlying asset holdings. As for the main drawbacks, the main one is that as an investor you can’t have direct ownership of the asset, or, as they say in crypto, “not your keys, not your coins.” Other disadvantages are higher costs associated with holding crypto since ETFs charge fees for active management. Finally, even though investing in ETFs reduces the risk of holding an asset, price swings in the underlying cryptocurrency are likely to be reflected in the investment vehicle too.
Bài viết đề xuất


