


Solana Price Forecast: SOL rally pauses as bulls face resistance at 100-day EMA
- Solana faces rejection around the 100-day EMA at $81.63 on Monday after surging over 14% in the previous week.
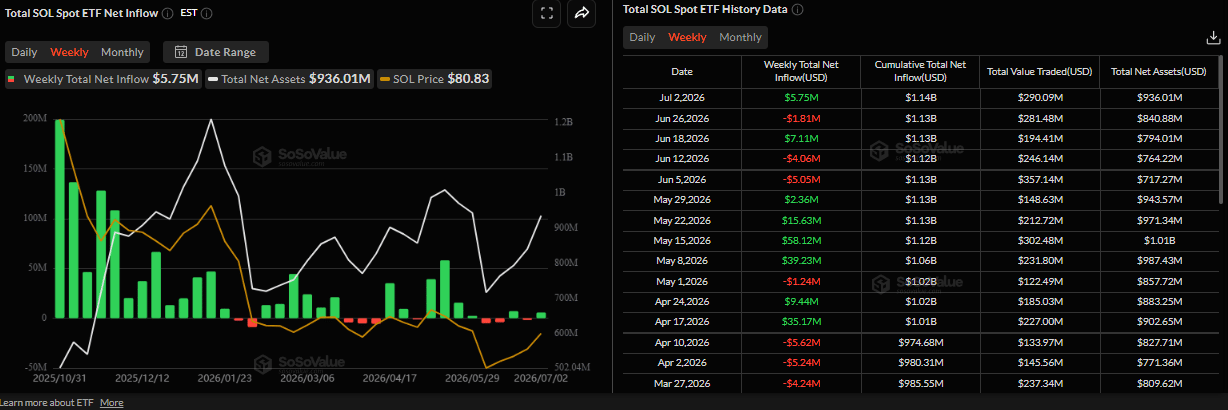
- US-listed spot SOL ETFs recorded an inflow of $5.75 million in the previous week, signaling improving institutional demand.
- Improving derivatives metrics, rising on-chain activity, and strengthening technical outlook suggest bulls remain firmly in control despite the short-term pullback.
Solana (SOL) is trading slightly lower on Monday after rallying more than 14% last week, with the 100-day Exponential Moving Average (EMA) at $81.63 capping potential upside. Despite a slight pullback, improving derivatives positioning, steady inflows into US-listed spot Solana Exchange-Traded Funds (ETFs), and rising on-chain activity indicate that bullish momentum remains intact, keeping the door open for further gains.
Early signs of institutional demand
Institutional demand shows early signs of optimism. SoSoValue data show that spot ETFs recorded an inflow of $5.75 million in the previous week, following an outflow of $1.81 million. If this inflow continues and intensifies this week, SOL price could see further gains.
On-chain activity shows a bullis bias
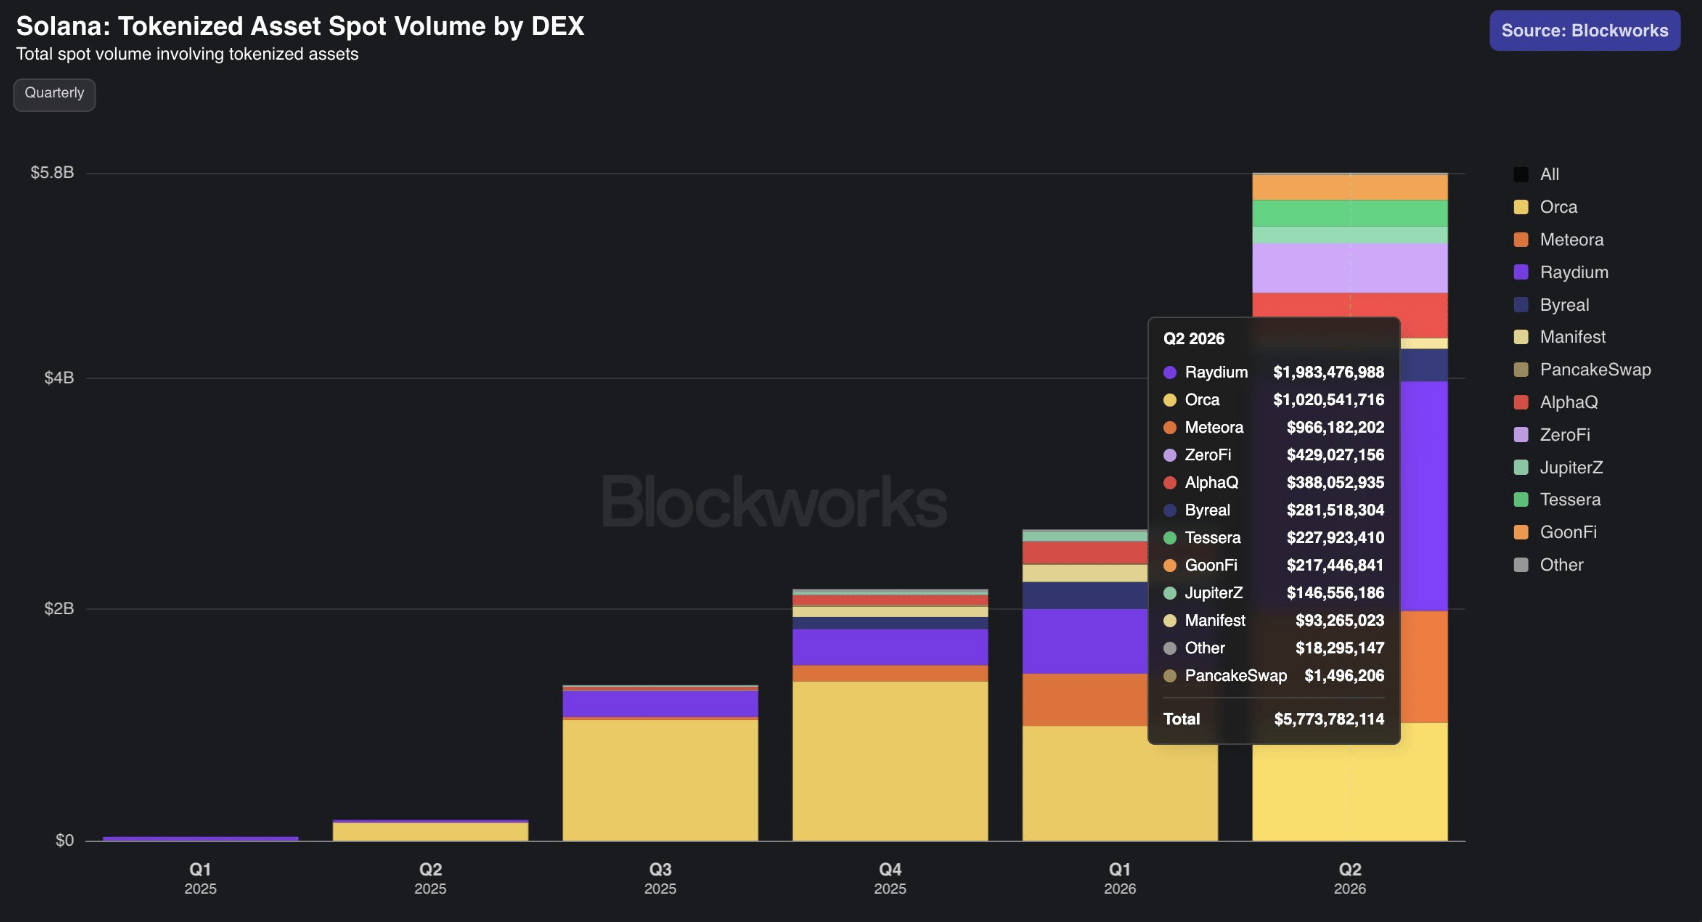
Solana’s official X account posted on Monday that tokenized-asset spot volume surged to $5.7 billion in Q2, up from $2.69 billion in Q1. This rise indicates that Solana network expansion, growing institutional adoption and strengthening on-chain demand suggest a bullish outlook.
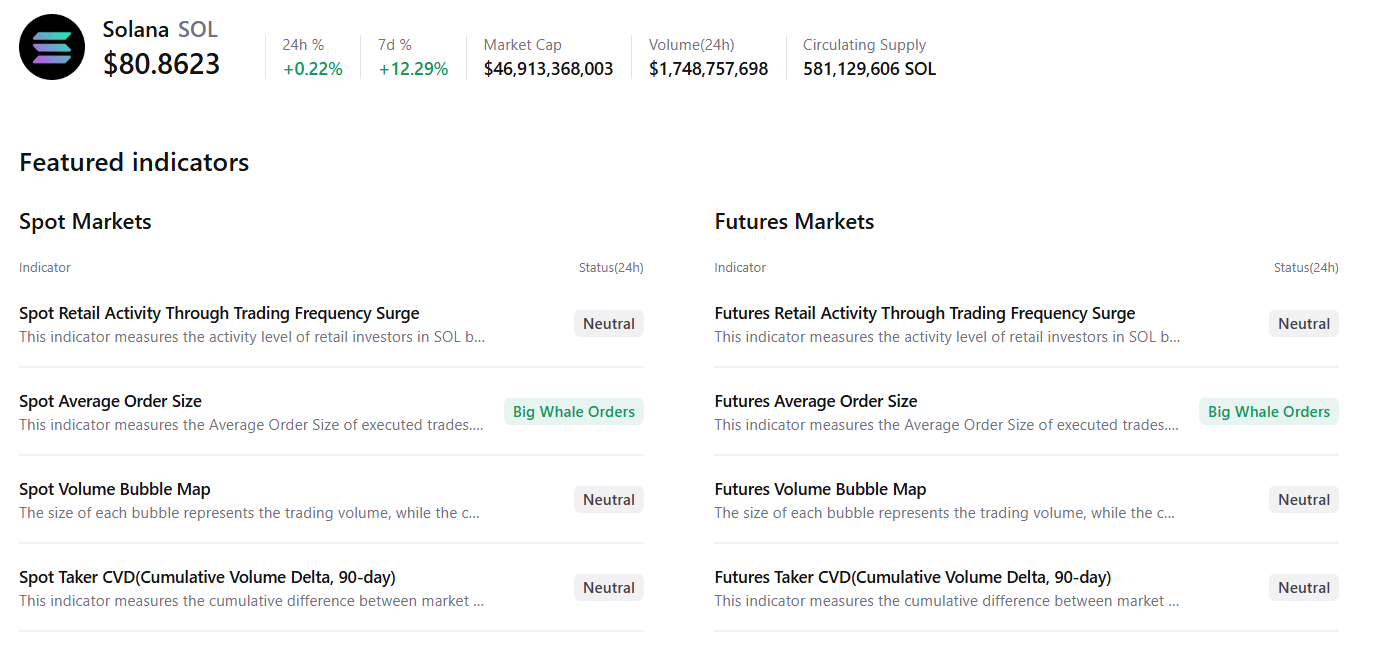
CryptoQuant’s summary data shows mild bullish sentiment. Solana’s spot and futures markets show large whale orders amid neutral conditions across other metrics, supporting a potential upside.
Improving derivatives metrics
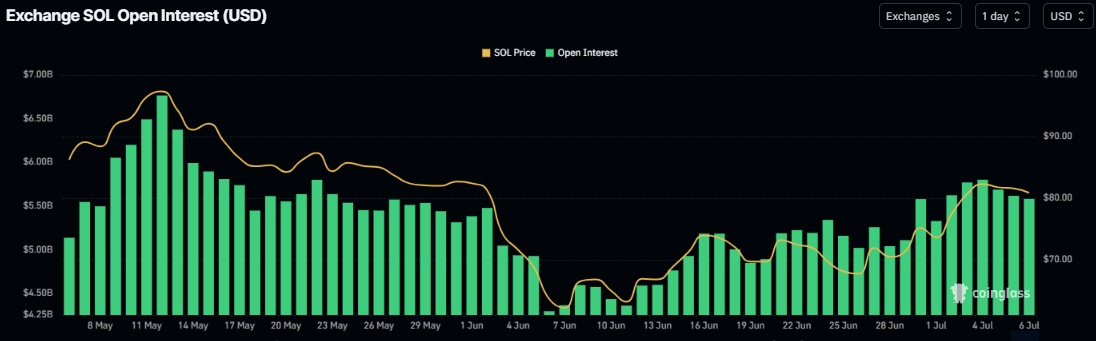
The derivatives metrics support a positive outlook. Solana’s futures Open Interest (OI) surged to $5.80 billion on Saturday, the highest level since mid-May and steadied around $5.58 billion on Monday. This rise in OI reflects increasing investor participation and projects a bullish outlook.
In addition, CoinGlass funding rate for SOL turned positive on Sunday, reading 0.0081% on Monday, indicating that longs are paying shorts and suggesting bullish sentiment.
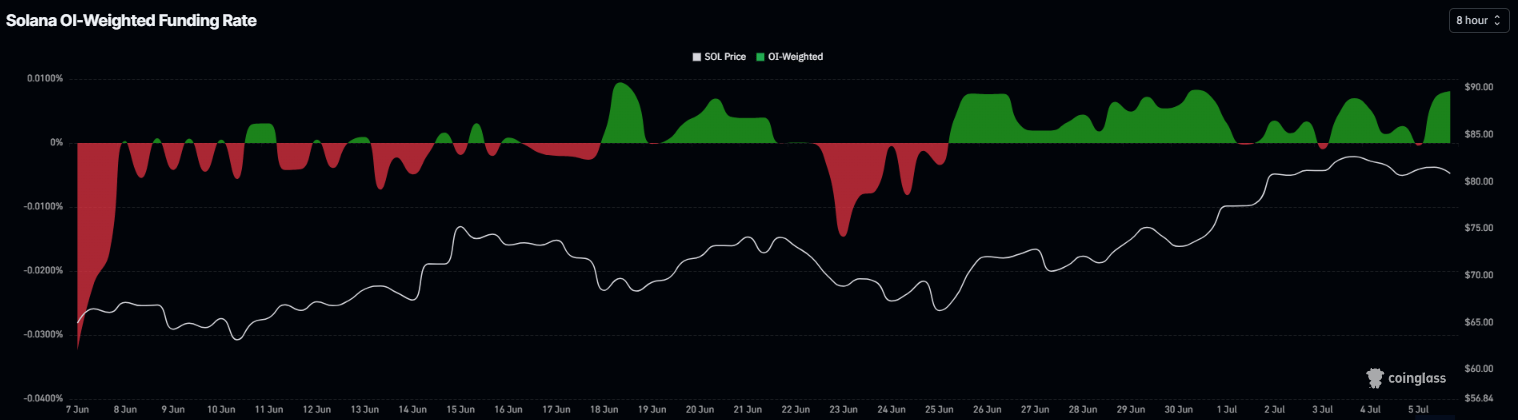
Solana Price Forecast: Faces resistance around 100-day EMA
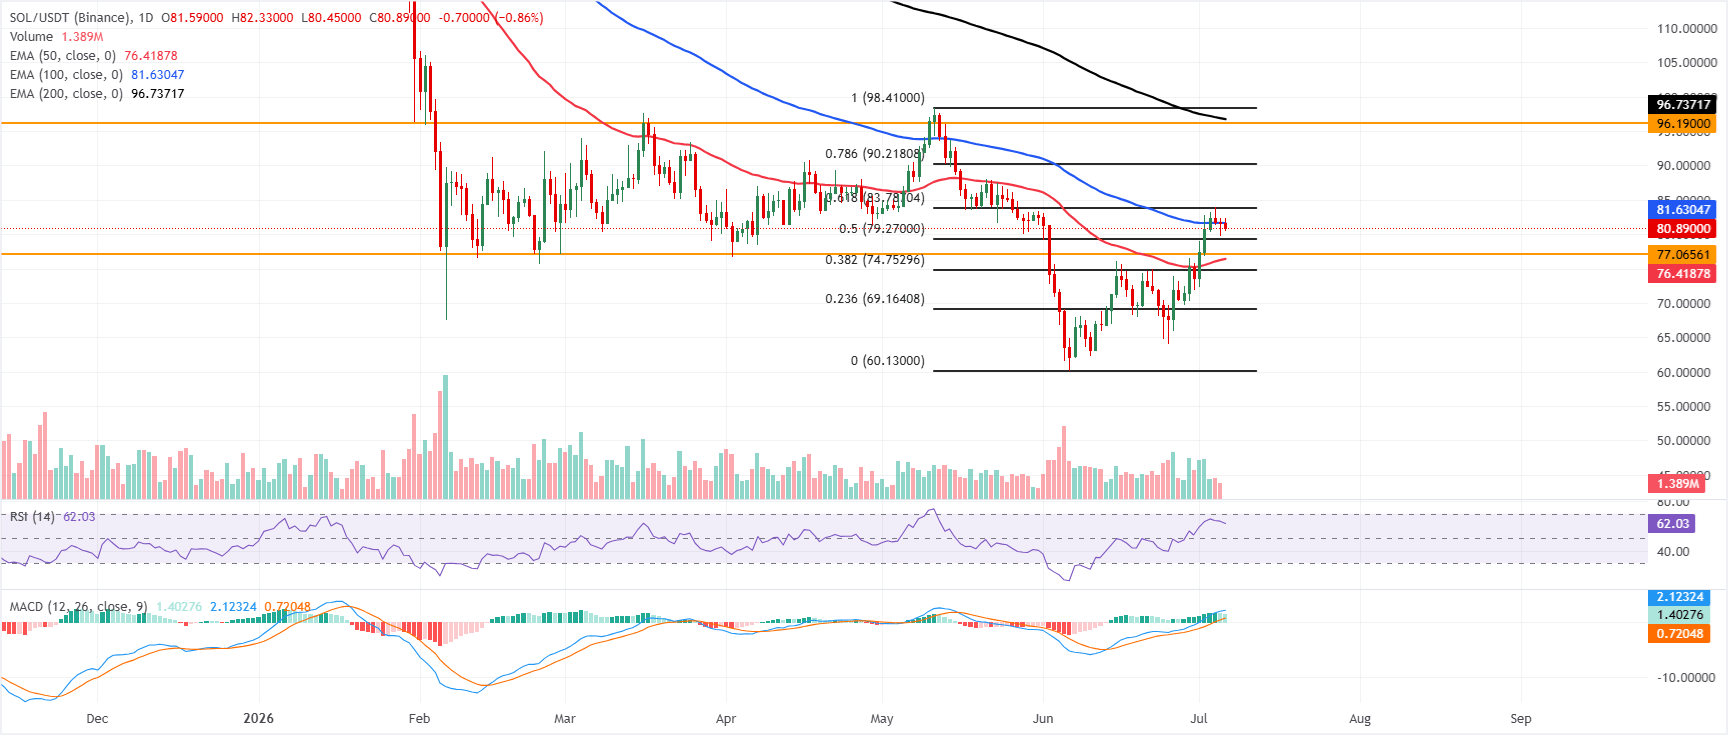
Solana price trades at $80.89 on Monday after rallying over 14% in the previous week. SOL’s near-term tone is neutral to slightly constructive as price holds above the 50-day Exponential Moving Average (EMA) at $76.41 and the 50% retracement at $79.27, yet remains capped under the 100-day EMA at $81.63 and the 61.8% Fibonacci retracement at $83.78.
The Relative Strength Index (RSI) hovers in the low 60s, while the Moving Average Convergence Divergence (MACD) stays in positive territory, both suggesting firm but not overextended bullish momentum as long as price holds above the nearby support band.
On the topside, initial resistance comes at the 100-day EMA around $81.63, followed by the 61.8% Fibonacci retracement at $83.78; a daily close above this cluster would open the door toward the 78.6% Fibonacci retracement at $90.21 and then the horizontal barrier at $96.19, ahead of the 200-day EMA around $96.73.
On the downside, immediate support is seen at the 50% retracement near $79.27, with additional cushions at the horizontal level of $77.06 and the 50-day EMA at $76.41; a break below there would expose the 38.2% Fibonacci retracement at $74.75 and deeper Fibonacci supports at $69.16 and $60.13.
(The technical analysis of this story was written with the help of an AI tool.)
Bài viết đề xuất


