

Crypto Today: Bitcoin, Ethereum, XRP struggle as key resistance zones hold despite improving sentiment
- Bitcoin’s rebound cools around $78,000 despite improving market sentiment, with spot ETFs experiencing inflows.
- Ethereum hovers around the 100-day EMA after rejection at $2,424, with steady institutional interest supporting constructive medium-term outlook.
- XRP consolidates between $1.40 support and $1.45 resistance levels as mild ETF inflows limit momentum.
Bitcoin (BTC) is trading around the pivotal $78,000 resistance at the time of writing on Thursday, reflecting a broader mild correction across the crypto market. Altcoins, including Ethereum (ETH) and Ripple (XRP), are painting a similar picture, correcting lower from their respective weekly highs at $2,424 and $1.46.
Crypto market sentiment improves as BTC, ETH and XRP post ETF inflows
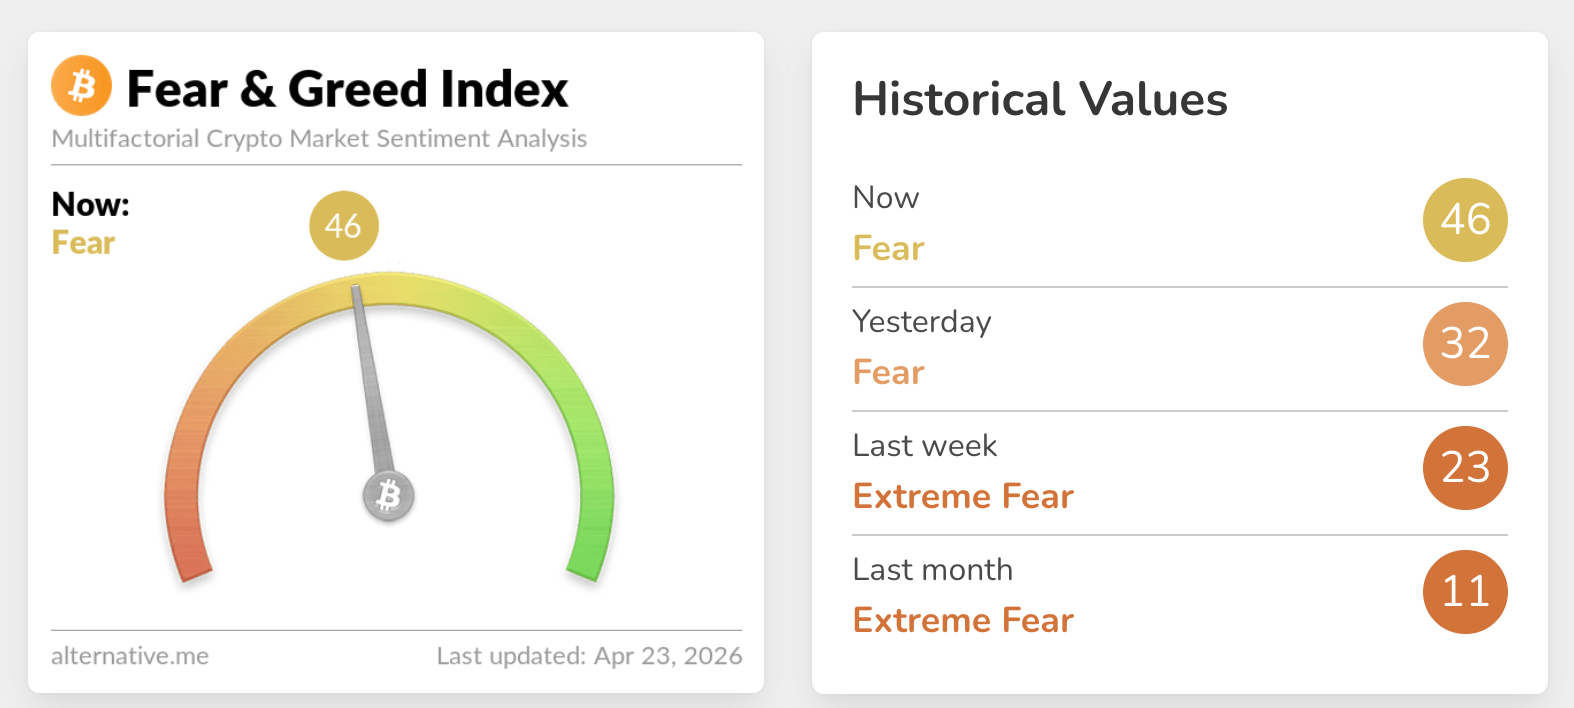
The Crypto Fear & Greed Index sits at 46 in the fear territory on Thursday, up from 32 the previous day and 23 in extreme fear territory last week. Market sentiment appears to be steadily improving despite the conflict in the Middle East, especially with an uncertain diplomatic resolution. On the bright side, the United States (US)-Iran ceasefire is holding after President Donald Trump extended it on Tuesday.
If sentiment continues to improve, appetite for risk assets, including crypto, could increase along with bullish conviction.
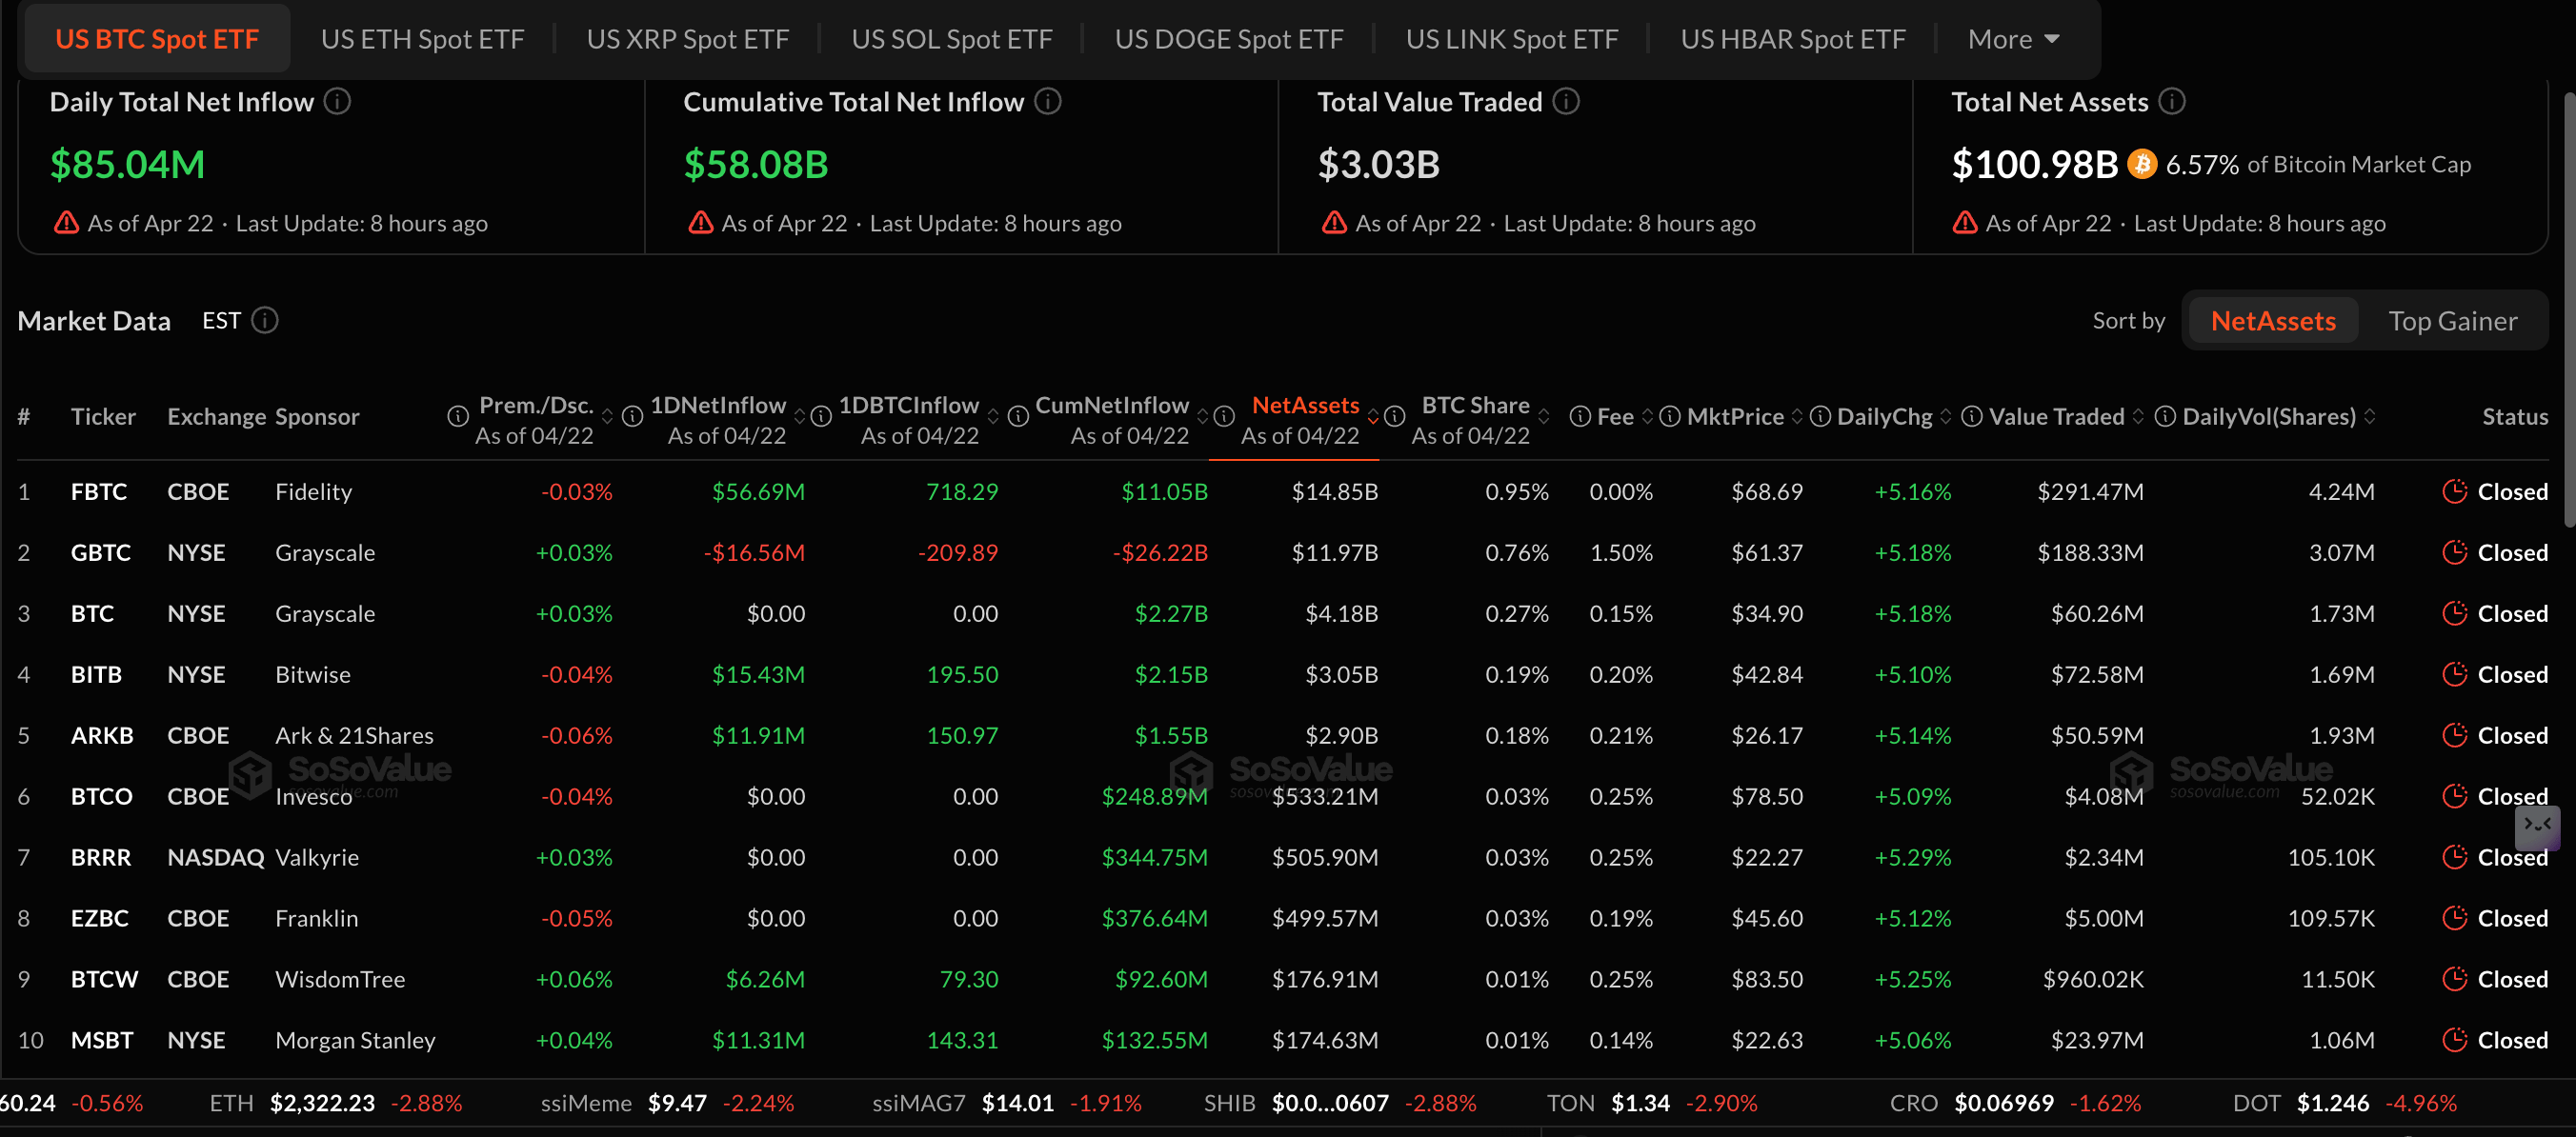
Interest in US-listed BTC spot Exchange-Traded Funds (ETFs) has remained relatively steady, attracting roughly $85 million in inflows on Wednesday. Cumulative inflows now stand at $58.08 billion, with net assets under management at $100.98 billion. Persistent inflows suggest that institutional appetite is growing and helping to shape sentiment and Bitcoin’s bullish outlook.
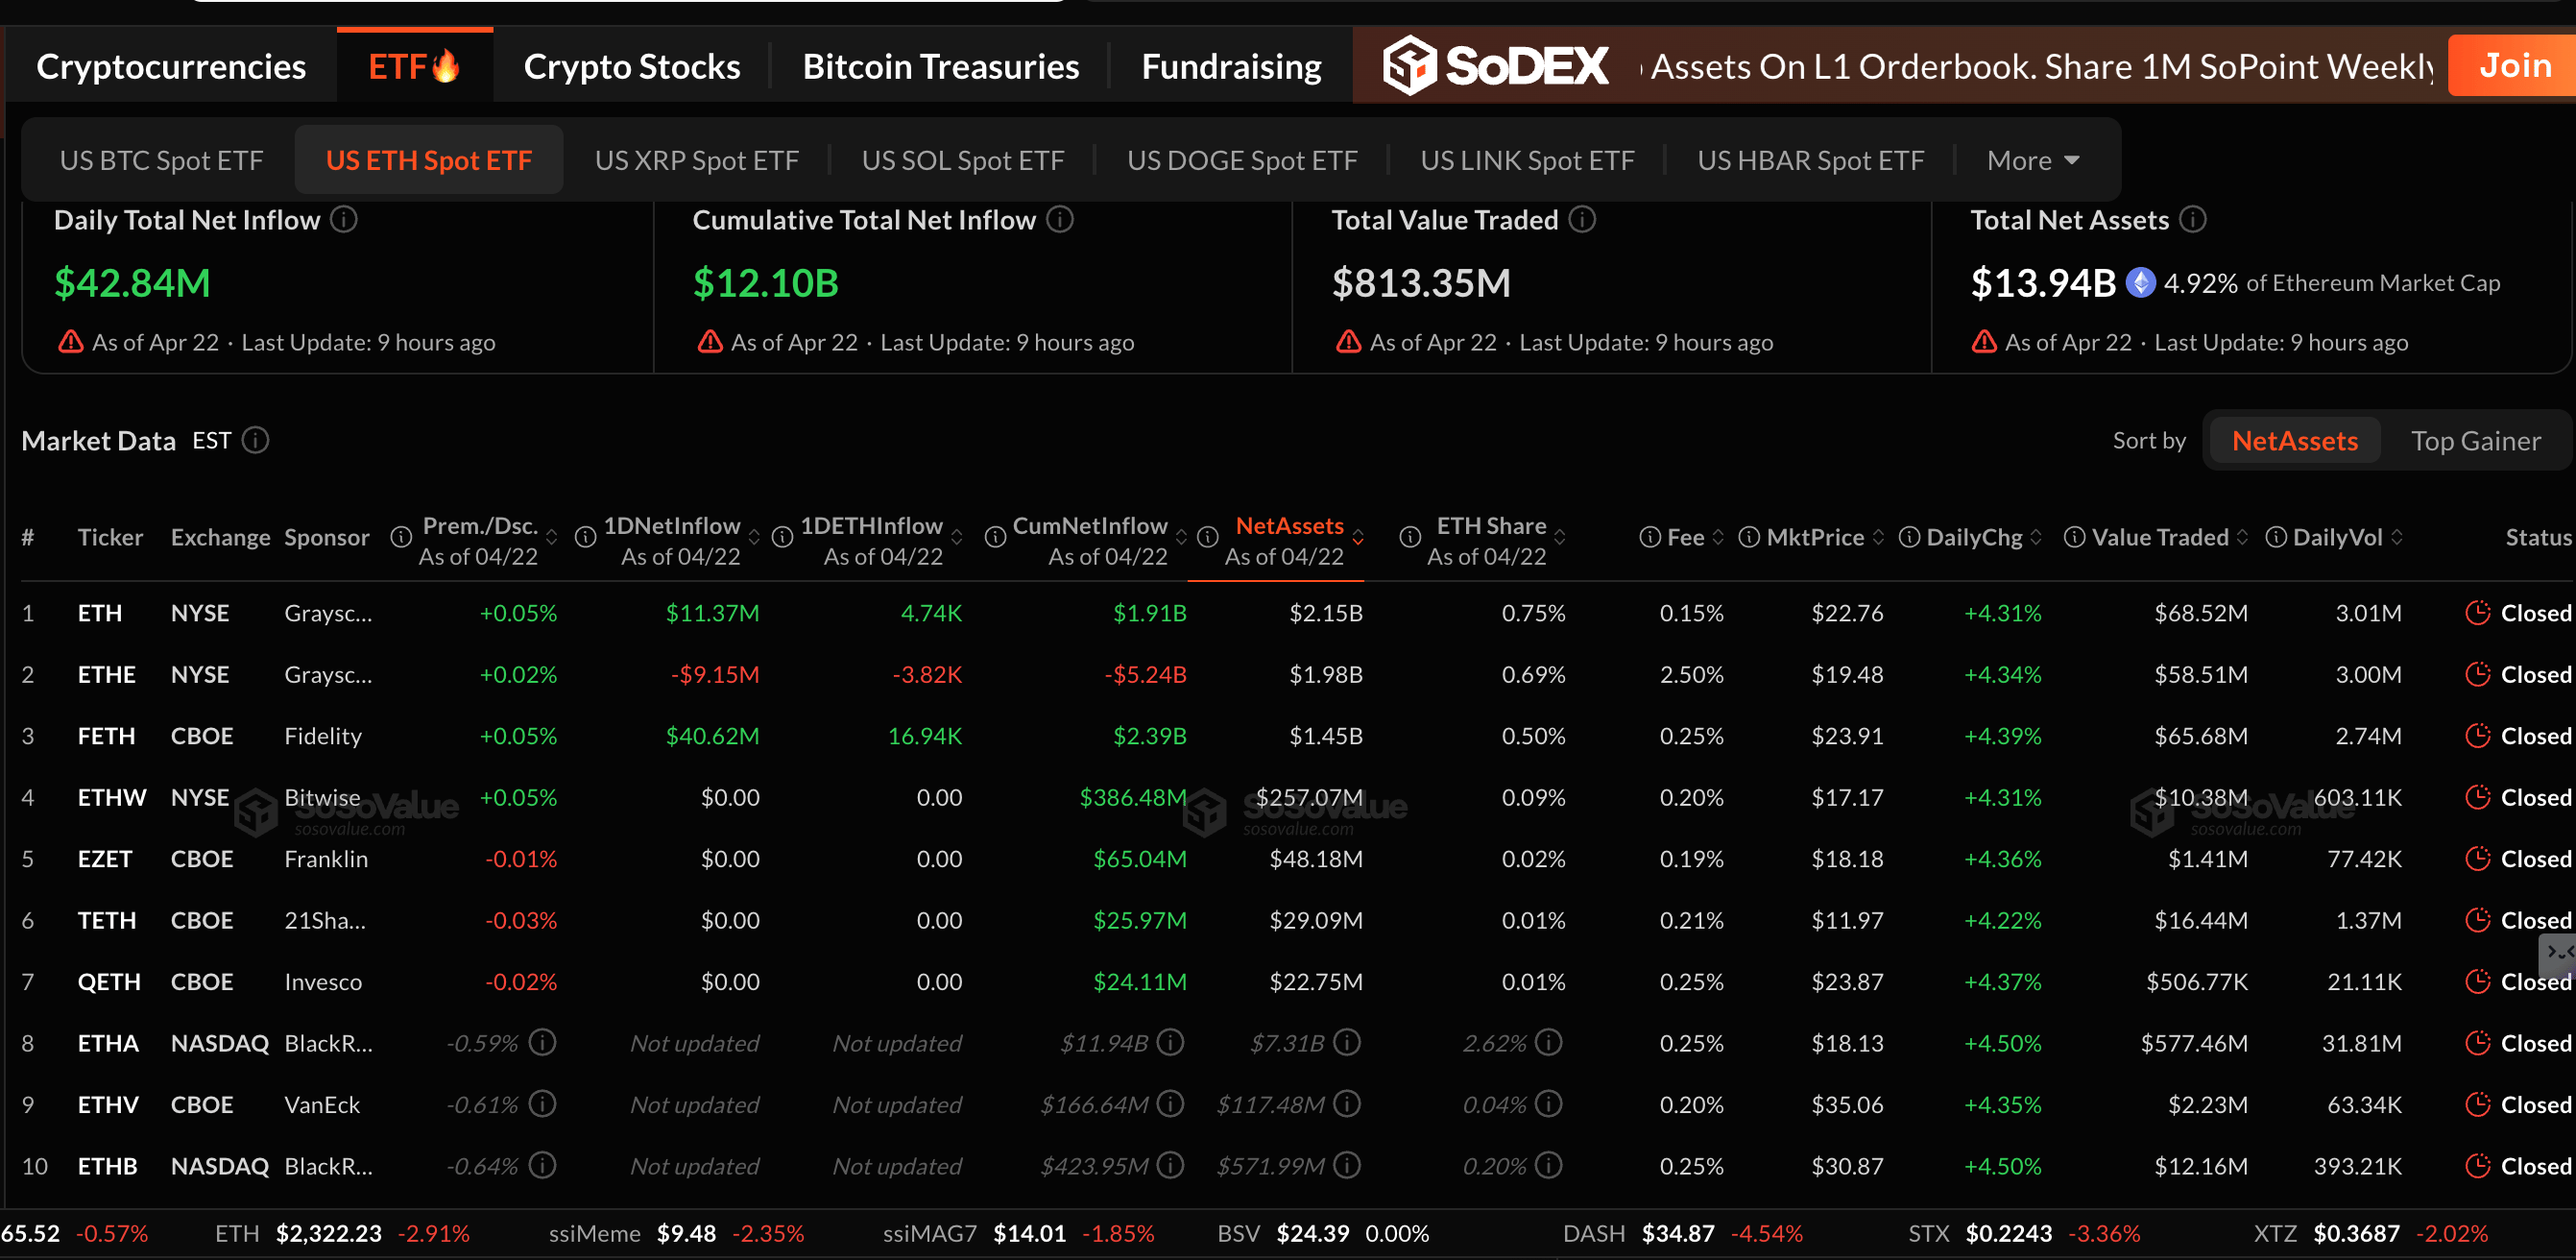
Ethereum is also experiencing an influx of capital via spot ETFs, as reflected by inflows of nearly $43 million on Wednesday. SoSoValue data shows the cumulative inflows averaging $12.10 billion, while net assets stand at $13.94 billion.
Meanwhile, XRP spot ETFs’ inflows resumed on Wednesday, attracting roughly $2.42 million, following muted activity the previous day. With cumulative inflows rising to $1.28 billion and total net assets to $1.09 billion, institutional demand could help shape sentiment and sustain XRP’s recovery.
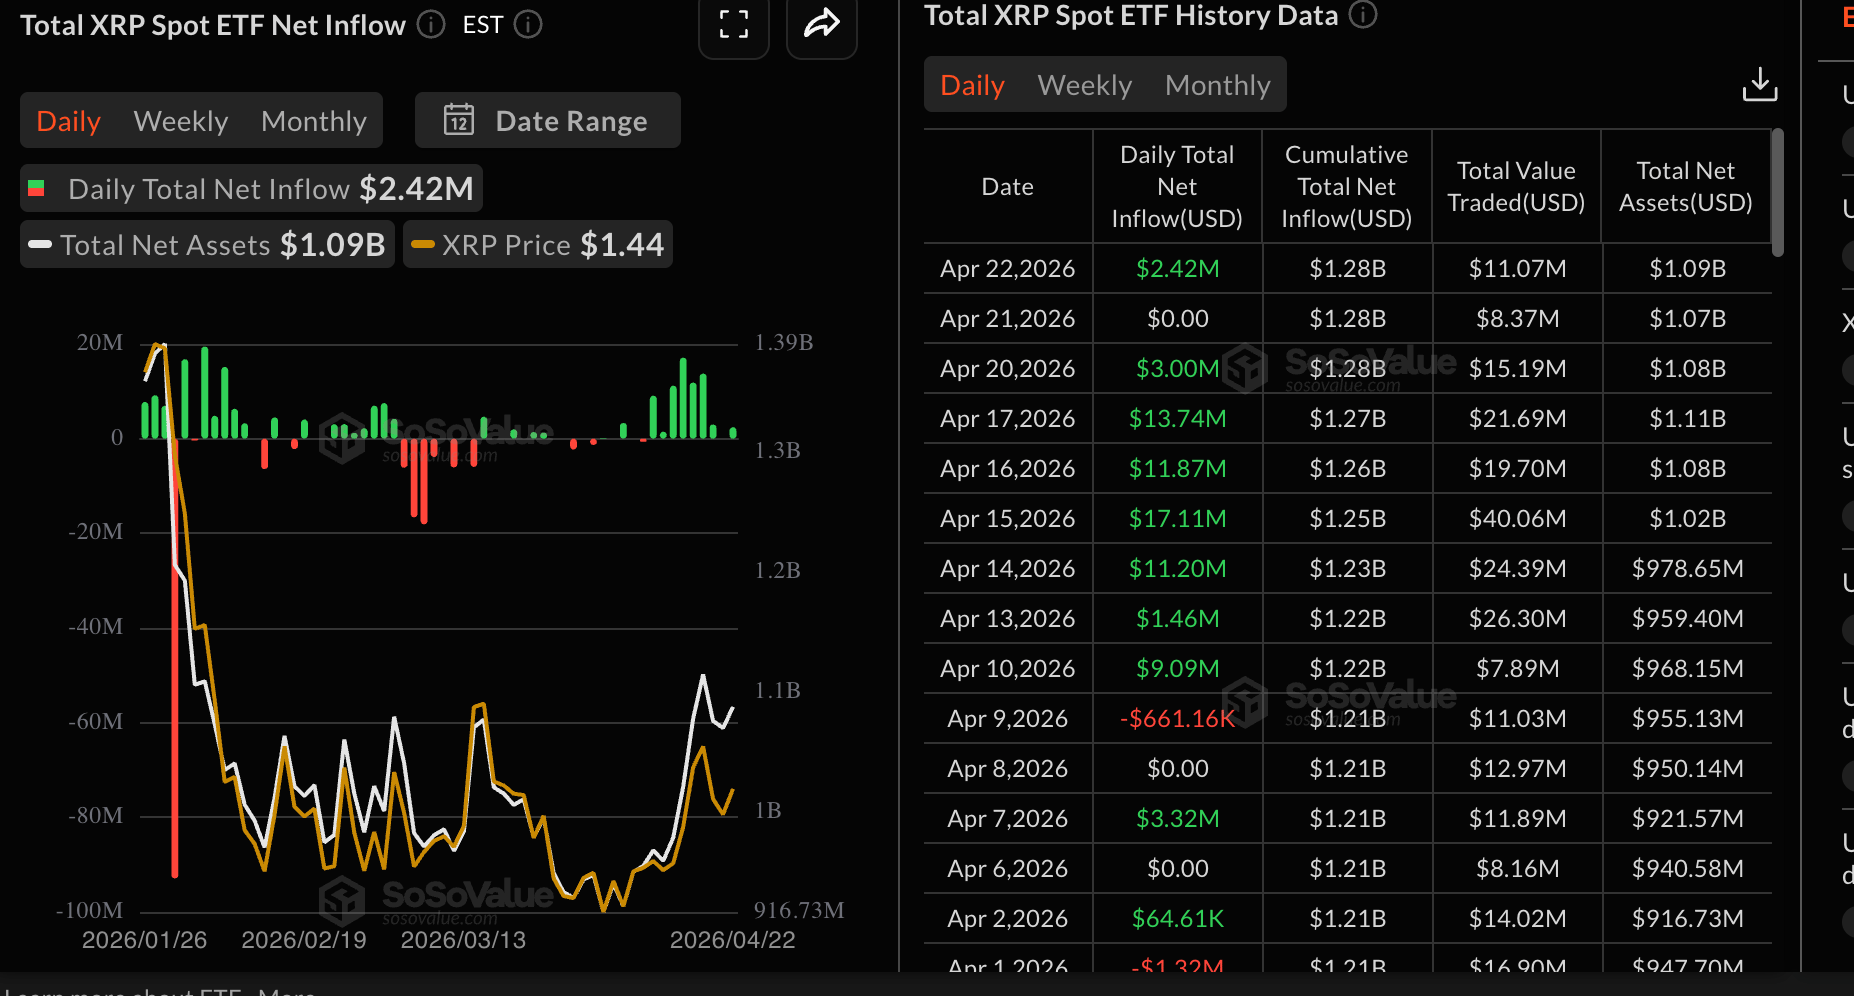
Chart of the day: Bitcoin uptrend stalls
Bitcoin trades around $78,000 after a rejection at its weekly high of $79,473. Still, the Crypto King retains a bullish near-term bias as price holds well above the 50-day and 100-day Exponential Moving Averages (EMAs) at roughly $72,577 and $75,433, respectively, reinforcing an underlying demand zone after the latest surge.
Momentum remains constructive, with the Relative Strength Index (RSI) hovering in the mid-60s on the daily chart and the Money Flow Index (MFI) deep in overbought territory. The Moving Average Convergence Divergence (MACD) histogram remains in positive territory on the same chart, all suggesting persistent but increasingly stretched upside pressure.
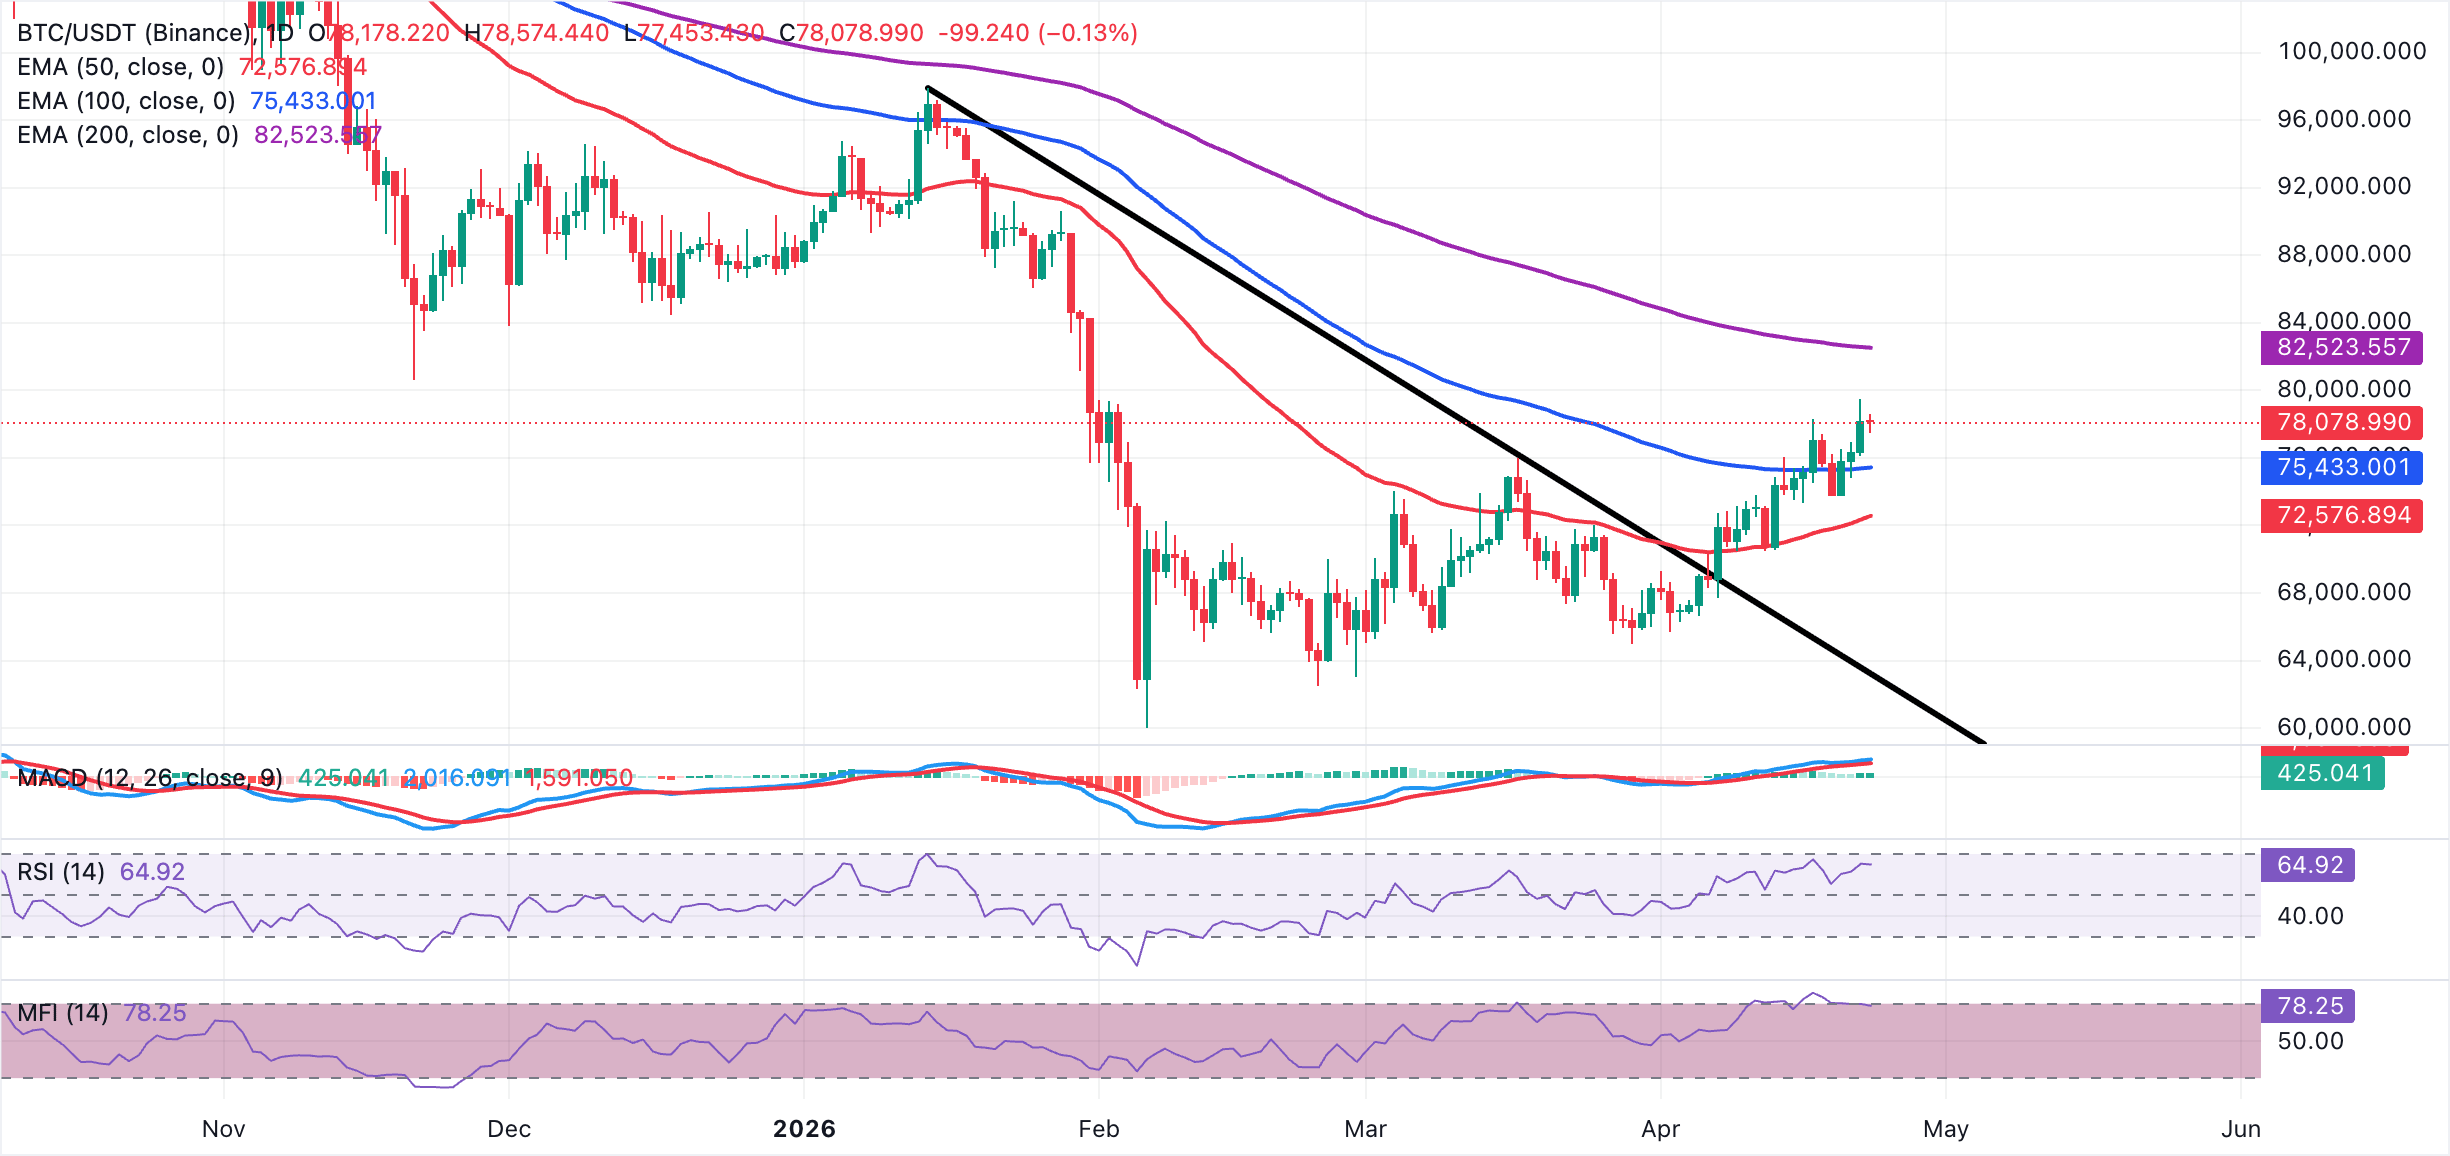
On the topside, the next notable resistance is the weekly peak of $79,473, followed by the 200-day EMA near $82,524, which aligns as the first major trend hurdle for bulls. On the downside, initial support is seen at the 100-day EMA around $75,433, ahead of the 50-day EMA near $72,577. A daily close below these layers would signal fading bullish control and open the door to a deeper corrective phase.
Altcoins technical outlook: Ethereum and XRP pullback could extend
Ethereum trades at $2,343 and maintains a constructive near-term bias, as it trades above the 50-day EMA at $2,227. The smart contract token has also broken beyond a long-running downward resistance trendline, which now acts as an underlying structural floor around $2,108.
Mildly positive MACD readings on the daily chart, along with the RSI near 57, hint at building bullish momentum, though the elevated MFI around 74 warns that upside could become stretched in the short term.
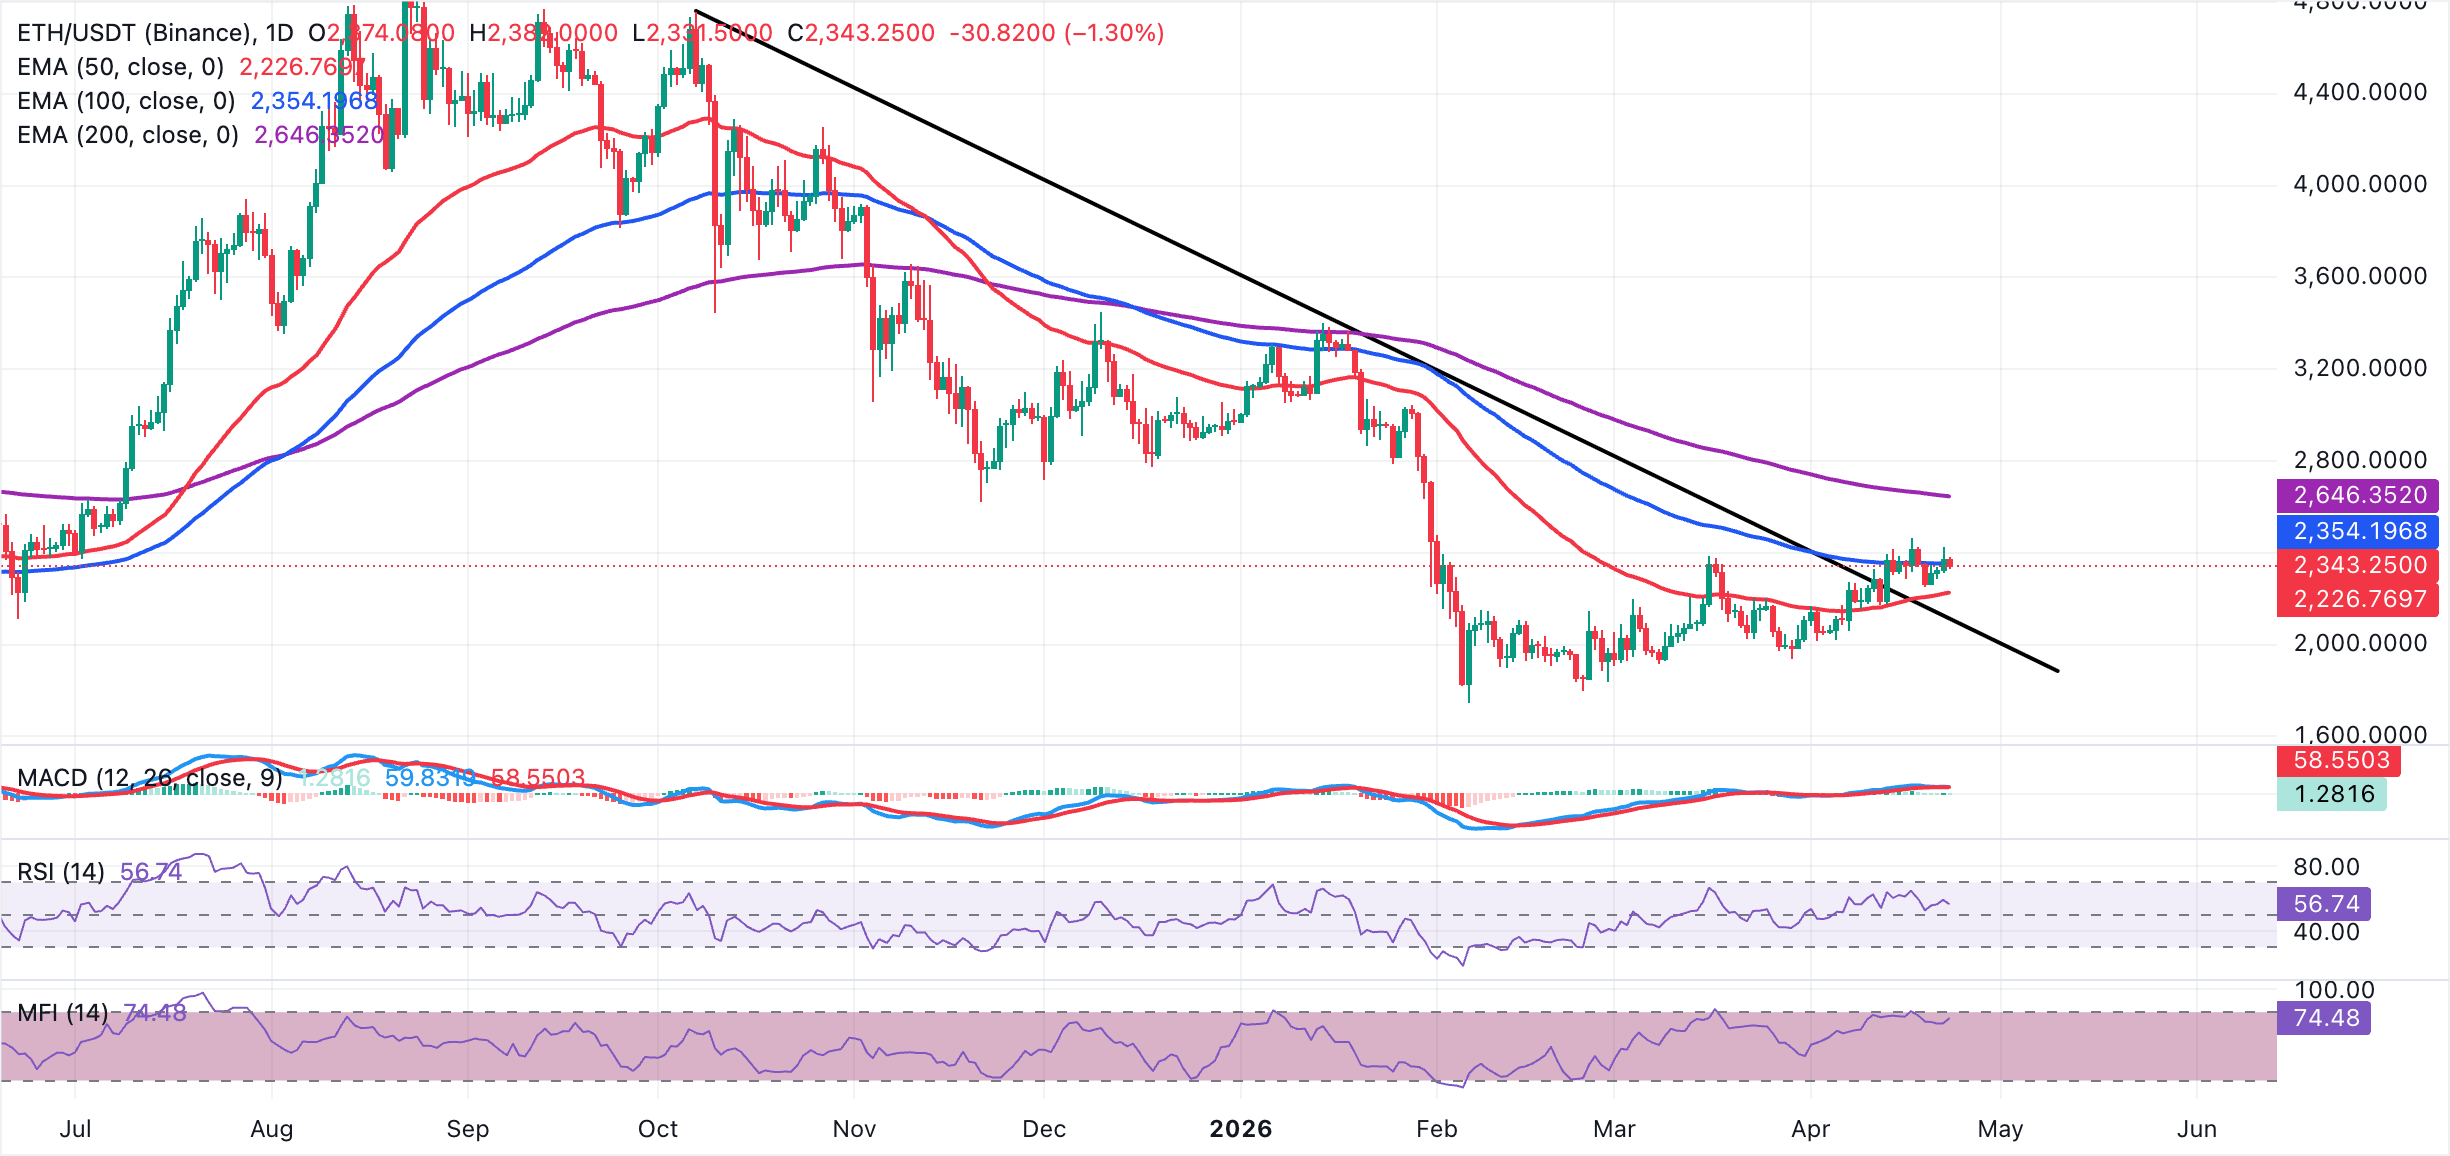
On the topside, immediate resistance is at the 100-day EMA near $2,354. The 200-day EMA at $2,646, which serves as a more distant barrier, defines the broader recovery threshold. On the downside, initial support is seen around the weekly open at $2,263, followed by firmer support at the 50-day EMA at $2,227. A deeper pullback towards the former descending trendline break zone near $2,108 would be expected to attract dip-buying while the broader bullish tone remains intact.
XRP, on the other hand, hovers around $1.42, while holding just above the 50-day EMA at $1.41. The remittance token maintains a tentative constructive tone, though the broader structure remains capped by the 100-day EMA at $1.54 and the distant 200-day EMA at $1.78. Momentum is mildly supportive as the RSI holds slightly above the midline near 54 on the daily chart, while the Moving Average Convergence Divergence (MACD) histogram stays in positive territory, hinting at persistent but moderate bullish pressure.
However, the elevated MFI around 80 signals overbought conditions, warning that buyers may face exhaustion against overhead barriers.
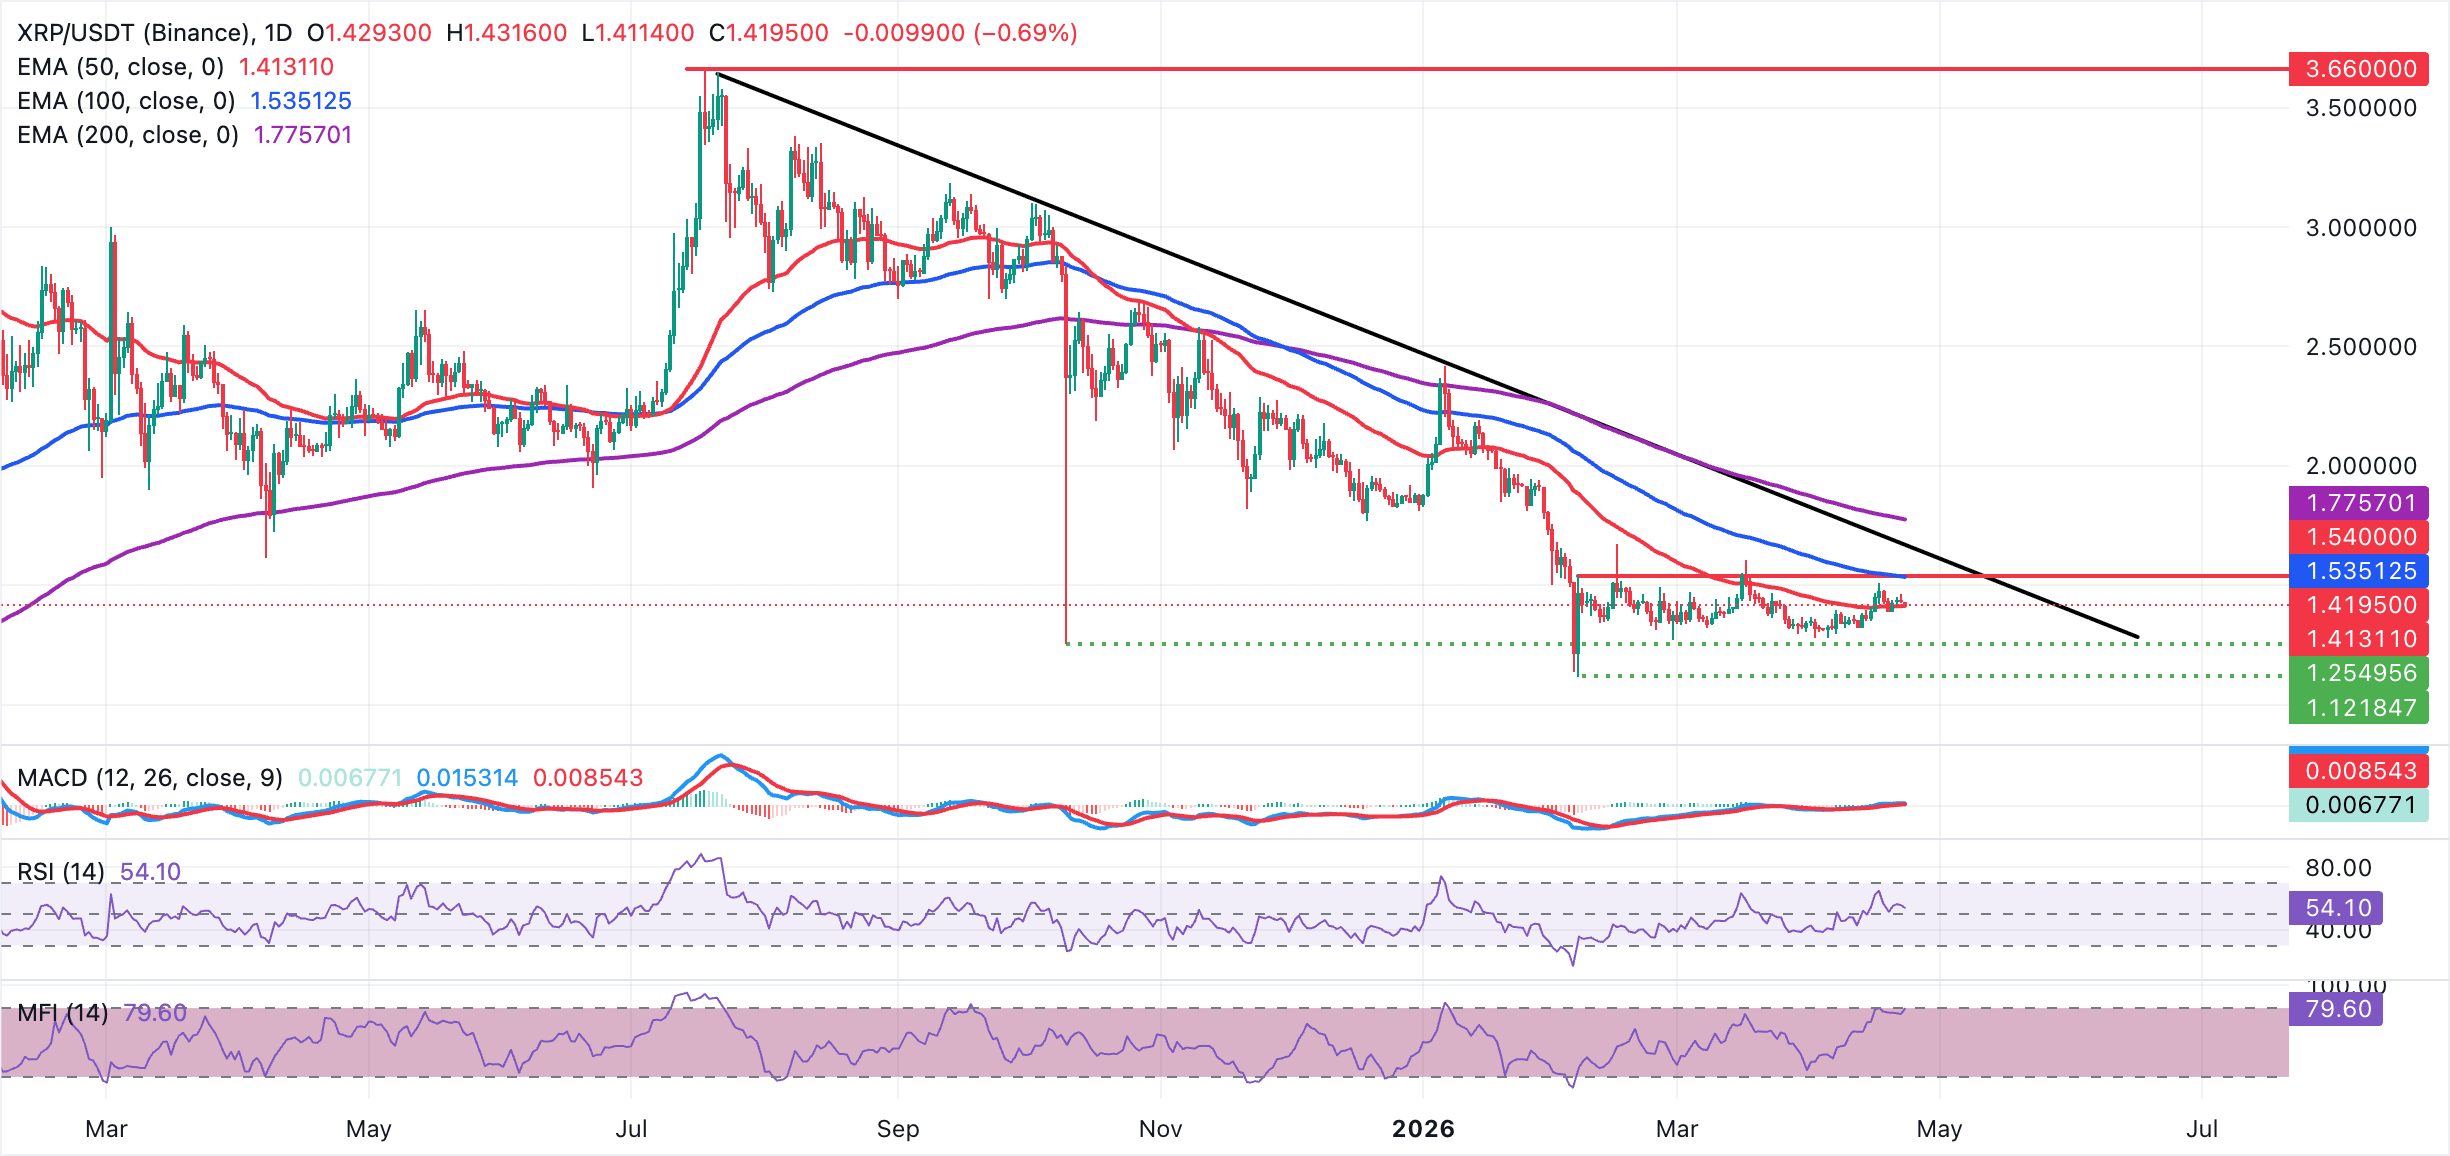
On the topside, initial resistance lies at the weekly peak of $1.46, followed by the 100-day EMA around $1.54, which guards the path toward the more strategic 200-day EMA at $1.78. On the downside, immediate support is provided by the 50-day EMA at $1.41. A sustained break below this floor would expose XRP to a deeper corrective phase.
(The technical analysis of this story was written with the help of an AI tool.)
Crypto ETF FAQs
An Exchange-Traded Fund (ETF) is an investment vehicle or an index that tracks the price of an underlying asset. ETFs can not only track a single asset, but a group of assets and sectors. For example, a Bitcoin ETF tracks Bitcoin’s price. ETF is a tool used by investors to gain exposure to a certain asset.
Yes. The first Bitcoin futures ETF in the US was approved by the US Securities & Exchange Commission in October 2021. A total of seven Bitcoin futures ETFs have been approved, with more than 20 still waiting for the regulator’s permission. The SEC says that the cryptocurrency industry is new and subject to manipulation, which is why it has been delaying crypto-related futures ETFs for the last few years.
Yes. The SEC approved in January 2024 the listing and trading of several Bitcoin spot Exchange-Traded Funds, opening the door to institutional capital and mainstream investors to trade the main crypto currency. The decision was hailed by the industry as a game changer.
The main advantage of crypto ETFs is the possibility of gaining exposure to a cryptocurrency without ownership, reducing the risk and cost of holding the asset. Other pros are a lower learning curve and higher security for investors since ETFs take charge of securing the underlying asset holdings. As for the main drawbacks, the main one is that as an investor you can’t have direct ownership of the asset, or, as they say in crypto, “not your keys, not your coins.” Other disadvantages are higher costs associated with holding crypto since ETFs charge fees for active management. Finally, even though investing in ETFs reduces the risk of holding an asset, price swings in the underlying cryptocurrency are likely to be reflected in the investment vehicle too.
Bài viết đề xuất


