

Ripple Price Forecast: XRP defends key support amid increasing capital outflows
- XRP hovers above $1.33 support as crypto prices broadly recover amid the Middle East war.
- XRP digital asset investment products recorded $30 million in outflows last week.
- Retail demand remains on the back foot, with futures Open Interest averaging $2.25 billion on Monday.
Ripple (XRP) is holding above $1.35 at the time of writing on Monday as global markets continue pricing in the war in the Middle East. The remittance token faced significant capital outflows last week, reflecting sticky risk-off sentiment. Moreover, retail interest in XRP remains low, weighing on the price.
XRP demand cools amid capital outflows
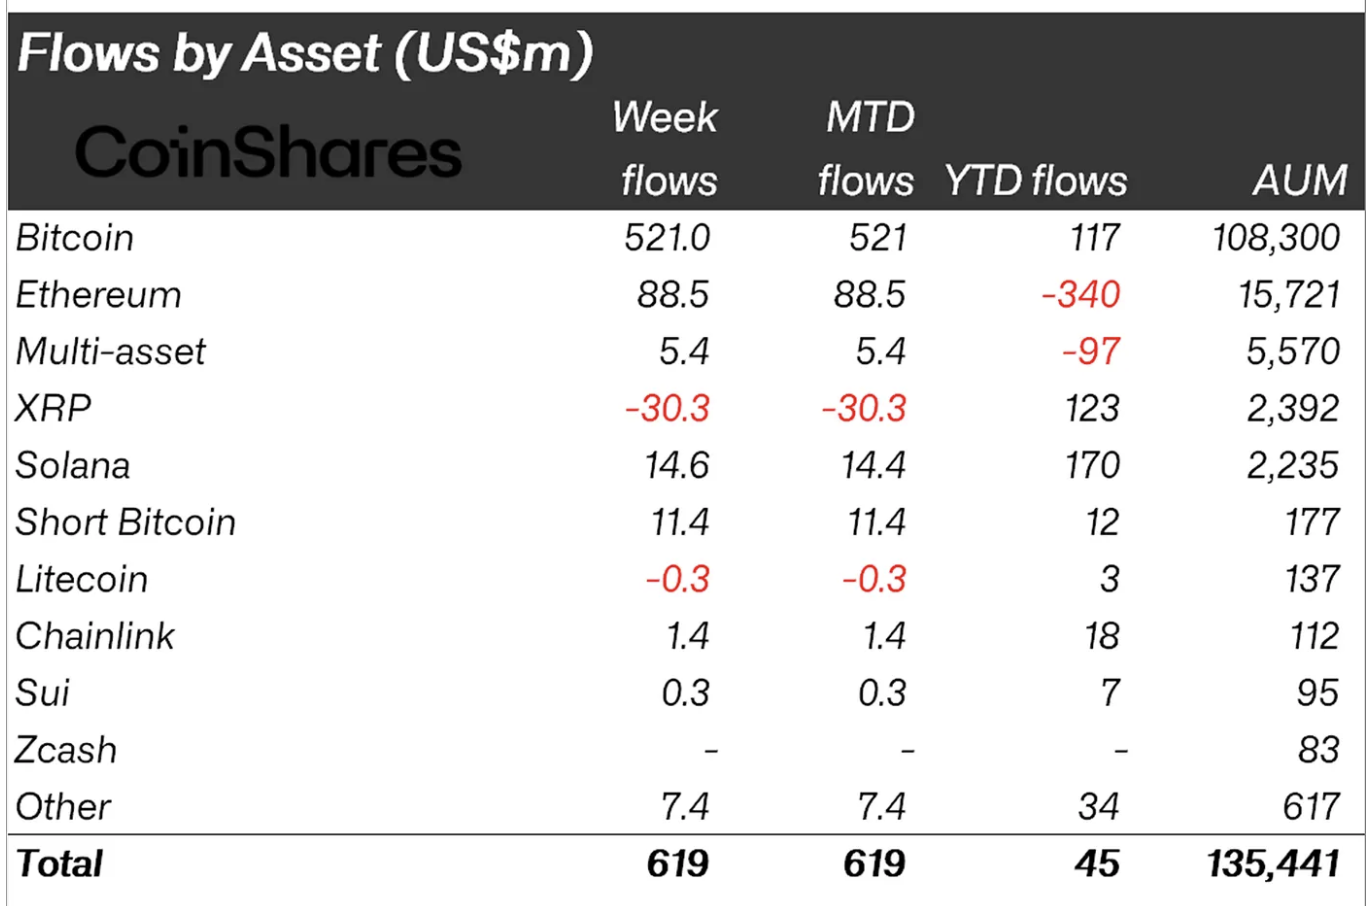
XRP-related digital asset investment products experienced outflows of $30 million last week, according to a CoinShares report. Total assets under management stand at roughly $2.4 billion, with year-to-date inflows at $123 million.
Investor interest shifted to Bitcoin (BTC), recording approximately $521 million in inflows last week. Ethereum (ETH) and Solana (SOL) also saw notable inflows of $88.5 million and $14.6 million, respectively.
“Digital asset investment products recorded inflows of US$619M last week, highlighting that the initial market reaction to the Iran crisis has been supportive for the asset class,” the CoinShares report states.
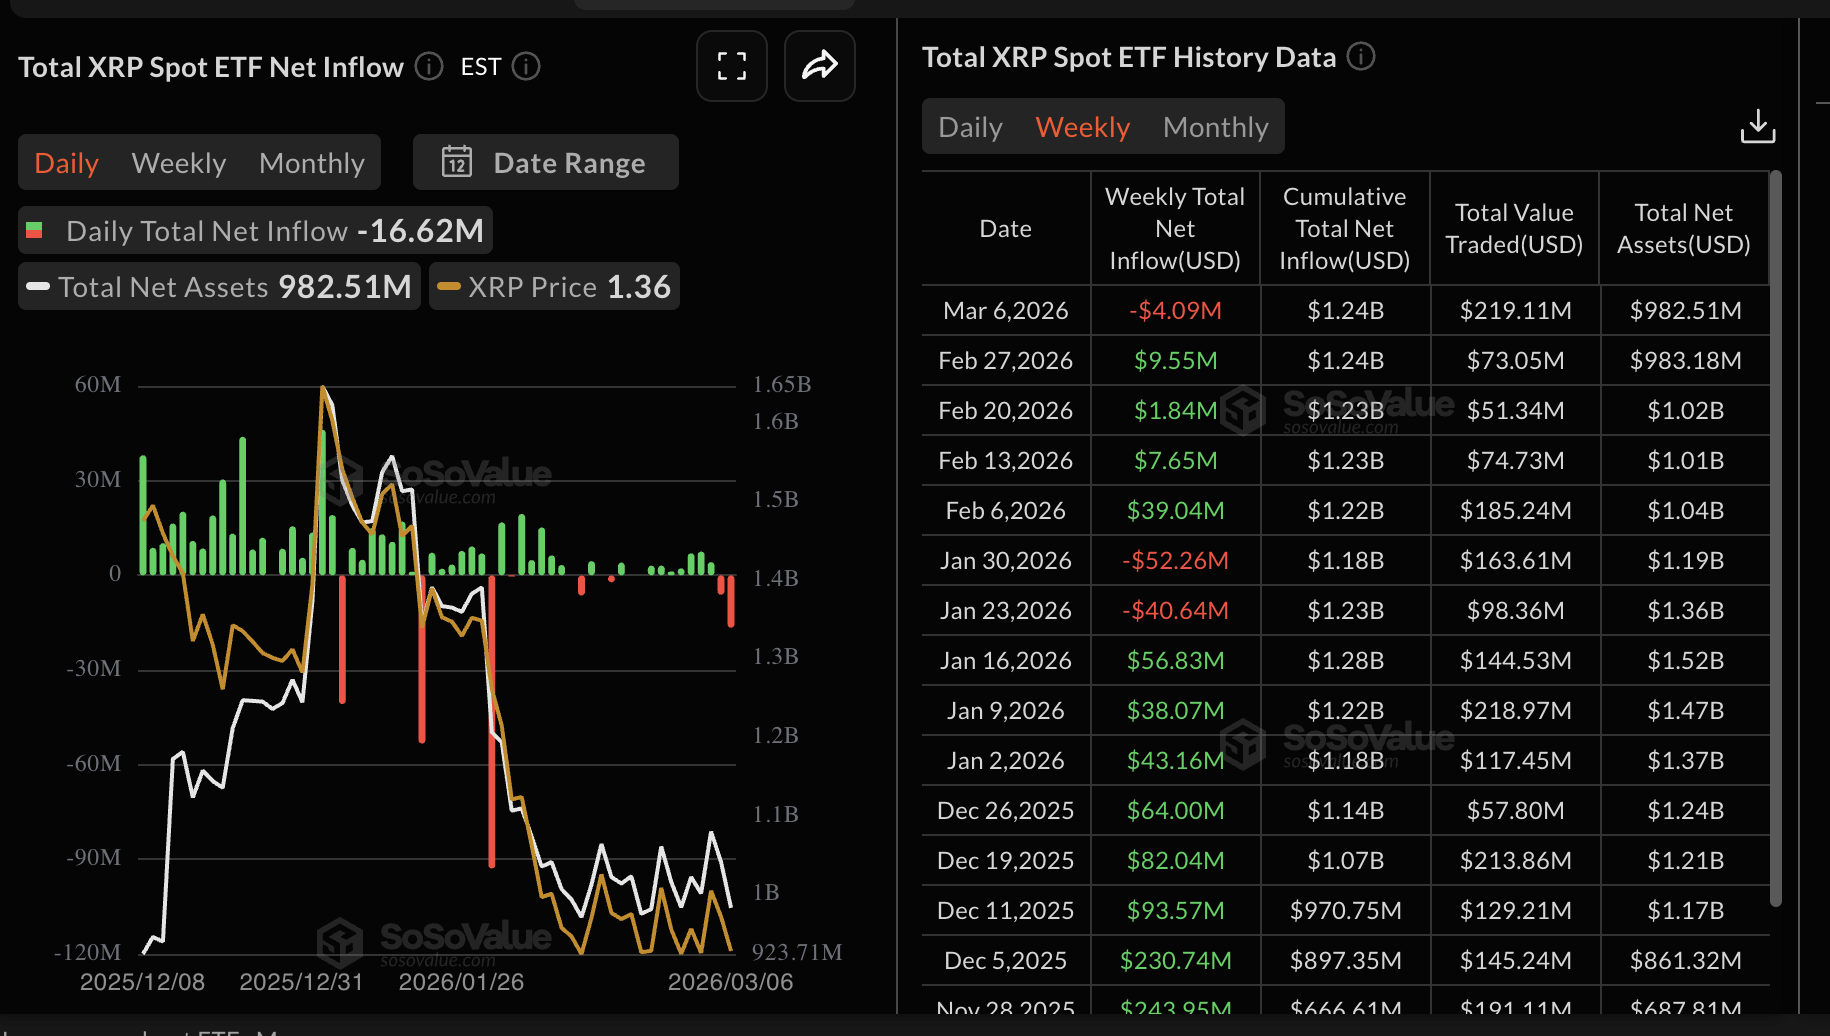
Interest in XRP spot Exchange-Traded Funds (ETFs) also took a back seat, with outflows totaling $4 million last week. Despite the cooling demand, cumulative inflows remain at $1.24 billion, and net assets are roughly $983 million.
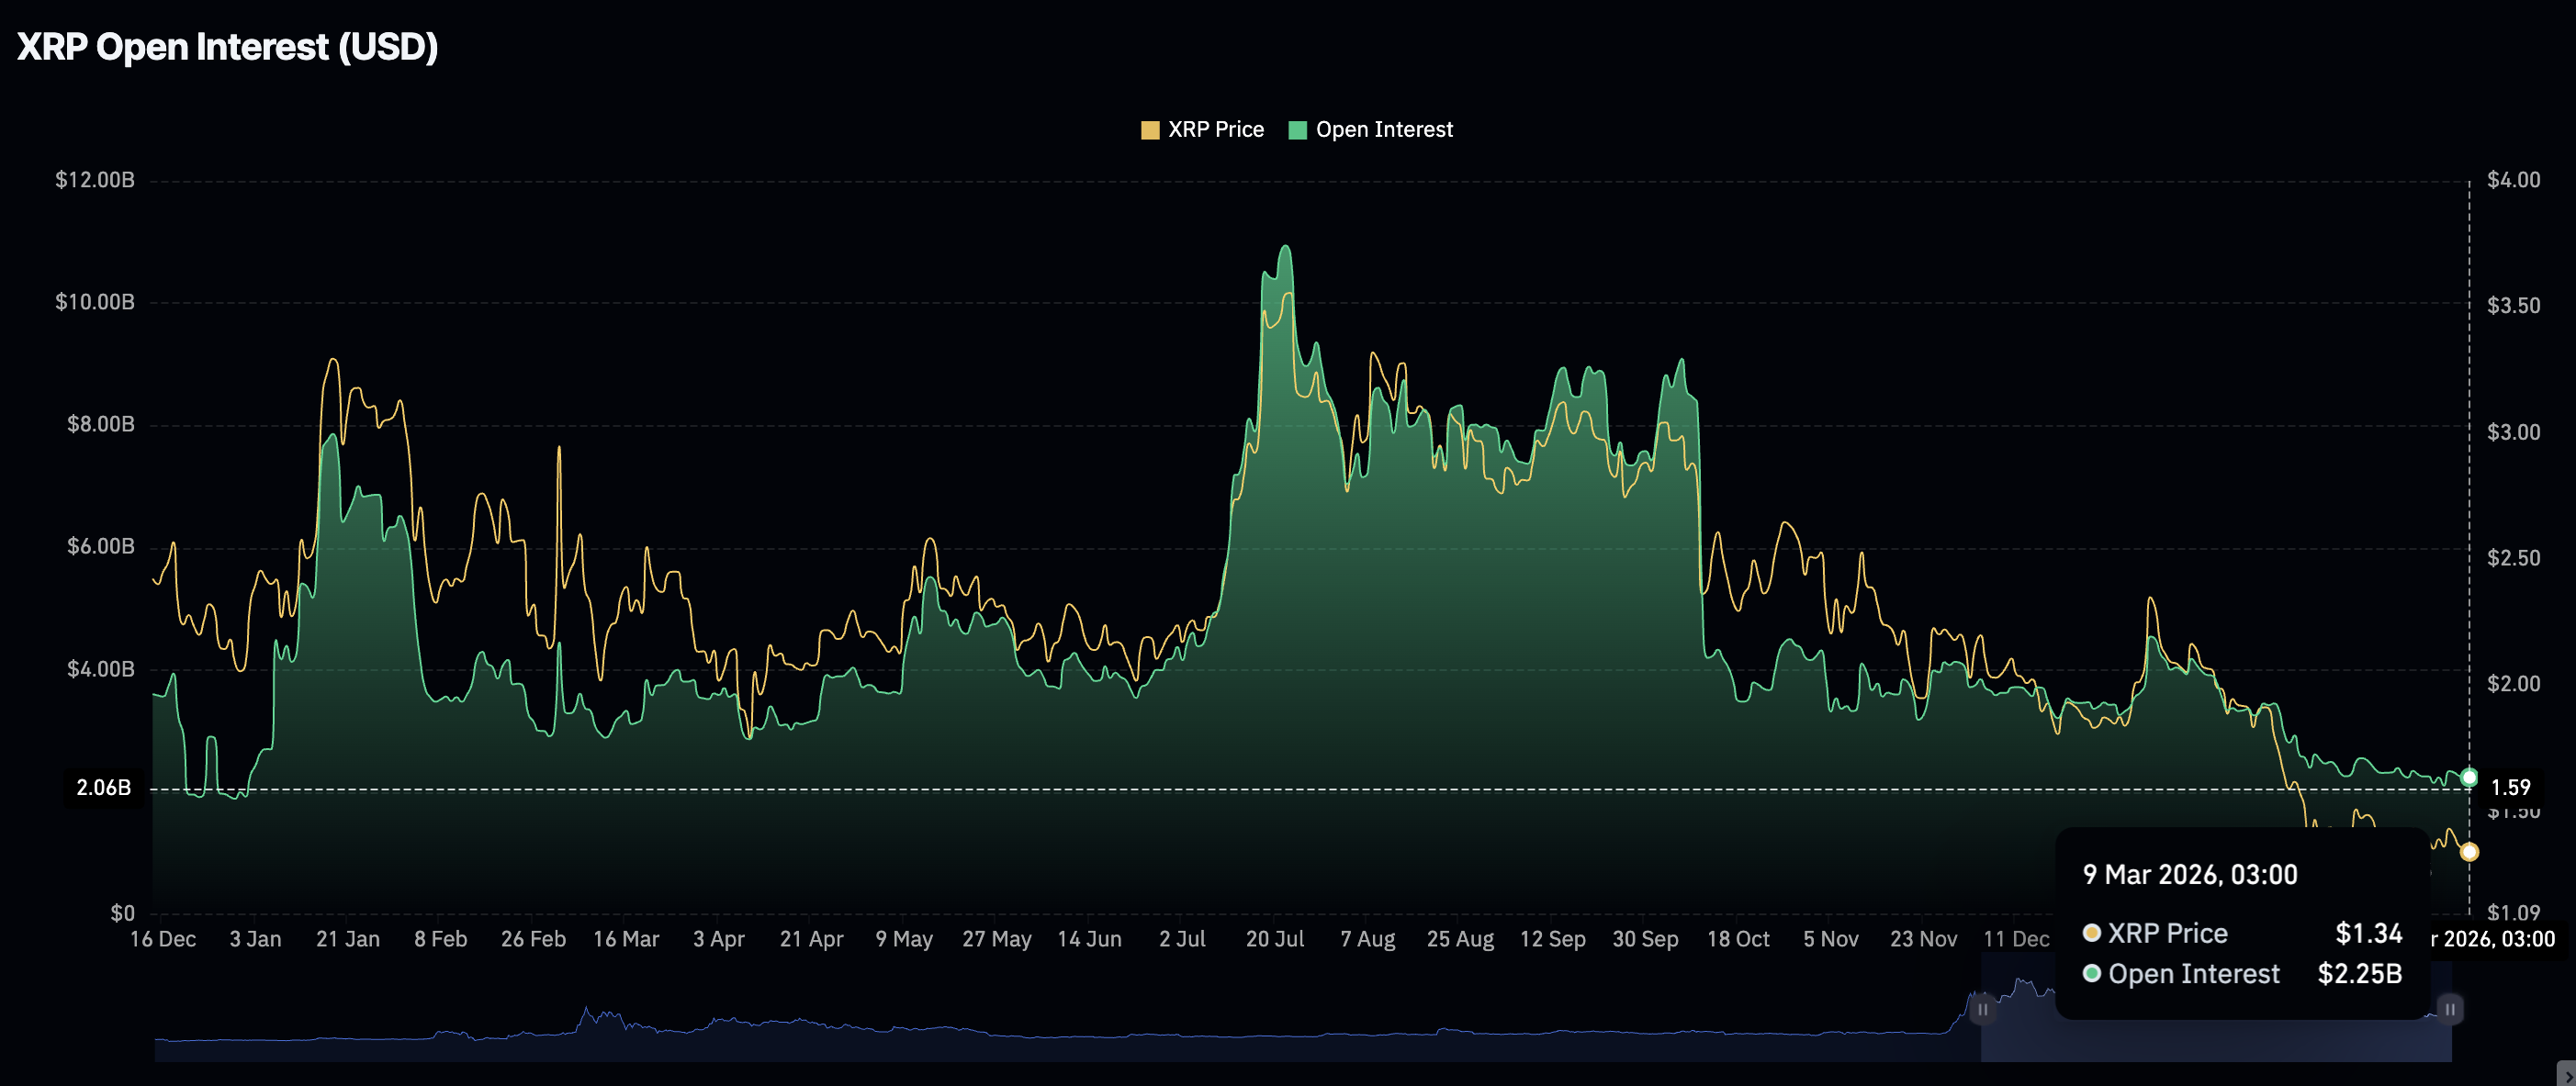
The persistent drawdown in XRP prices since the record high of $3.66 in July has driven retail investors to the sidelines, leading to a massive slump in futures Open Interest (OI), which holds steady at $2.25 billion on Monday.
In contrast, the OI peaked at $10.94 billion in July, but the persistent selling in the derivatives market undermines retail interest. OI reflects the notional value of outstanding futures contracts.
Technical outlook: XRP ticks up as bulls tighten their grip
XRP is trading at $1.36, with the Moving Average Convergence Divergence (MACD) indicator staying above its signal line, indicating slightly bullish momentum. Green histogram bars are expanding again, prompting traders to increase their exposure. Meanwhile, the Relative Strength Index (RSI) at 43 indicates sub-50 momentum, consistent with a market struggling to shift bullish after extended drawdowns.
Moreover, the XRP price continues to grind lower below the 50-day, 100-day and 200-day Exponential Moving Averages (EMAs), keeping the broader bias bearish despite the recent stabilization in closing prices. The SuperTrend line near $1.58 remains well above spot and serves as an overarching dynamic cap, aligning with the downward-sloping moving average that underscores persistent selling pressure on rallies.
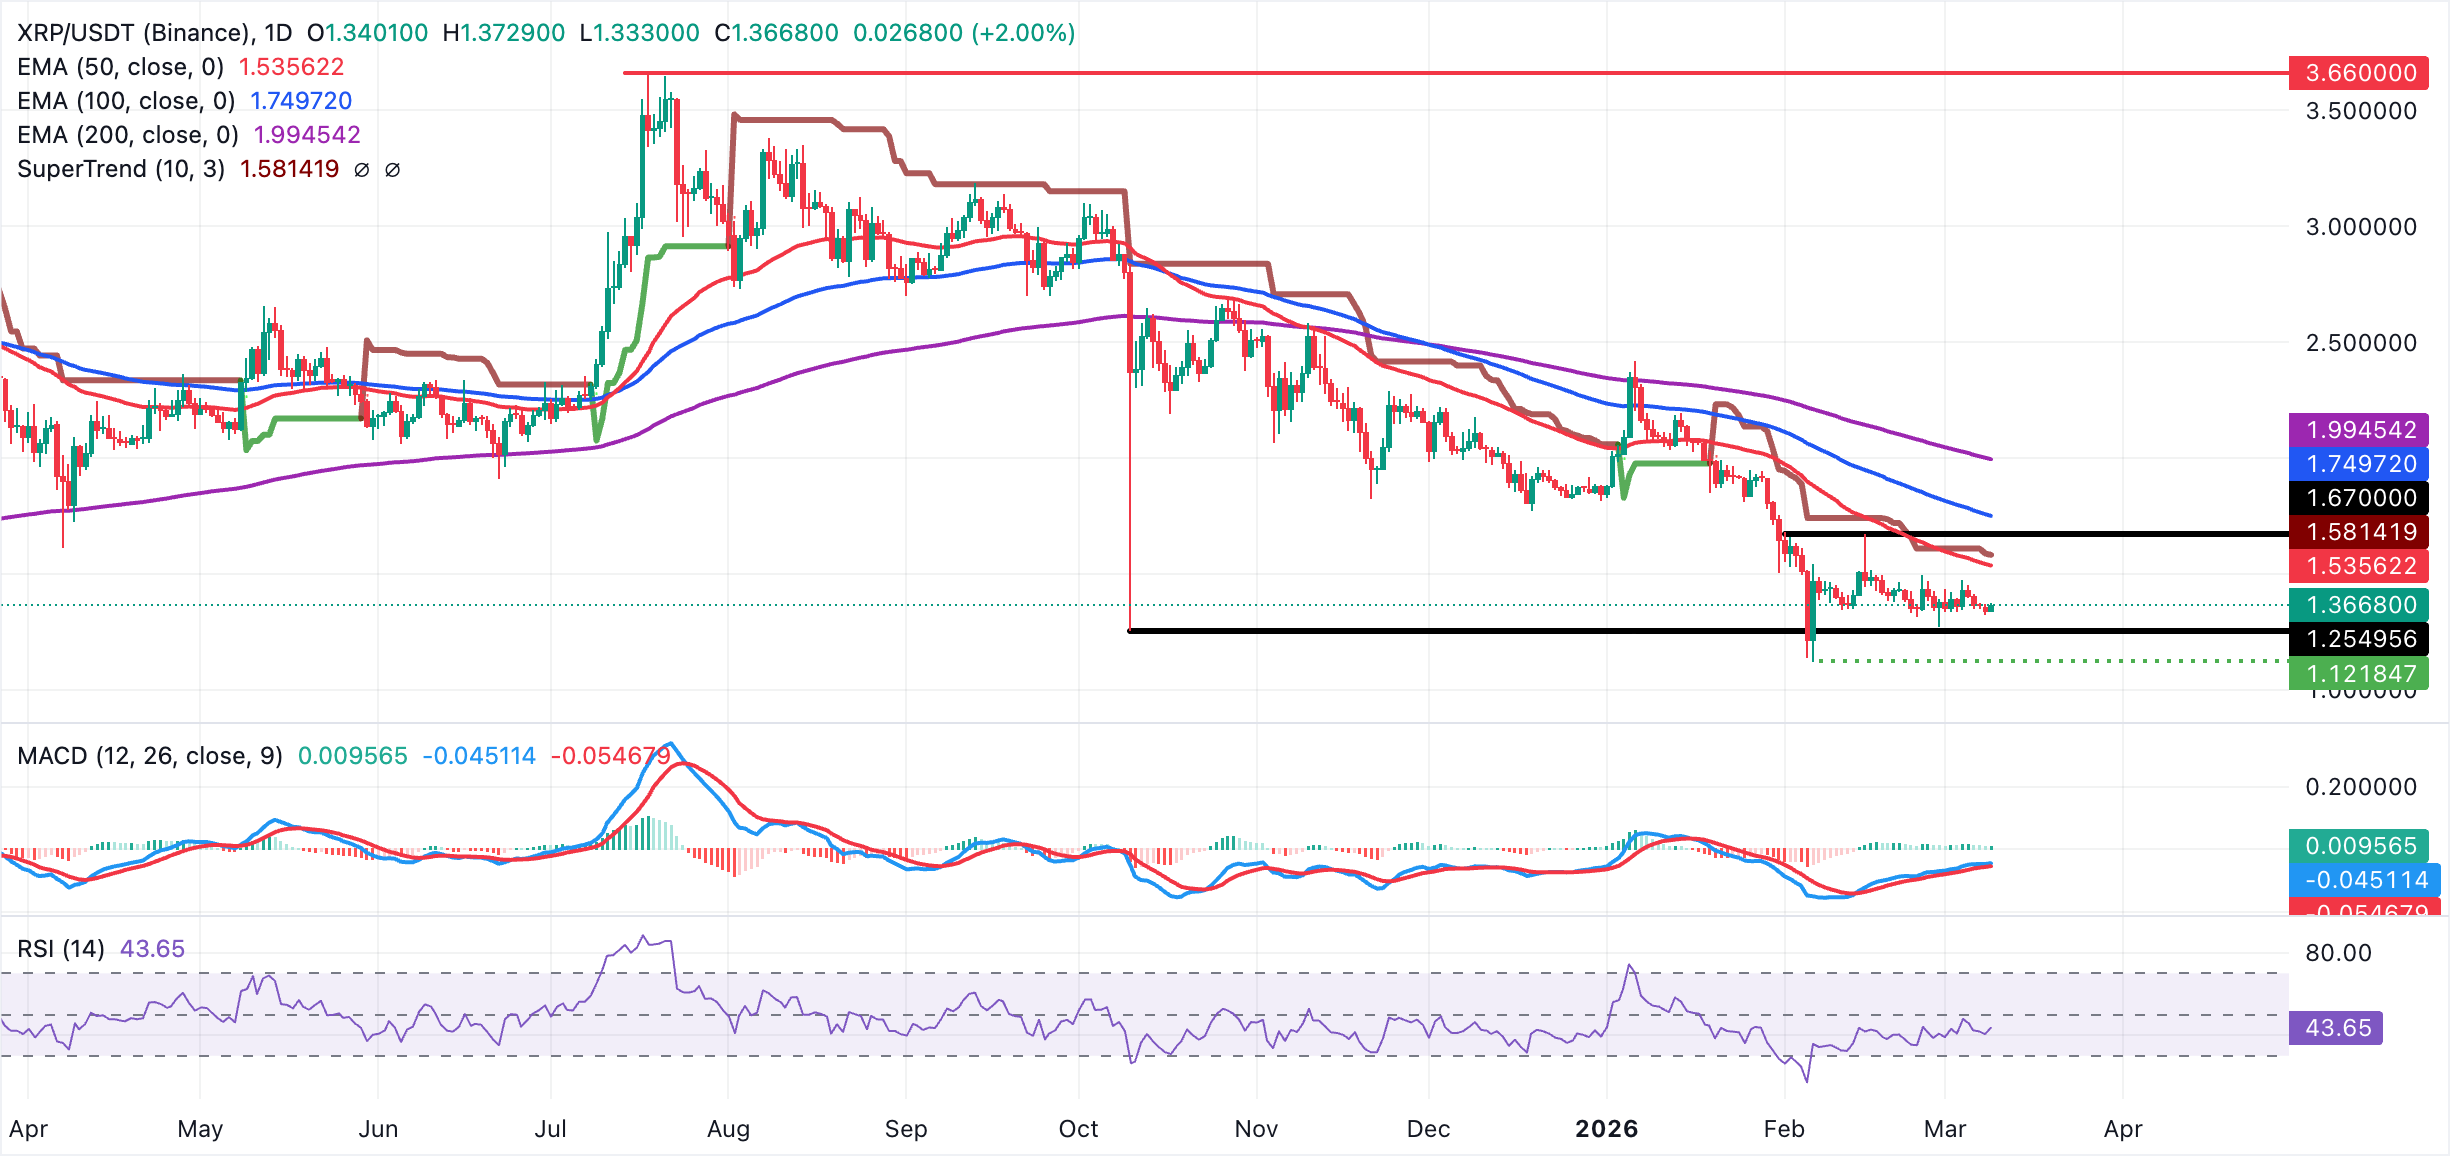
Initial resistance emerges around the $1.40 pivotal threshold, where recent intraday upticks have faded, with a stronger barrier at the 50-day EMA around $1.53 and then the SuperTrend indicator's region. A sustained break above $1.58 would be needed to challenge the broader bearish narrative and expose the 100-day EMA zone at $1.75.
On the downside, initial support emerges at the daily low near $1.33, with a break opening the way toward the February 28 trough at $1.27.
Crypto ETF FAQs
An Exchange-Traded Fund (ETF) is an investment vehicle or an index that tracks the price of an underlying asset. ETFs can not only track a single asset, but a group of assets and sectors. For example, a Bitcoin ETF tracks Bitcoin’s price. ETF is a tool used by investors to gain exposure to a certain asset.
Yes. The first Bitcoin futures ETF in the US was approved by the US Securities & Exchange Commission in October 2021. A total of seven Bitcoin futures ETFs have been approved, with more than 20 still waiting for the regulator’s permission. The SEC says that the cryptocurrency industry is new and subject to manipulation, which is why it has been delaying crypto-related futures ETFs for the last few years.
Yes. The SEC approved in January 2024 the listing and trading of several Bitcoin spot Exchange-Traded Funds, opening the door to institutional capital and mainstream investors to trade the main crypto currency. The decision was hailed by the industry as a game changer.
The main advantage of crypto ETFs is the possibility of gaining exposure to a cryptocurrency without ownership, reducing the risk and cost of holding the asset. Other pros are a lower learning curve and higher security for investors since ETFs take charge of securing the underlying asset holdings. As for the main drawbacks, the main one is that as an investor you can’t have direct ownership of the asset, or, as they say in crypto, “not your keys, not your coins.” Other disadvantages are higher costs associated with holding crypto since ETFs charge fees for active management. Finally, even though investing in ETFs reduces the risk of holding an asset, price swings in the underlying cryptocurrency are likely to be reflected in the investment vehicle too.
(The technical analysis of this story was written with the help of an AI tool.)
Bài viết đề xuất


