

Crypto Today: Bitcoin, Ethereum, XRP hold key support as institutional interest cools
- Bitcoin steadies above $70,000 as risk-off sentiment returns, with ETF posting $228 million in outflows on Thursday.
- Ethereum remains above short-term support at $2,000, with the upper end of the range capping the upside.
- XRP remains pressured by major moving averages as ETFs break a seven-day inflow streak, with outflow totaling $6 million on Thursday.
The cryptocurrency market remains largely stable despite the raging war in the Middle East. Bitcoin (BTC) is nearing $71,000 at the time of writing on Friday, while Ethereum (ETH) holds above the immediate $2,000 support. Ripple (XRP) is steady above $1.40.
US-Iran war escalates as institutional interest resets
The United States (US)-Israel-Iran war has entered its sixth day amid growing concern for the global economy, especially as the conflict continues to impact Oil and gas operations as well as shipping routes due to the closure of the Strait of Hormuz.
Global markets are on edge, with equities and bonds falling. Despite crypto prices staying relatively stable this week, institutional interest is beginning to wobble. Bitcoin spot Exchange-Traded Funds (ETFs) recorded outflows of approximately $228 million on Thursday, breaking a three-day inflow streak. Inflows into the US-listed ETFs totalled $458 million on Monday, $225 million on Tuesday and $462 million on Wednesday.
Despite cooling interest among institutional investors, total weekly inflows are at $917 million through Thursday. Cumulative inflows stand at $55.72 billion, and net assets under management at $91.44 billion.

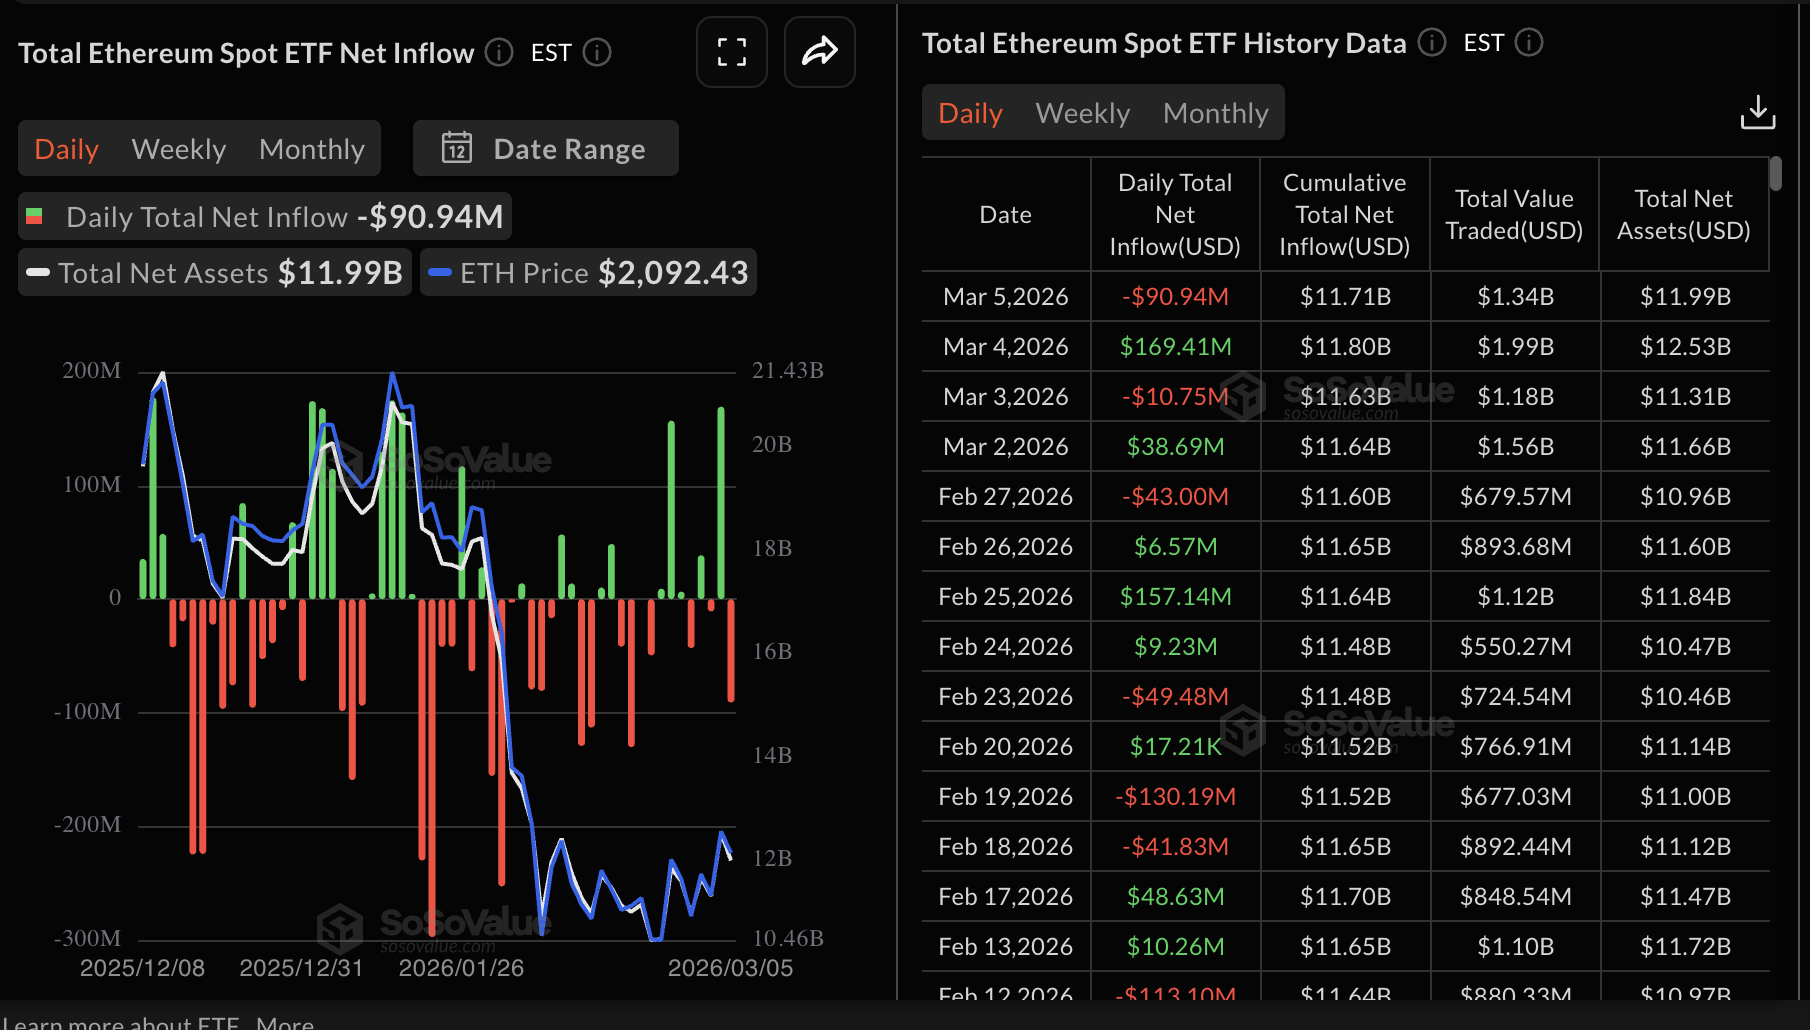
Interest in Ethereum-based spot ETFs has not been as steady as Bitcoin's, with outflows totalling $91 million on Thursday. US-listed ETH ETFs recorded inflows of $169 million on Wednesday.
On Tuesday, outflows of $11 million were recorded, while the ETFs attracted nearly $39 million in inflows on Monday. Cumulative inflows stand at $11.71 billion, and net assets under management at $11.99 billion.
XRP spot ETFs experienced outflows of approximately $6 million on Thursday, following seven days of steady inflows. The remittance token has remained resilient despite elevated volatility driven by geopolitical tensions and macroeconomic uncertainty.
Cumulative inflows stand at $1.26 billion as of Thursday, marking a slight drop from $1.26 billion on Wednesday. SoSoValue data show total net assets of $1.04 billion, down from $1.08 billion over the same period.
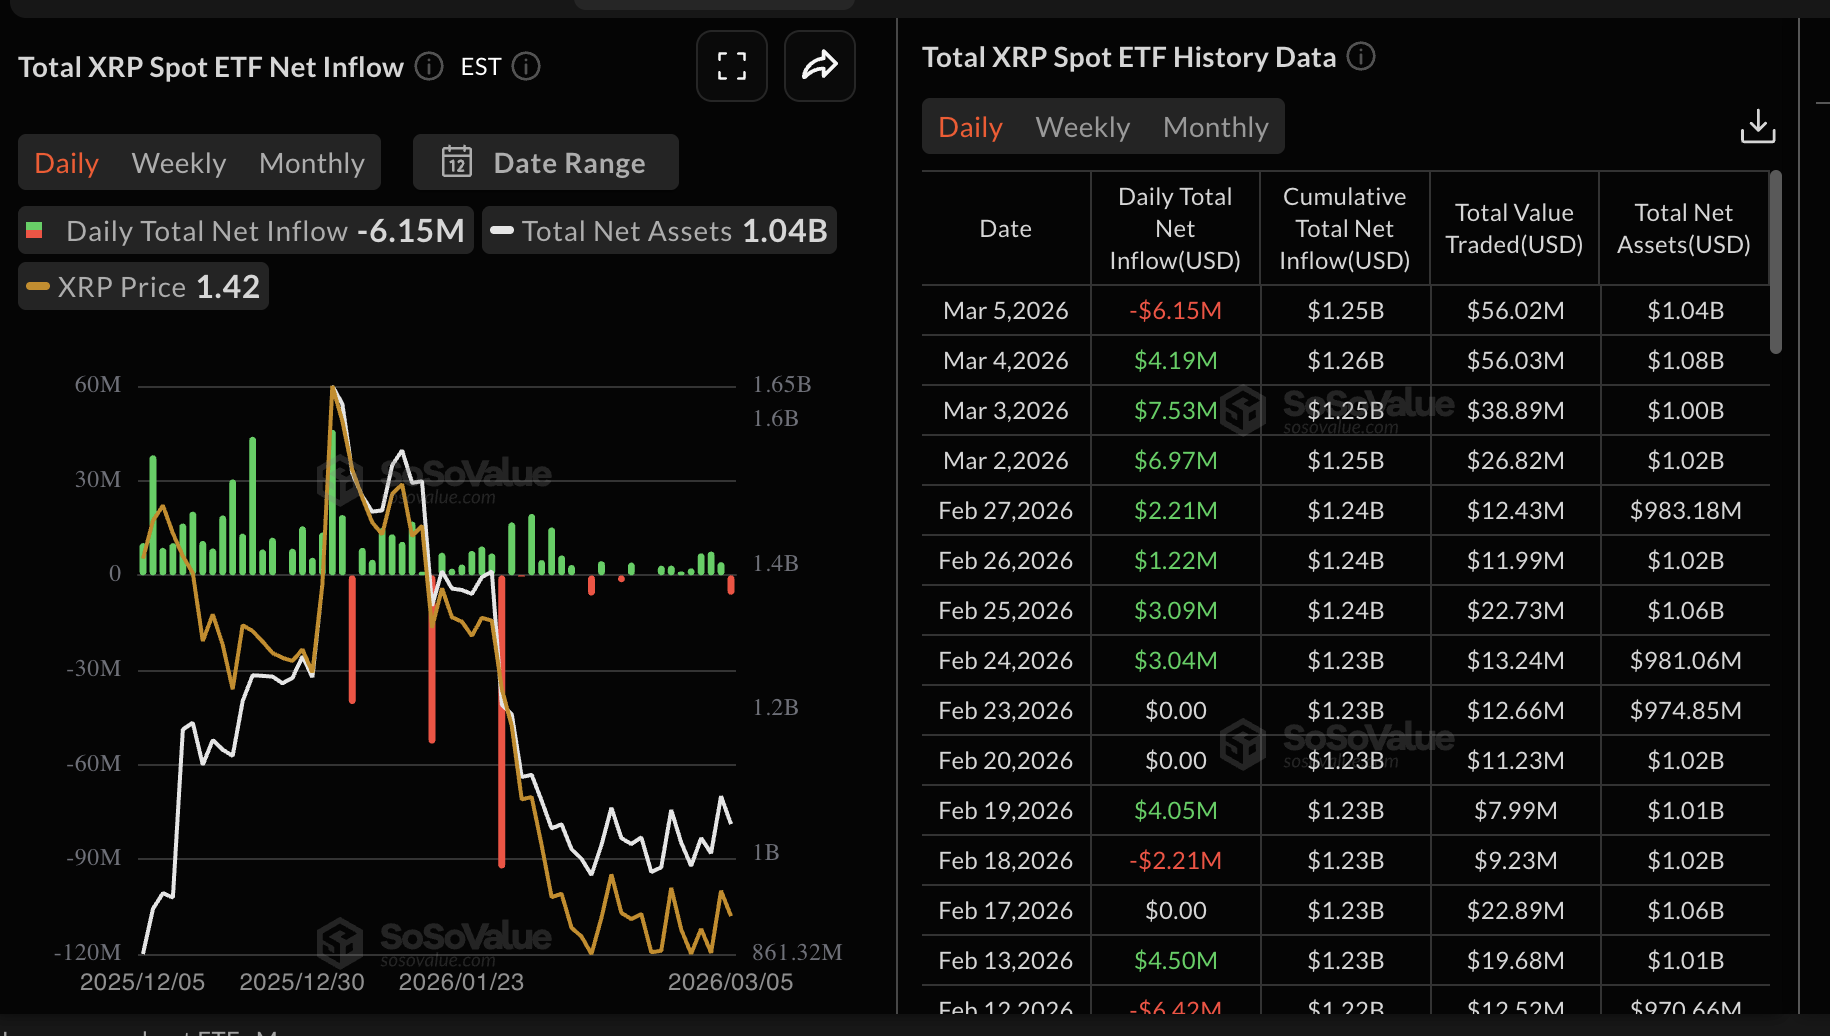
Chart of the day: Bitcoin eyes higher support
Bitcoin is trading above $70,000 but below the daily high at $71,420 at the time of writing on Friday. The near-term bias leans bullish as the price corrects from the weekly high of $74,050. The Moving Average Convergence Divergence (MACD) line remains above the signal line on the daily chart, with elevated green histogram bars, suggesting persistent upside momentum following the recent breakout phase.
At the same time, the Relative Strength Index (RSI) hovers just above 50, indicating improving but not overstretched bullish pressure that aligns with a continuation bias rather than an exhaustion phase.
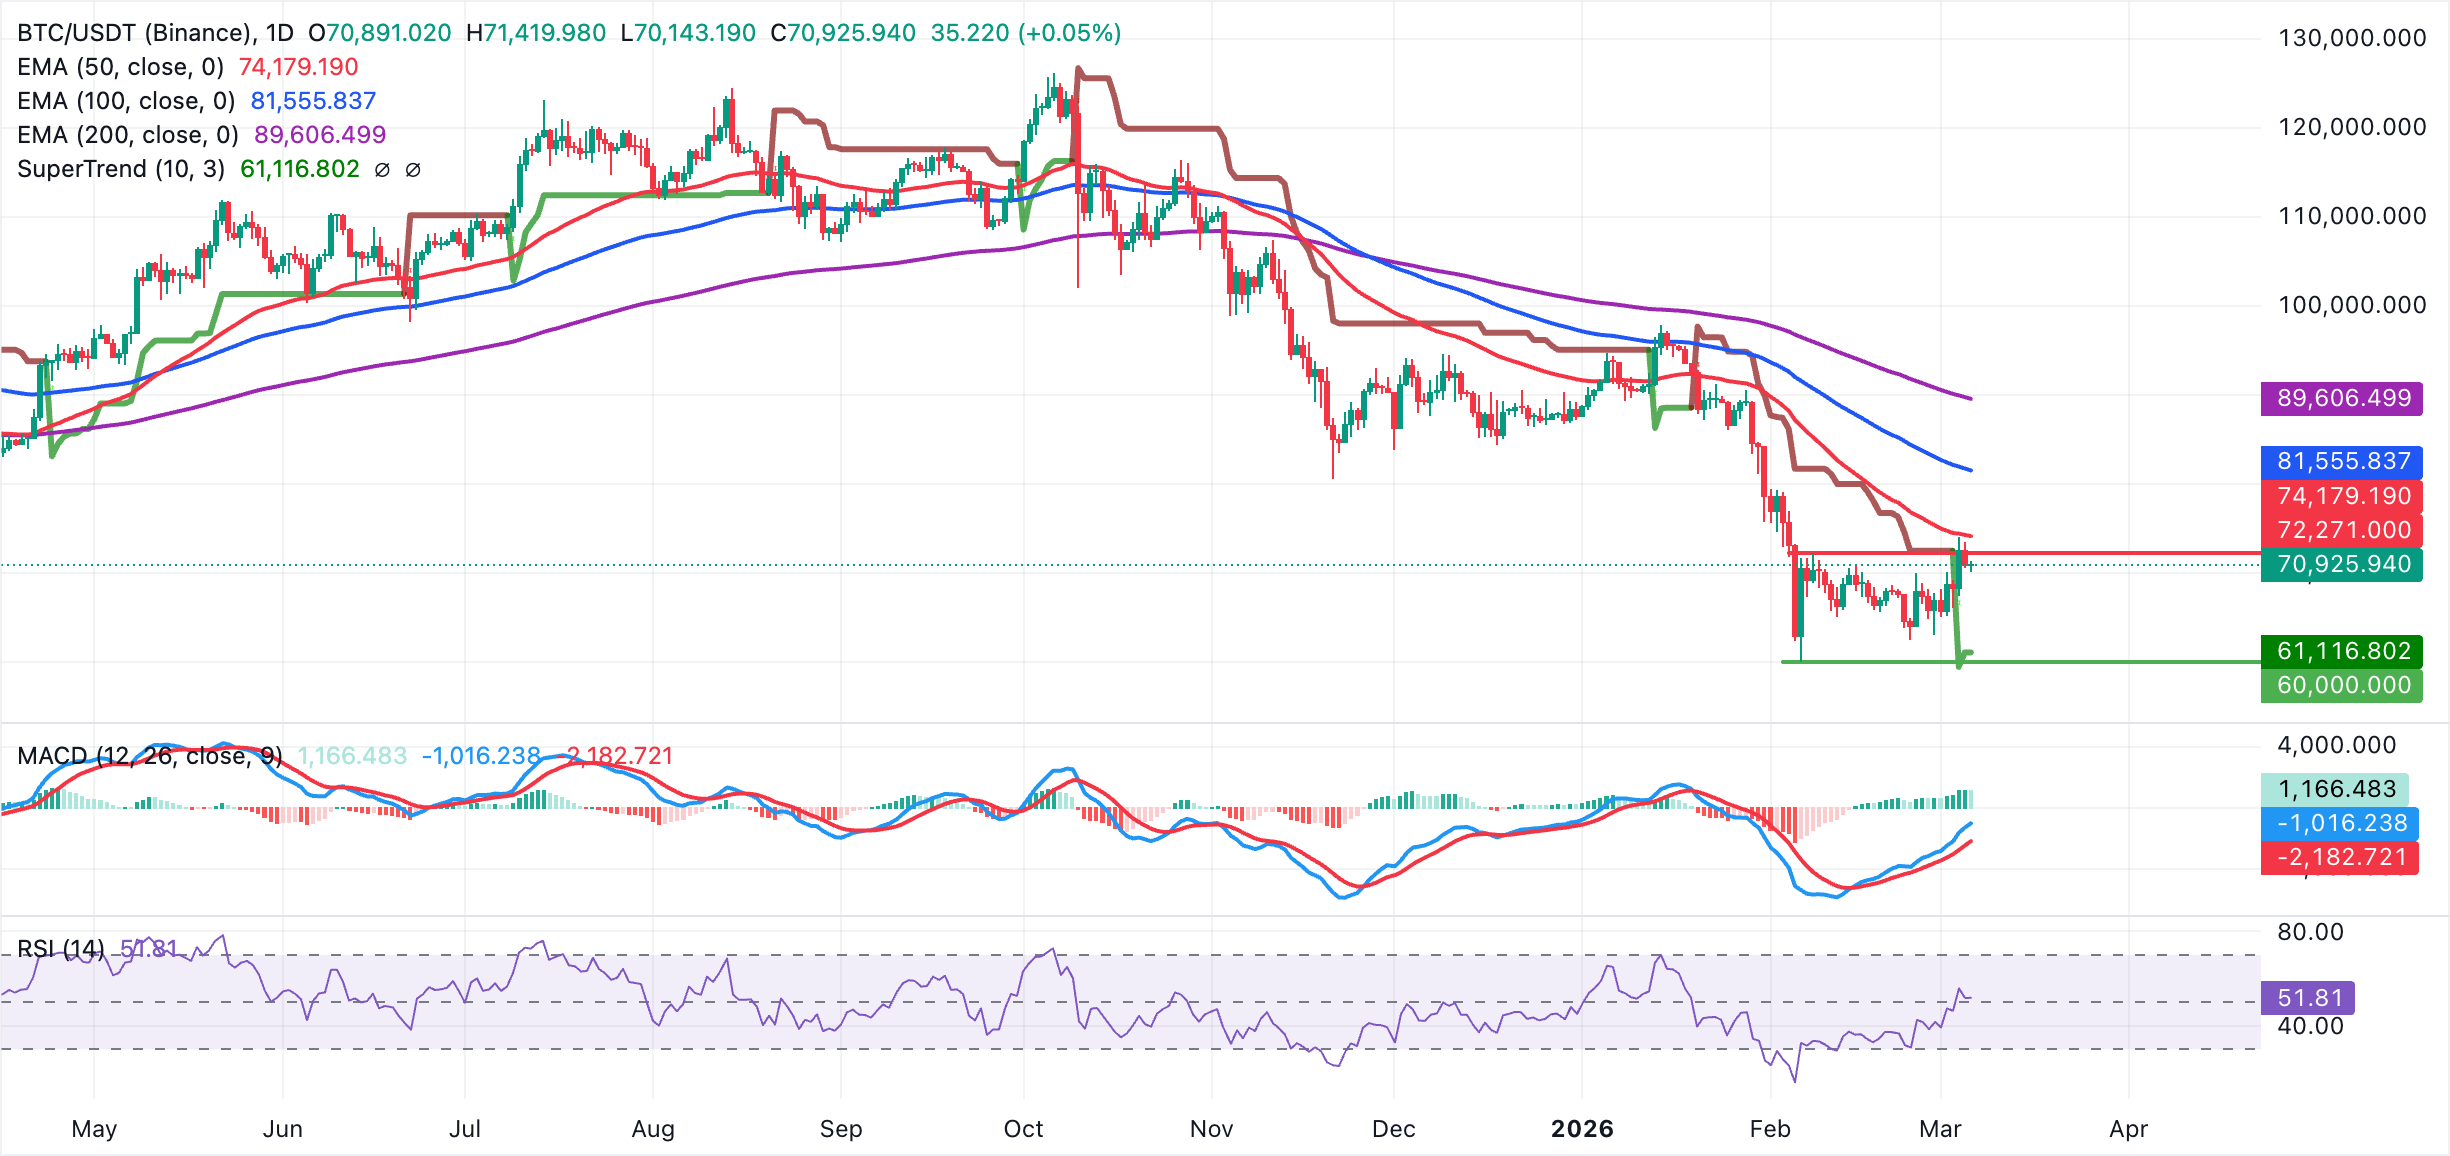
Initial support emerges around the $70,000 pivotal level, where a pullback would test the integrity of the current bullish leg. Below that demand zone, secondary support is seen around Wednesday's low at $67,400.
On the topside, the immediate resistance band aligns with the recent swing area at $74,050, with a daily close above this cap opening the way toward the 50-day Exponential Moving Average (EMA) at $74,179 and then the 100-day EMA at $81,556.
Altcoins technical outlook: Ethereum and XRP hold steady
Ethereum remains above the immediate $2,000 support threshold as it corrects from the daily high of $2,093. Despite the correction, near-term bias turns mildly bullish, supported by the MACD indicator holding above the signal line on the daily chart. Green histogram bars are steady above the zero line, which may prompt investors to increase their exposure.
The RSI hovers below the neutral level on the same chart, reflecting a cautious upside tilt rather than a confirmed trend reversal against the broader downsloping moving averages. The 50-day EMA appears to cap rebounds at $2,279 and the 100-day EMA at $2,617. A daily close below the immediate support at $2,000 would expose Ethereum to deeper losses, targeting the range low support at $1,800.
-1772792715584-1772792715587.png)
As for XRP, the price holds above $1.40, with near-term bias remaining cautiously bullish. The MACD indicator holds above the signal line on the daily chart amid steady green histogram bars, confirming the mild bullish outlook. Major moving averages, including the 50-day EMA, the 100-day EMA and the 200-day EMA, which are clustered between $1.56 and $2.01, are sloping lower and keeping the overall trend bearish.
A decisive break above the 50-day EMA could reinforce the bullish grip and increase the odds of an extended breakout past the range high hurdle at $1.67.
-1772793425355-1772793425360.png)
On the downside, immediate support is at $1.40, the latest reaction floor, followed by Wednesday's low at $1.35, where a breakdown would reopen the path toward the $1.25 zone, aligning with the October 10 support.
Crypto ETF FAQs
An Exchange-Traded Fund (ETF) is an investment vehicle or an index that tracks the price of an underlying asset. ETFs can not only track a single asset, but a group of assets and sectors. For example, a Bitcoin ETF tracks Bitcoin’s price. ETF is a tool used by investors to gain exposure to a certain asset.
Yes. The first Bitcoin futures ETF in the US was approved by the US Securities & Exchange Commission in October 2021. A total of seven Bitcoin futures ETFs have been approved, with more than 20 still waiting for the regulator’s permission. The SEC says that the cryptocurrency industry is new and subject to manipulation, which is why it has been delaying crypto-related futures ETFs for the last few years.
Yes. The SEC approved in January 2024 the listing and trading of several Bitcoin spot Exchange-Traded Funds, opening the door to institutional capital and mainstream investors to trade the main crypto currency. The decision was hailed by the industry as a game changer.
The main advantage of crypto ETFs is the possibility of gaining exposure to a cryptocurrency without ownership, reducing the risk and cost of holding the asset. Other pros are a lower learning curve and higher security for investors since ETFs take charge of securing the underlying asset holdings. As for the main drawbacks, the main one is that as an investor you can’t have direct ownership of the asset, or, as they say in crypto, “not your keys, not your coins.” Other disadvantages are higher costs associated with holding crypto since ETFs charge fees for active management. Finally, even though investing in ETFs reduces the risk of holding an asset, price swings in the underlying cryptocurrency are likely to be reflected in the investment vehicle too.
(The technical analysis of this story was written with the help of an AI tool.)
Bài viết đề xuất


