


Meme Coins Price Prediction: Dogecoin, Shiba Inu, and Pepe show bearish signals at key levels
- Dogecoin price hovers around key support at $0.091, with neutral near-term biasand a slight bearish tilt.
- Shiba Inu momentum indicators show bearish momentum gaining traction.
- Pepe price trades at $0.0000034 on Monday after falling over 15% in the previous week.
Meme coins are hovering around key support zones at the start of this week on Monday, after extending losses in the previous week. Dogecoin (DOGE) signals a neutral near-term bias with a slight bearish tilt. Meanwhile, Shiba Inu (SHIB) and Pepe (PEPE) traders should be cautious as technical indicators show bearish momentum gaining traction. In addition, the broader market sentiment remains risk-off, as the escalating military aggression in the Middle East over the weekend continues to weigh on the crypto market.
Dogecoin shows a slight bearish tilt
Dogecoin is trading at $0.093 as of writing on Monday. The near-term bias is neutral with a slight bearish tilt, as price holds well below the 50- and 100-day Exponential Moving Averages (EMAs) clustered around $0.108–$0.125, keeping the broader downtrend intact. The pair continues to trade under the long-running descending resistance trend line from $0.218, reinforcing overhead supply despite the recent bounce from sub-$0.091 levels.
Momentum remains subdued, with the Relative Strength Index (RSI) on the daily chart recovering from oversold territory but still hovering in the low-40s, while the Moving Average Convergence Divergence (MACD) line stays marginally above the signal line around the zero area, hinting at fragile upside pressure within a corrective phase rather than a confirmed trend reversal.
Immediate support is seen at the horizontal level of $0.091, which aligns just above the 23.6% Fibonacci retracement at $0.091 measured from the $0.080 low to the $0.127 high, forming a key floor for the current consolidation.
A daily close below this band would expose the lower retracement zone and refocus attention on the $0.080 swing low.
On the topside, initial resistance emerges near the 38.2% retracement at $0.098, ahead of the more important barrier at the 50% retracement at $0.103, where the declining moving averages start to weigh.
A sustained break above $0.103 would open the path toward the 61.8% level at $0.109, but as long as the price trades beneath the $0.124 horizontal resistance and the descending trend line, rallies remain vulnerable to renewed selling.
Shiba Inu bears aiming for February 6 lows
Shiba Inu price was rejected around the weekly resistance level of $0.0000068 in mid-February and then declined by over 22% over the next two weeks. As of Monday, SHIB is trading at $0.0000056.
If SHIB continues its downward trend, it could extend the correction toward the February 6 low of $0.0000050.
The RSI on the daily chart stands at 37, below the neutral 50 level, indicating bearish momentum is gaining traction. Moreover, the MACD showed a bearish crossover on Saturday, further supporting the negative outlook.
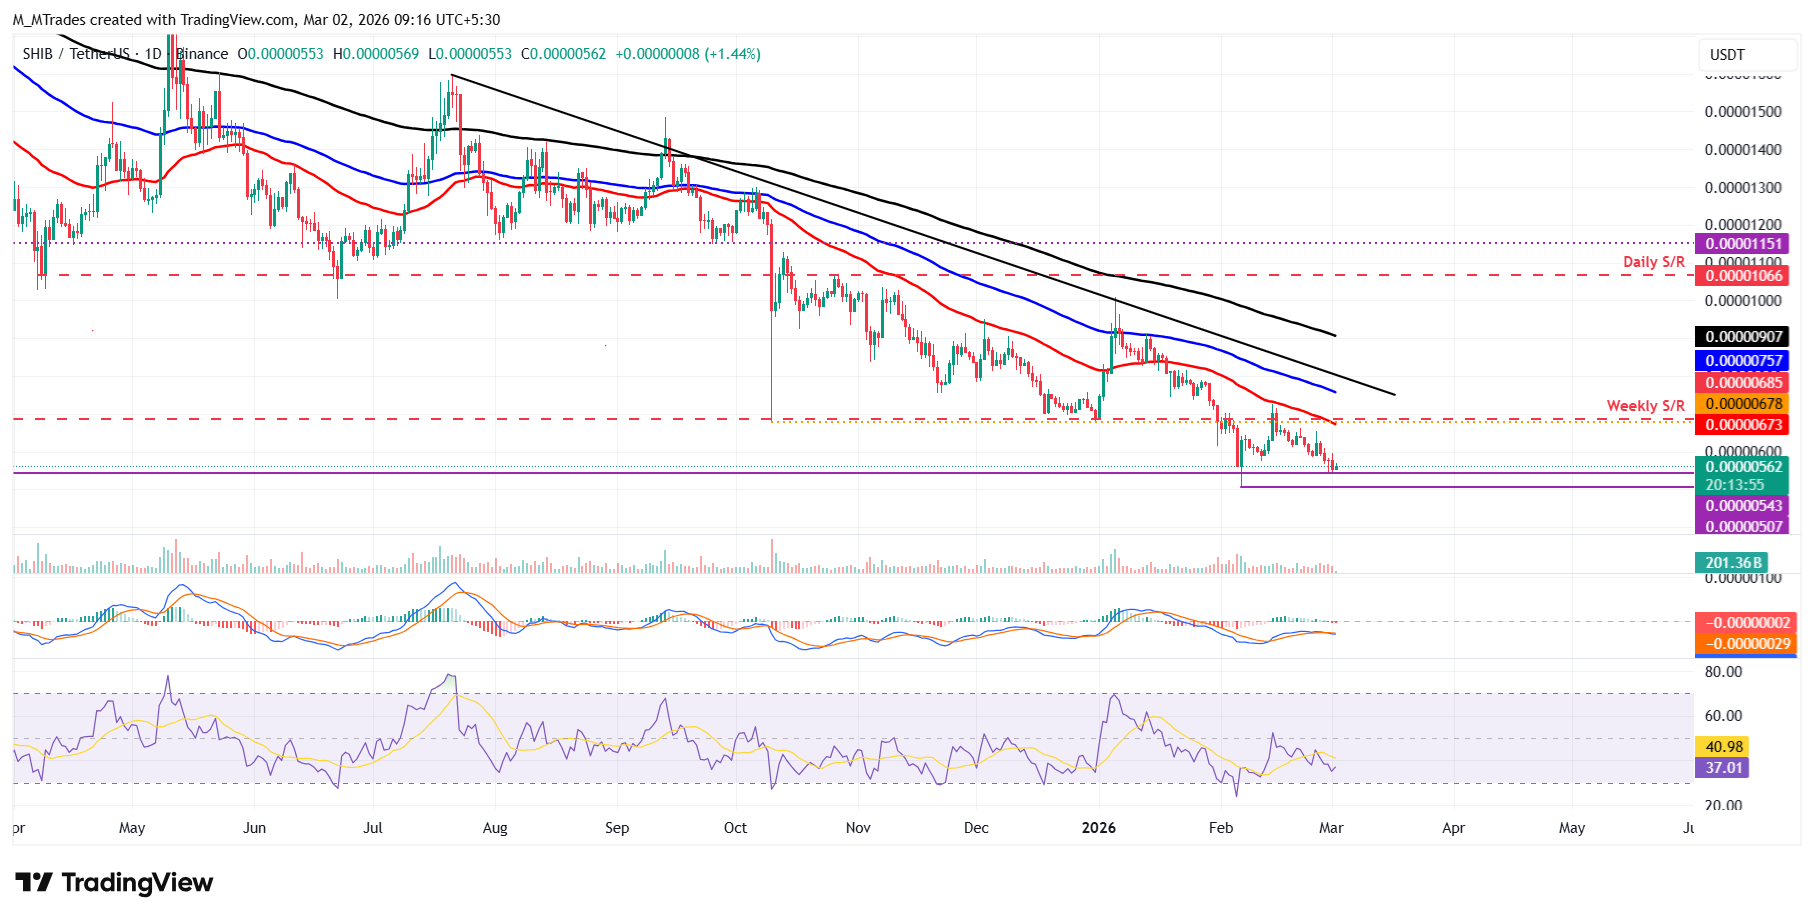
However, if SHIB recovers, it could extend the advance toward the weekly resistance at $0.0000067.
Pepe momentum indicators show bearish signs
Pepe price was rejected from the 50-day EMA at $0.0000043 on Wednesday and declined by over 17% through Sunday. As of writing, PEPE is trading at $0.0000034.
If PEPE continues its correction, it could extend the decline toward the February 6 low of $0.0000031.
Like Shiba Inu, PEPE's momentum indicators, RSI and MACD, also support a negative outlook.
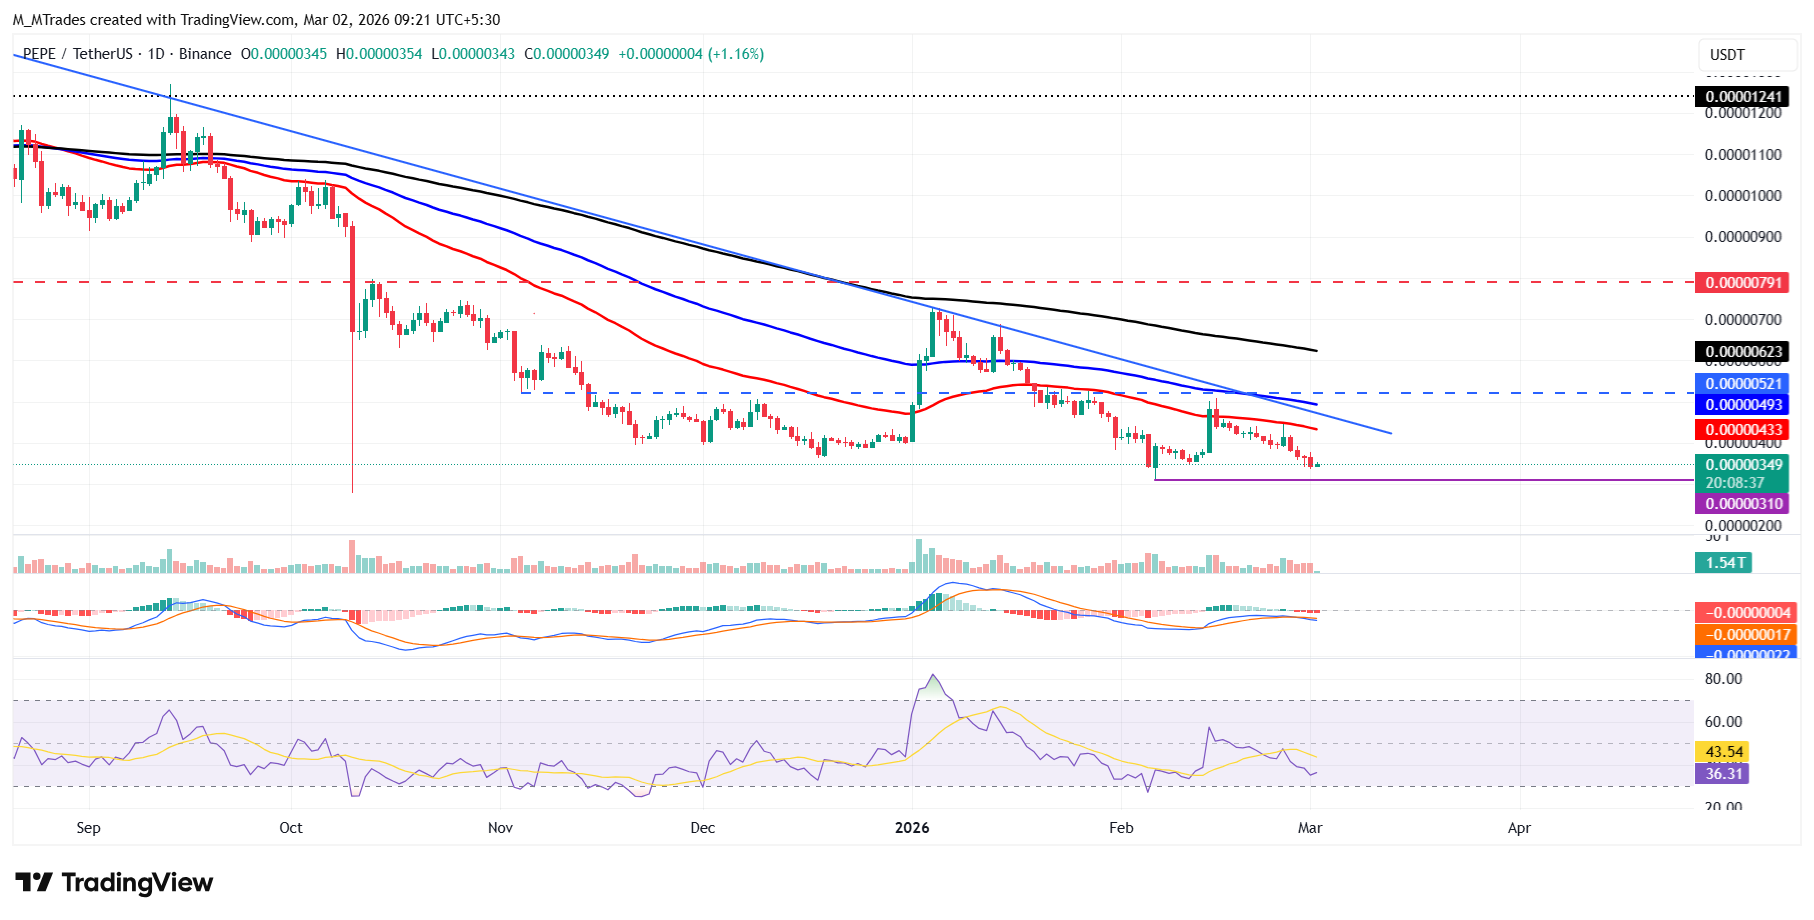
Conversely, if PEPE recovers, it could extend the advance toward the 50-day EMA at $0.0000043.
(The technical analysis of this story was written with the help of an AI tool.)
Bài viết đề xuất


