

Crypto Today: Bitcoin, Ethereum, XRP extend consolidation amid shrinking ETF balances
- Bitcoin holds in a narrow range with support at $65,118 and resistance at $72,271 amid persistent ETF outflows.
- Ethereum’s sideways action signals stability ahead of a potential breakout supported by an improving technical picture.
- XRP has stabilized after retesting the $1.40 support level, but further upside remains constrained amid risk-off sentiment.
The cryptocurrency market is trading amid mixed signals, with major coins such as Bitcoin (BTC), Ethereum (ETH) and Ripple (XRP) showing subtle but broader risk-off sentiment, and keeping investors on the sidelines.
Bitcoin holds steadily around $67,000 at the time of writing on Thursday, but its upside appears limited by resistance at $72,271, which aligns with the February 8 high. Ethereum’s attempt to sustain price action above the psychological $2,000 level failed to gain traction on Wednesday, resulting in a minor correction and is trading around $1,972.
Meanwhile, XRP remains above support at $1.40, weighed down by swelling bearish momentum and risk-off sentiment.
Bitcoin, Ethereum, XRP recovery in jeopardy amid ETF outflows
Bitcoin is stable at the upper end of the $ 60,000 range, despite its upside appearing limited due to seller congestion around the $70,000 threshold. The Exchange-Traded Funds’ (ETFs) market reflects the doldrums in sentiment, as outflows persist for the second consecutive day.
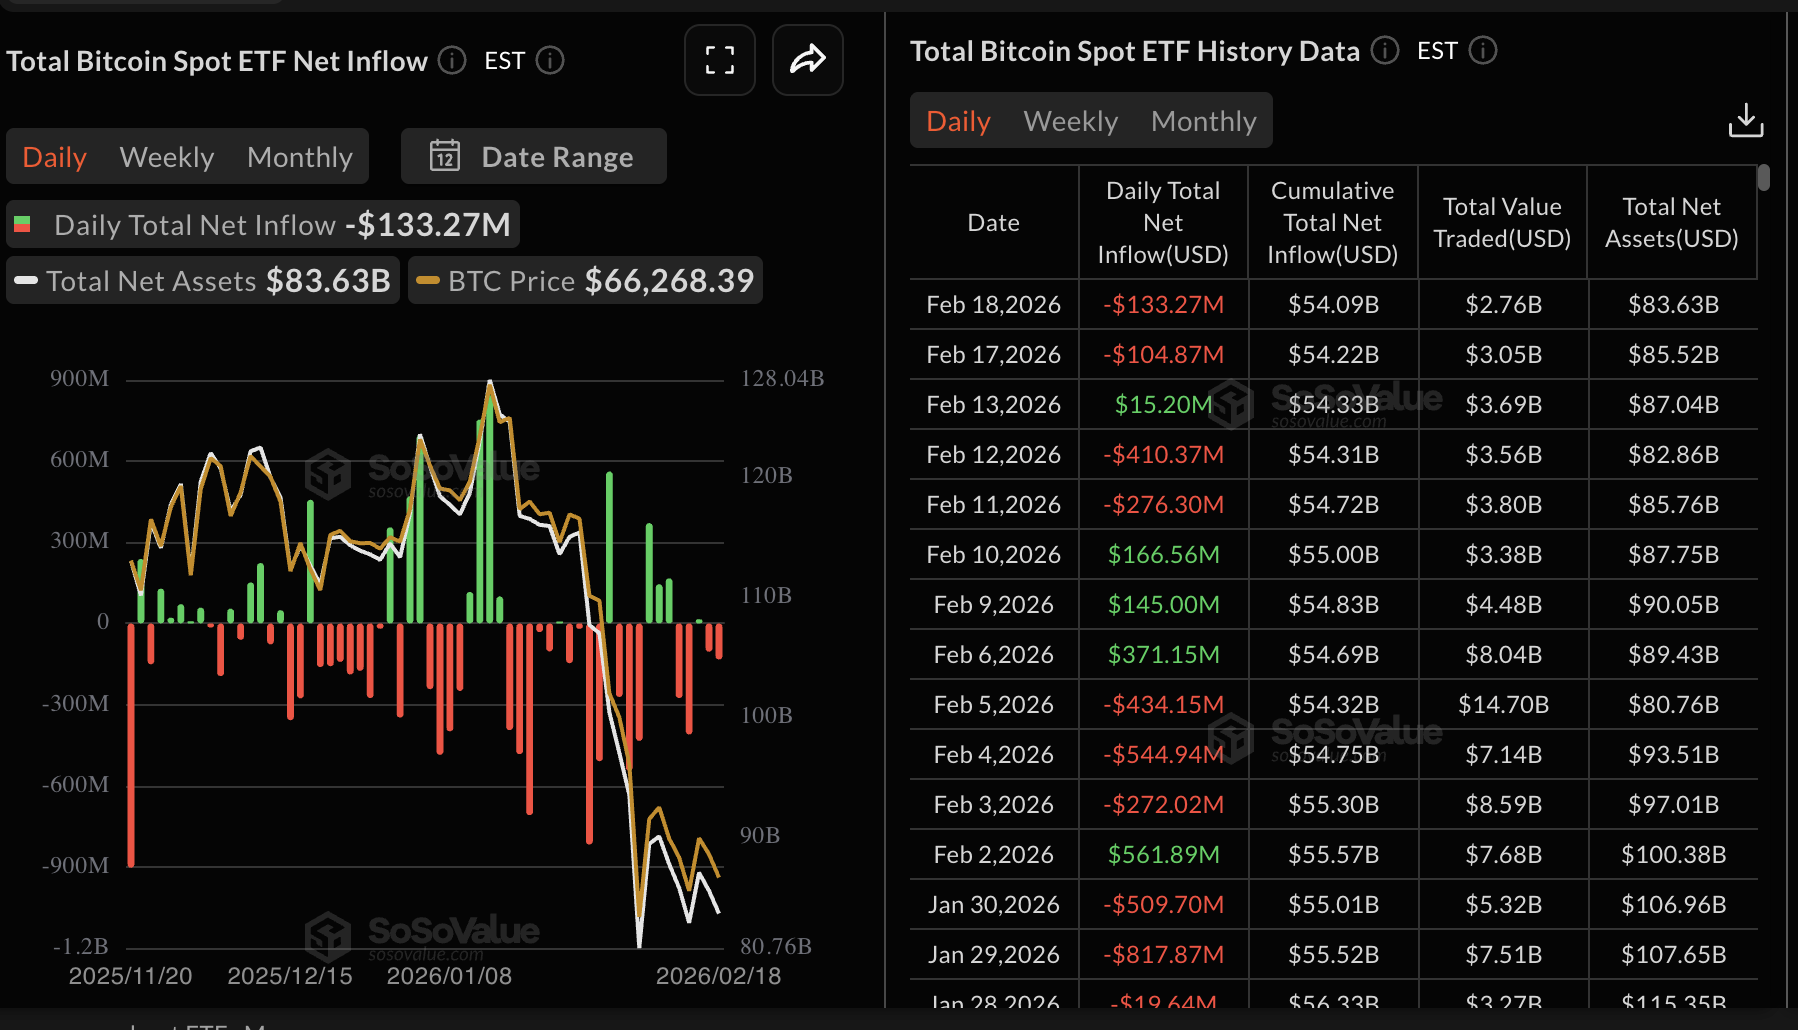
BTC spot ETFs recorded approximately $133 million in outflows on Wednesday, according to SoSoValue data.
Zooming out, total net assets reached a record $170 billion in October and have gradually declined to $83.63 billion, indicating that risk appetite has faded. Cumulative inflows stand at approximately $54.1 billion. Such a persistent decline negatively affects sentiment, making it difficult for Bitcoin to sustain an uptrend.
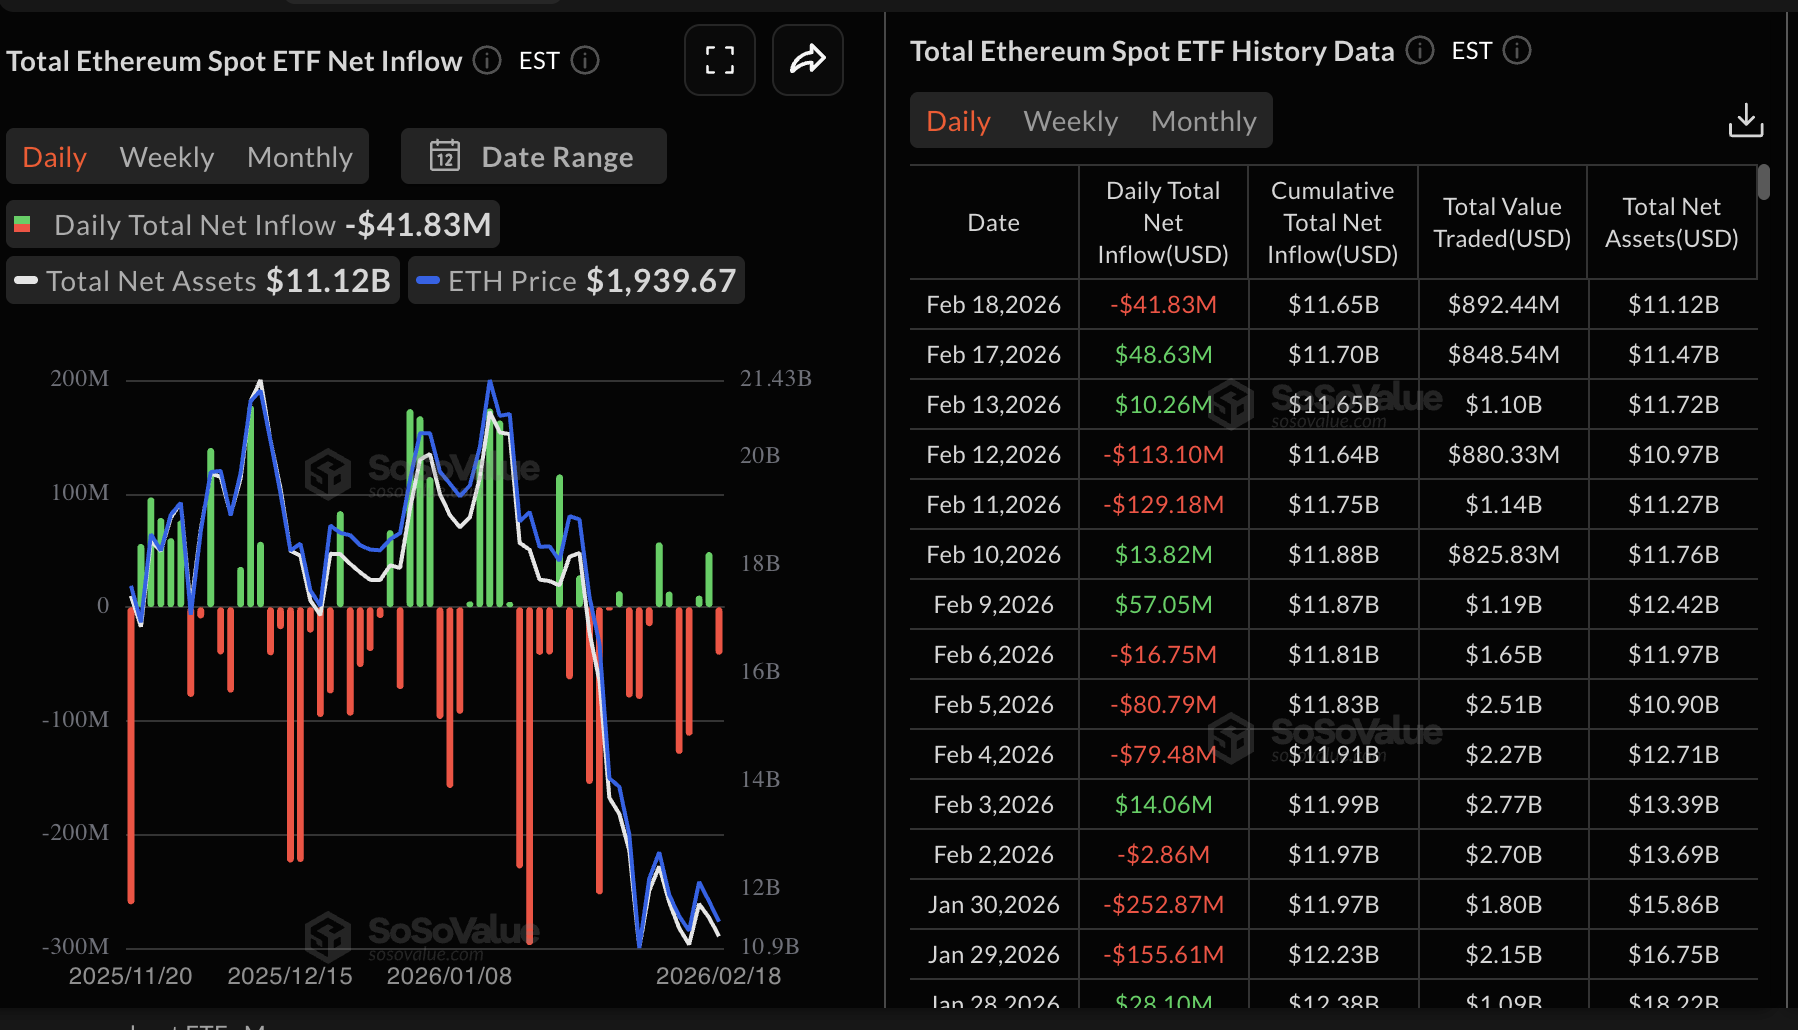
Ethereum spot ETFs face similar headwinds as Bitcoin, suggesting that investors are continually rebalancing their portfolios. The leading altcoin recorded nearly $42 million in total outflows on Wednesday, bringing cumulative inflows to $11.65 billion. Meanwhile, assets under management average $11.12 billion, which is significantly lower than the record high of $25.71 billion reached in August.
Meanwhile, for XRP spot ETFs, outflows resumed on Wednesday at approximately $2.2 million following muted activity on Tuesday. Cumulative inflows remain at $1.23 billion, while net assets under management decline to $1.02 billion from $1.06 billion on Tuesday.
In line with Bitcoin and Ethereum, total assets in XRP-related ETFs have also fallen sharply, from a record high of $1.65 billion on January 5, suggesting that interest in risk assets continues to deteriorate.
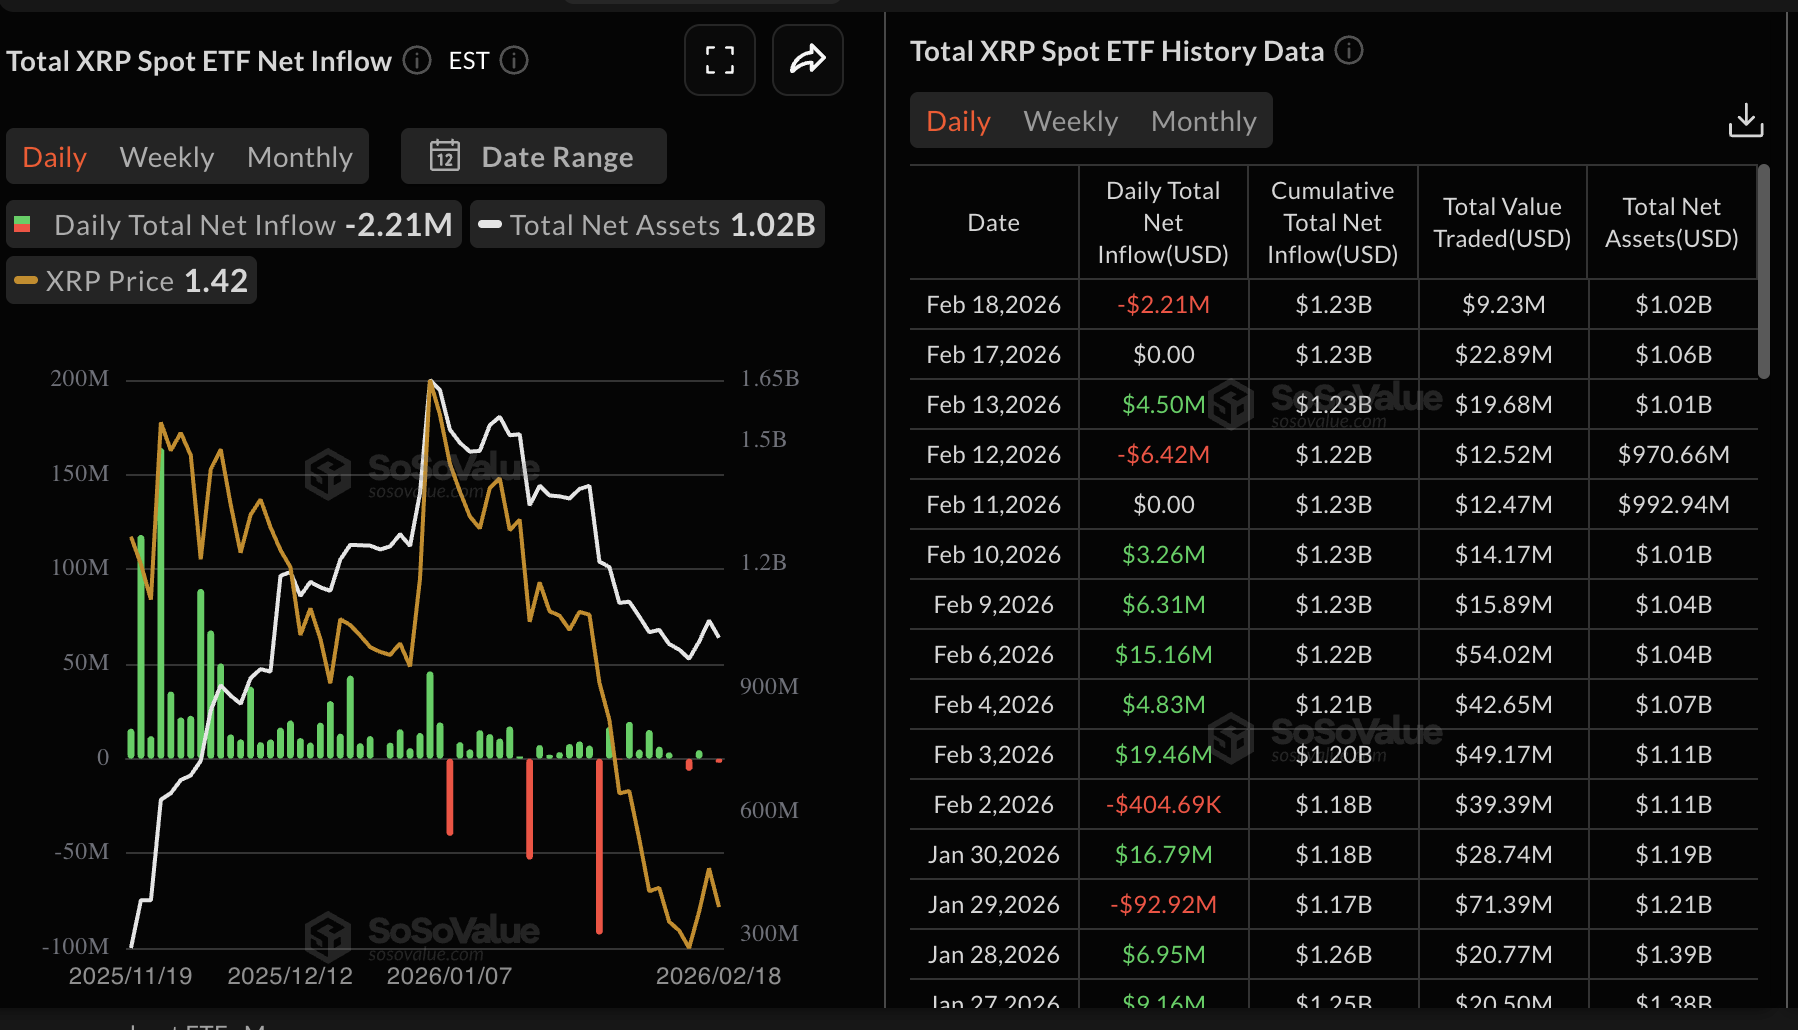
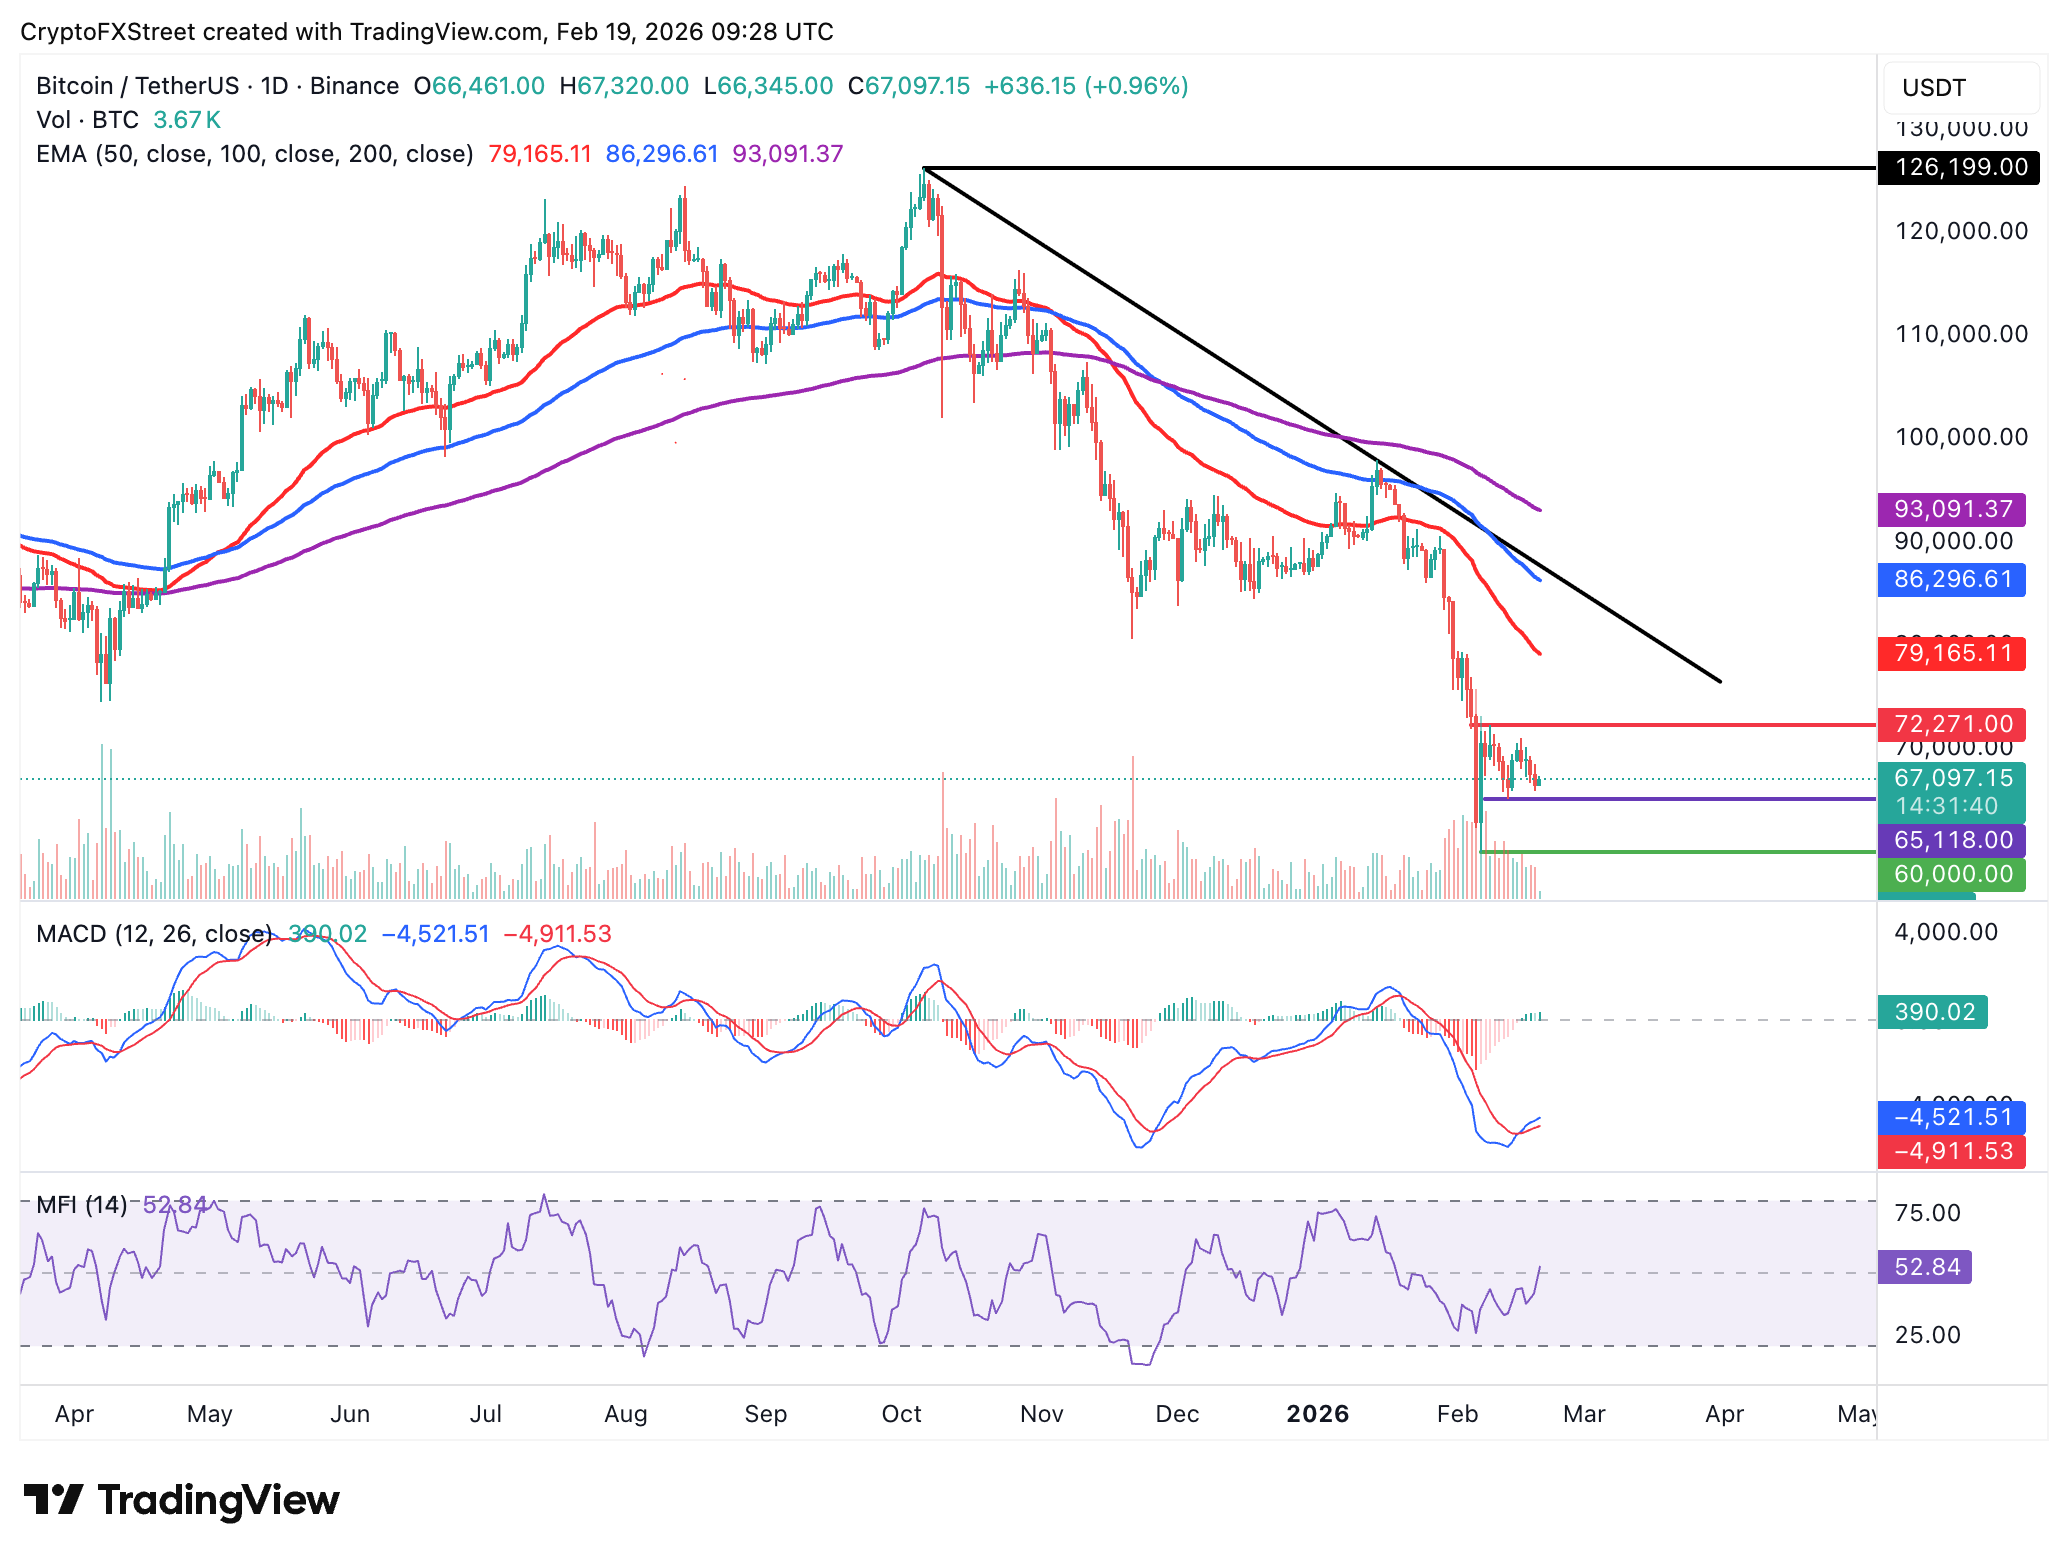
Chart of the day: Assessing Bitcoin’s breakout strength
Bitcoin remains in a robust range, with the lower end supported at $65,118, and the upside appears limited by a high seller concentration at $72,271.
Despite the price fluctuations, the Moving Average Convergence Divergence (MACD) indicator remains above its signal line on the daily chart. Moreover, expanding green histogram bars encourage traders to seek exposure.
The Money Flow Index (MFI), an indicator that tracks the money flowing in and out of Bitcoin, has rebounded to 52, suggesting that bulls have the upper hand. A further increase in the MFI would help steady bullish momentum and increase the odds of BTC’s breakout above the $72,271 hurdle.
Still, a daily close below the $65,118 support, tested last Thursday, could accelerate the downtrend toward $60,000.
Altcoins technical outlook: Ethereum, XRP hold key support
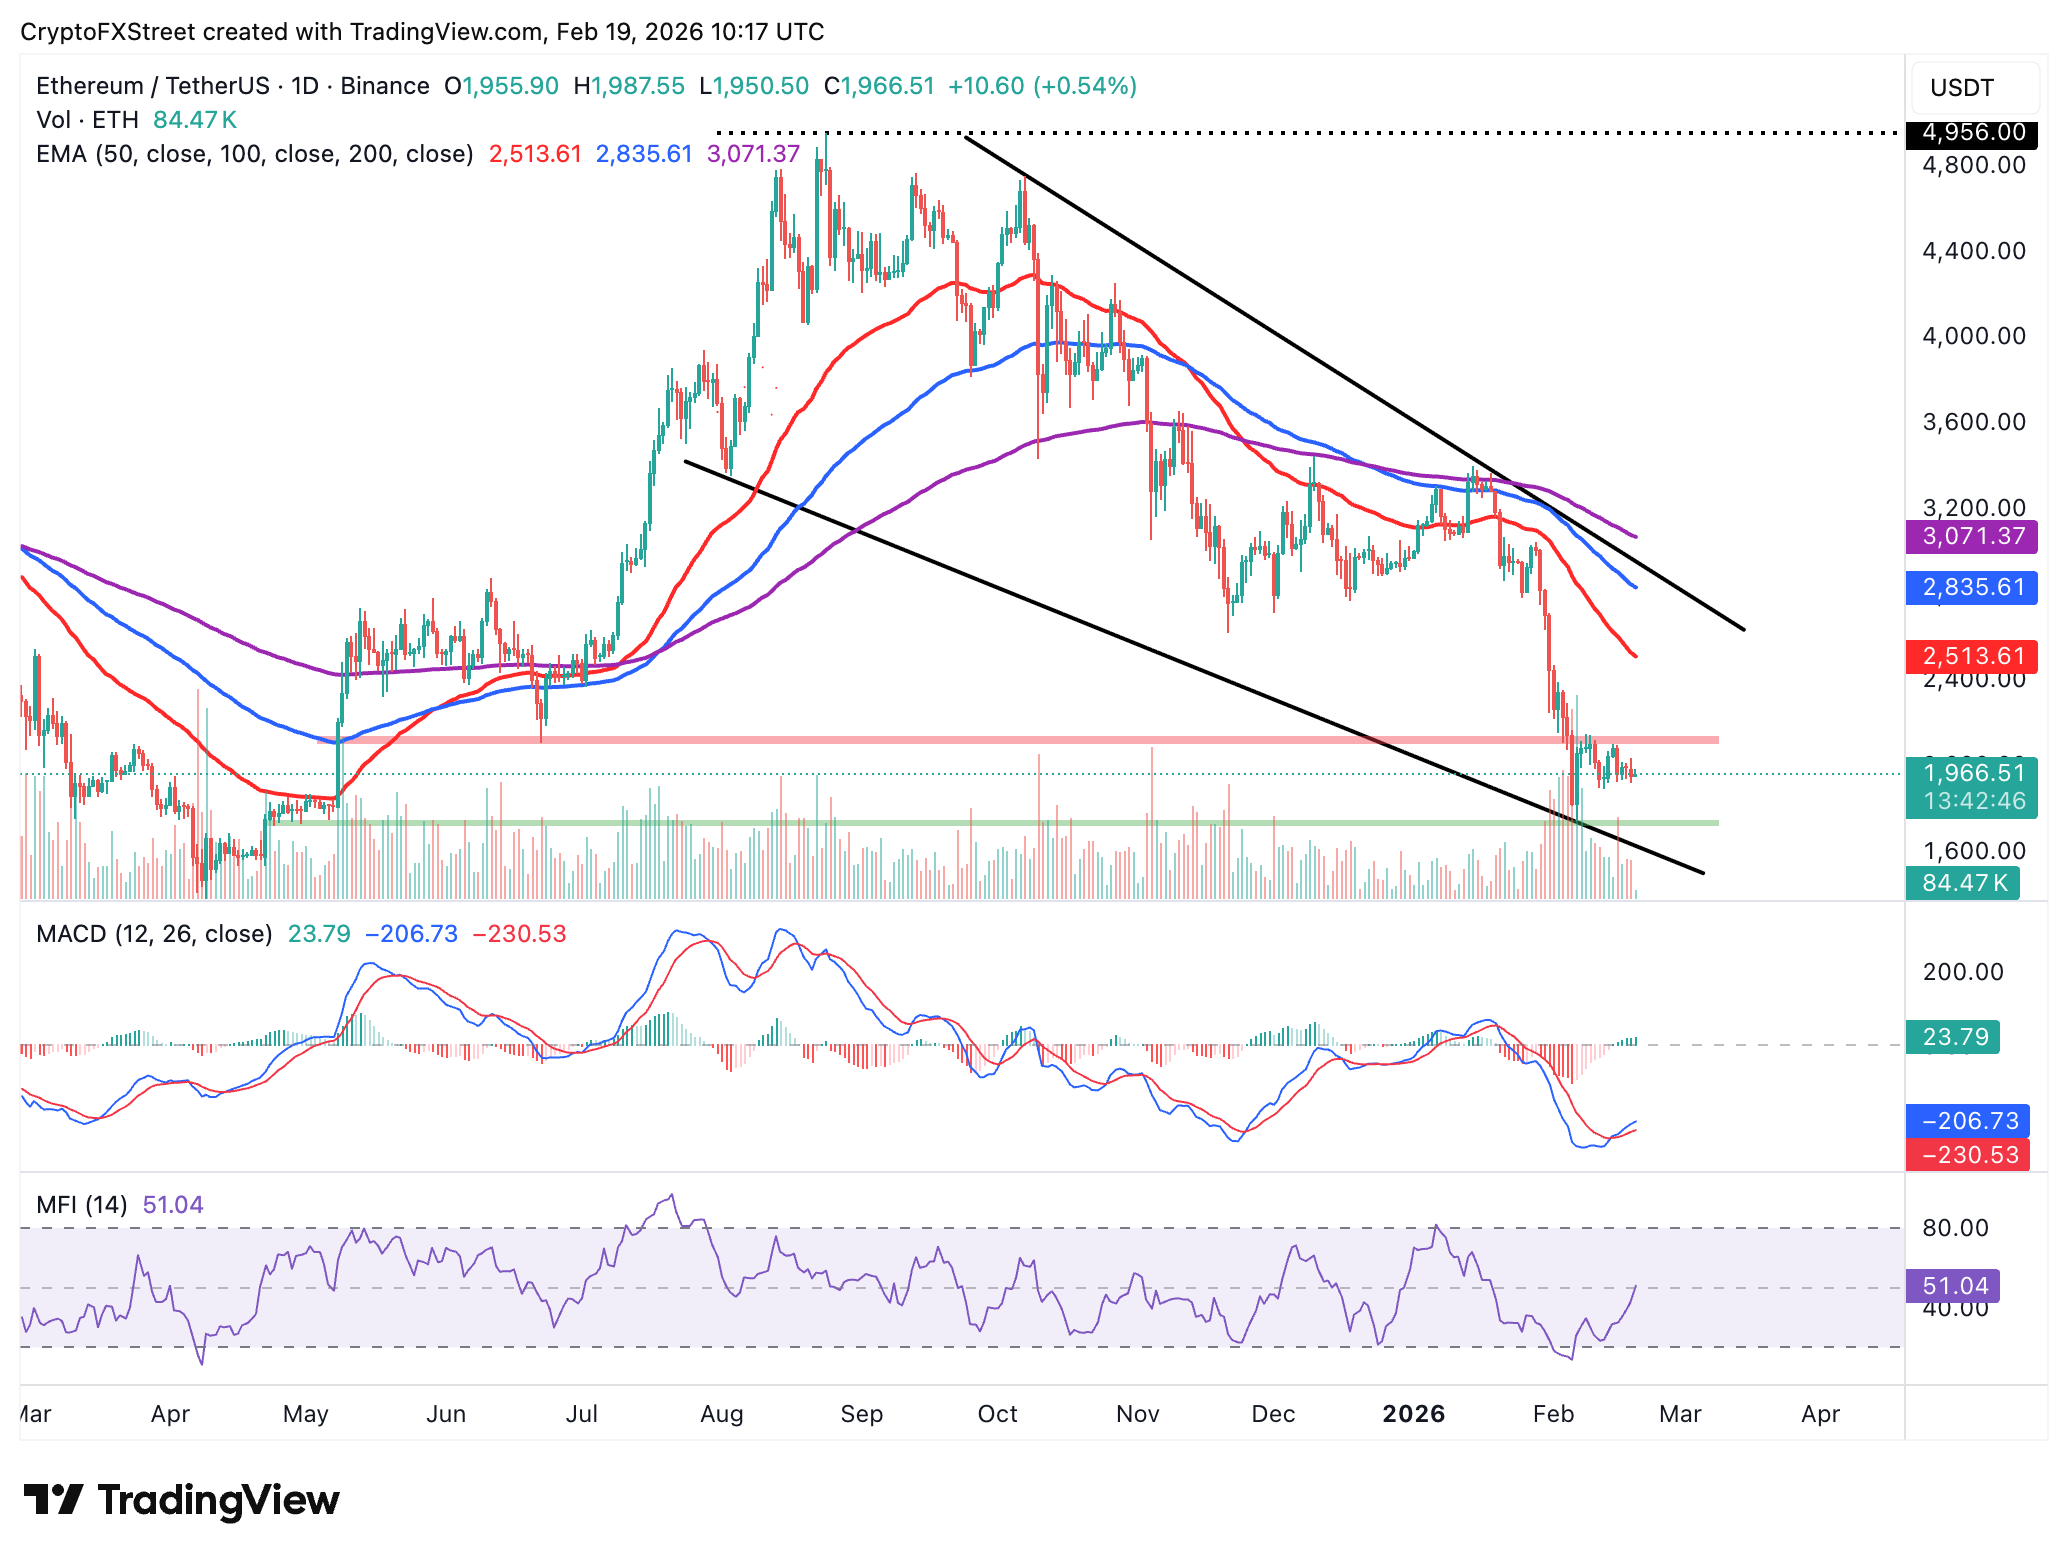
Ethereum is trading below the psychological $2,000 resistance and supported above $1,900. The smart contract token’s overall outlook is structurally bearish, mirroring the downward-sloping 50-day Exponential Moving Average (EMA) at $2,514, the 100-day EMA at $2,836 and the 200-day EMA at $3,071.
A decisive break above $2,000 would reinforce the bullish group, but downside risks may persist unless the 50-day EMA is flipped into support.
A buy signal from the MACD indicator on the daily chart supports ETH’s short-term bullish outlook, with expanding green histogram bars prompting traders to lean into risk. At the same time, the MFI indicator holds above 50 on the same chart, suggesting that more money is flowing into Ethereum, which may support an extended breakout. Despite these positive signals, traders should not lose sight of the support at $1,747, tested on February 6.
XRP, on the other hand, sits on top of support at $1.40 at the time of writing on Thursday, sliding from the previous day’s high of $1.49. The token also trades well below the downward-sloping 50-day EMA at $1.70, the 100-day EMA at $1.91 and the 200-day EMA at $2.12.
All three moving averages suggest that XRP’s technical structure continues to deteriorate. Hence, a continued drop below $1.40 could open the door to an accelerated downswing to test the October 10 low at $1.25 and the February 6 low at $1.12.
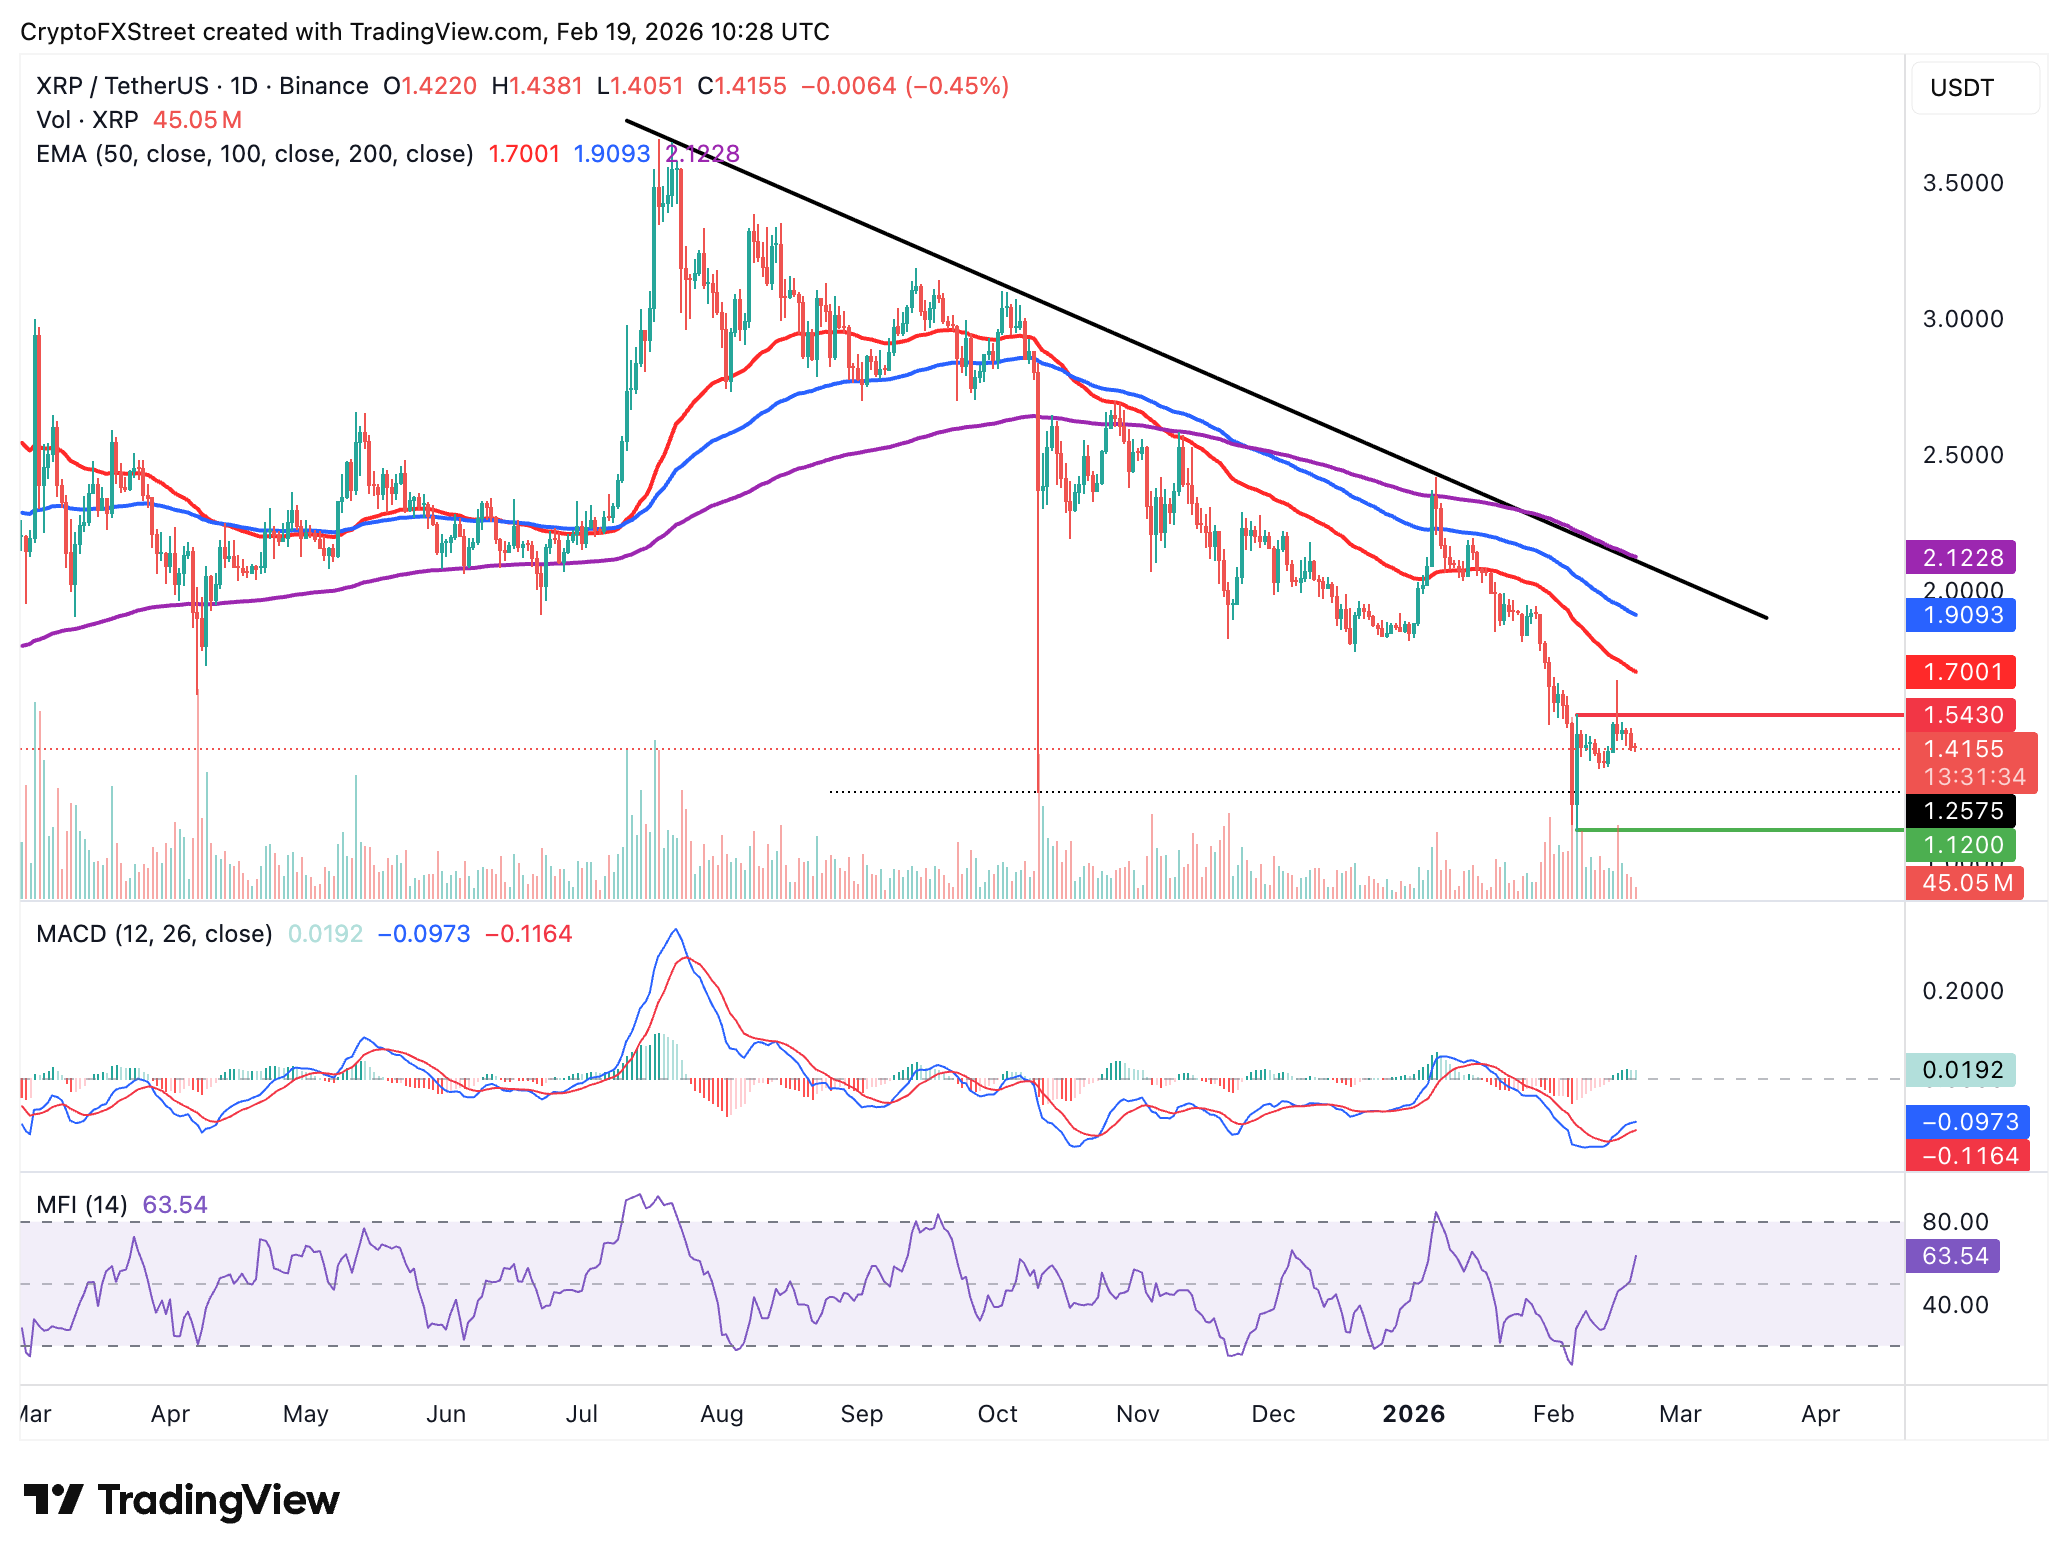
Still, the path of least resistance could shift upward, as confirmed by the MACD indicator holding above its signal line on the daily chart. Moreover, a break above the short-term hurdle at $1.50 would be supported by the surge in the money flowing into XRP, as reflected by the MFI rising to 64.
Crypto ETF FAQs
An Exchange-Traded Fund (ETF) is an investment vehicle or an index that tracks the price of an underlying asset. ETFs can not only track a single asset, but a group of assets and sectors. For example, a Bitcoin ETF tracks Bitcoin’s price. ETF is a tool used by investors to gain exposure to a certain asset.
Yes. The first Bitcoin futures ETF in the US was approved by the US Securities & Exchange Commission in October 2021. A total of seven Bitcoin futures ETFs have been approved, with more than 20 still waiting for the regulator’s permission. The SEC says that the cryptocurrency industry is new and subject to manipulation, which is why it has been delaying crypto-related futures ETFs for the last few years.
Yes. The SEC approved in January 2024 the listing and trading of several Bitcoin spot Exchange-Traded Funds, opening the door to institutional capital and mainstream investors to trade the main crypto currency. The decision was hailed by the industry as a game changer.
The main advantage of crypto ETFs is the possibility of gaining exposure to a cryptocurrency without ownership, reducing the risk and cost of holding the asset. Other pros are a lower learning curve and higher security for investors since ETFs take charge of securing the underlying asset holdings. As for the main drawbacks, the main one is that as an investor you can’t have direct ownership of the asset, or, as they say in crypto, “not your keys, not your coins.” Other disadvantages are higher costs associated with holding crypto since ETFs charge fees for active management. Finally, even though investing in ETFs reduces the risk of holding an asset, price swings in the underlying cryptocurrency are likely to be reflected in the investment vehicle too.
Bài viết đề xuất


