

Aster Price Forecast: ASTER tests resistance as whale activity, perpetuals volume surge
- Aster edges higher by over 7% on Tuesday, testing a long-term resistance trendline.
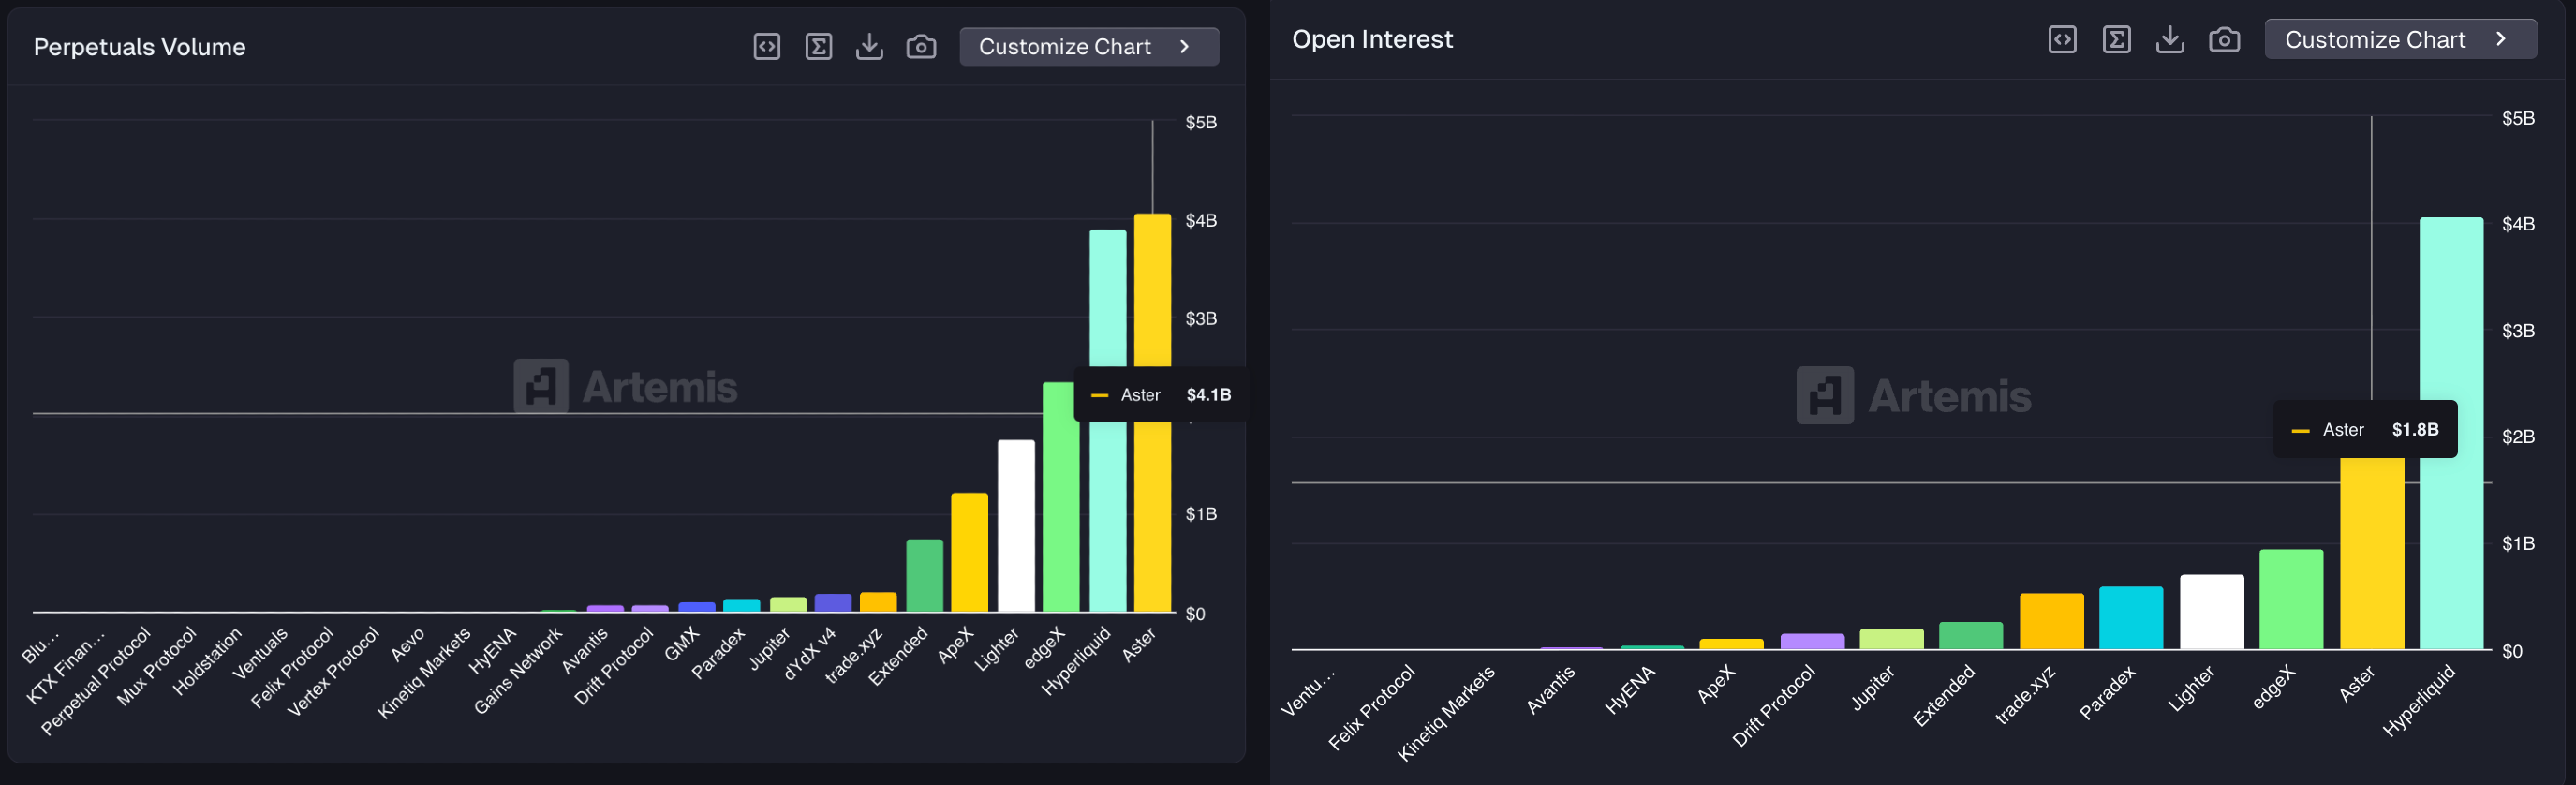
- Aster records $4.1 billion in perpetual volumes over the last 24 hours, surpassing Hyperliquid.
- On-chain data shows that large wallet investors added over 170 million ASTER tokens since Thursday.
Aster (ASTER) edges higher by over 7% at press time on Thursday, crossing above its 200-period Exponential Moving Average (EMA) on the 4-hour chart while testing a long-term resistance trendline on the daily. The perpetual-focused exchange recorded $4.1 billion in volume over the last 24 hours, outpacing its competitor Hyperliquid. Large wallet investors, popularly known as whales, back ASTER’s recovery by accumulating more than 170 million tokens over the last five days.
Whales bet on Aster as perp volume surges back
Aster, a decentralized exchange (DEX) backed by strategic investors like YZi Labs, has regained retail interest over the last 24 hours, intensifying competition with Hyperliquid. Artemis data shows that Aster recorded $4.1 billion in perpetual volume, outpacing Hyperliquid’s $3.9 billion in the last 24 hours. However, at the same time, Hyperliquid’s Open Interest – value of outstanding contracts on the platform – stood at $4.1 billion, outpacing Aster’s OI of $1.8 billion. This surge in perp volume reflects a short-term increase in retail interest, boosting revenue and fees. However, the difference in OI places Hyperliquid far ahead of Aster among DEX users.
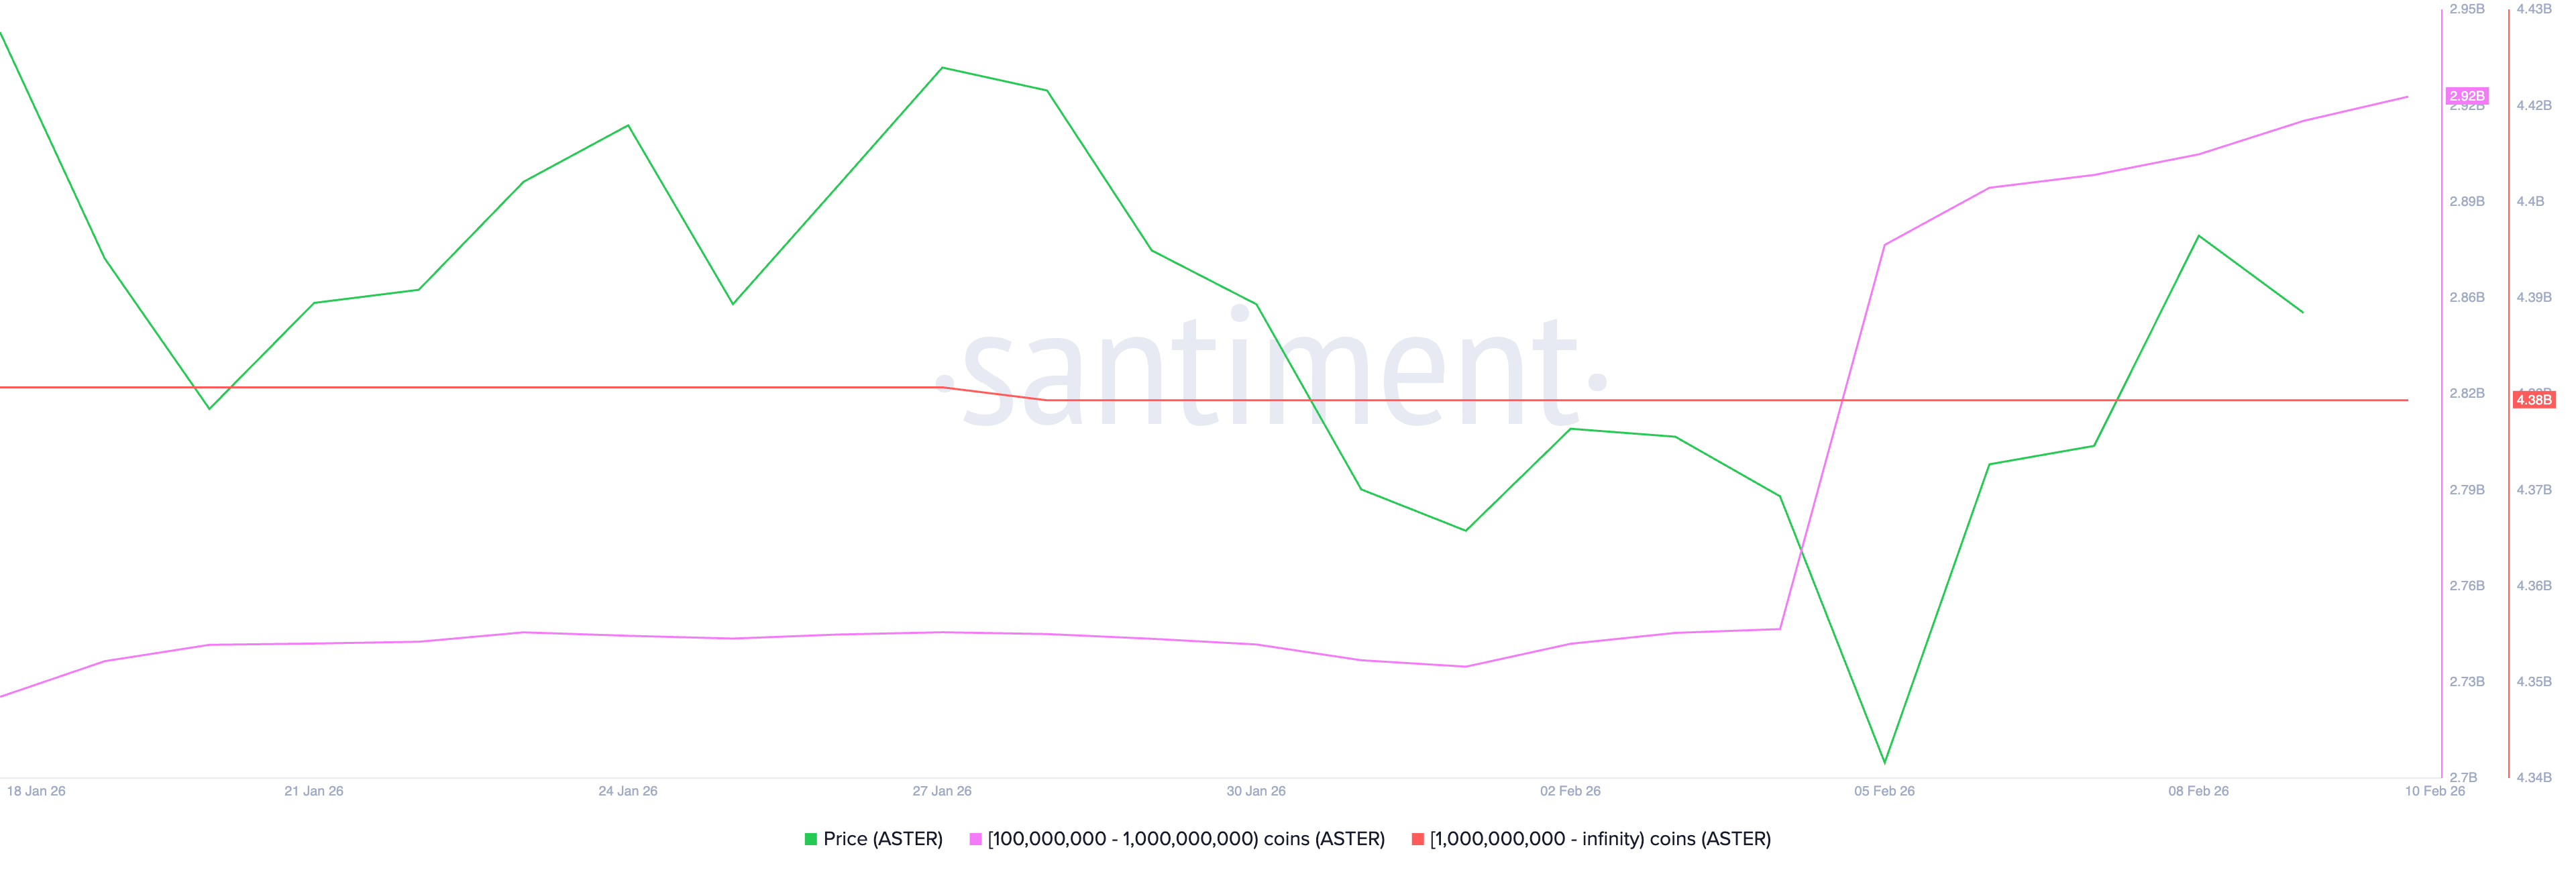
On the on-chain side, ASTER supply distribution shows a renewed interest among whales with 100 million to 1 billion tokens. Santiment data show that this cohort increased its holdings to $9.22 billion from $9.75 billion on Thursday, supporting the V-shaped rebound in ASTER.
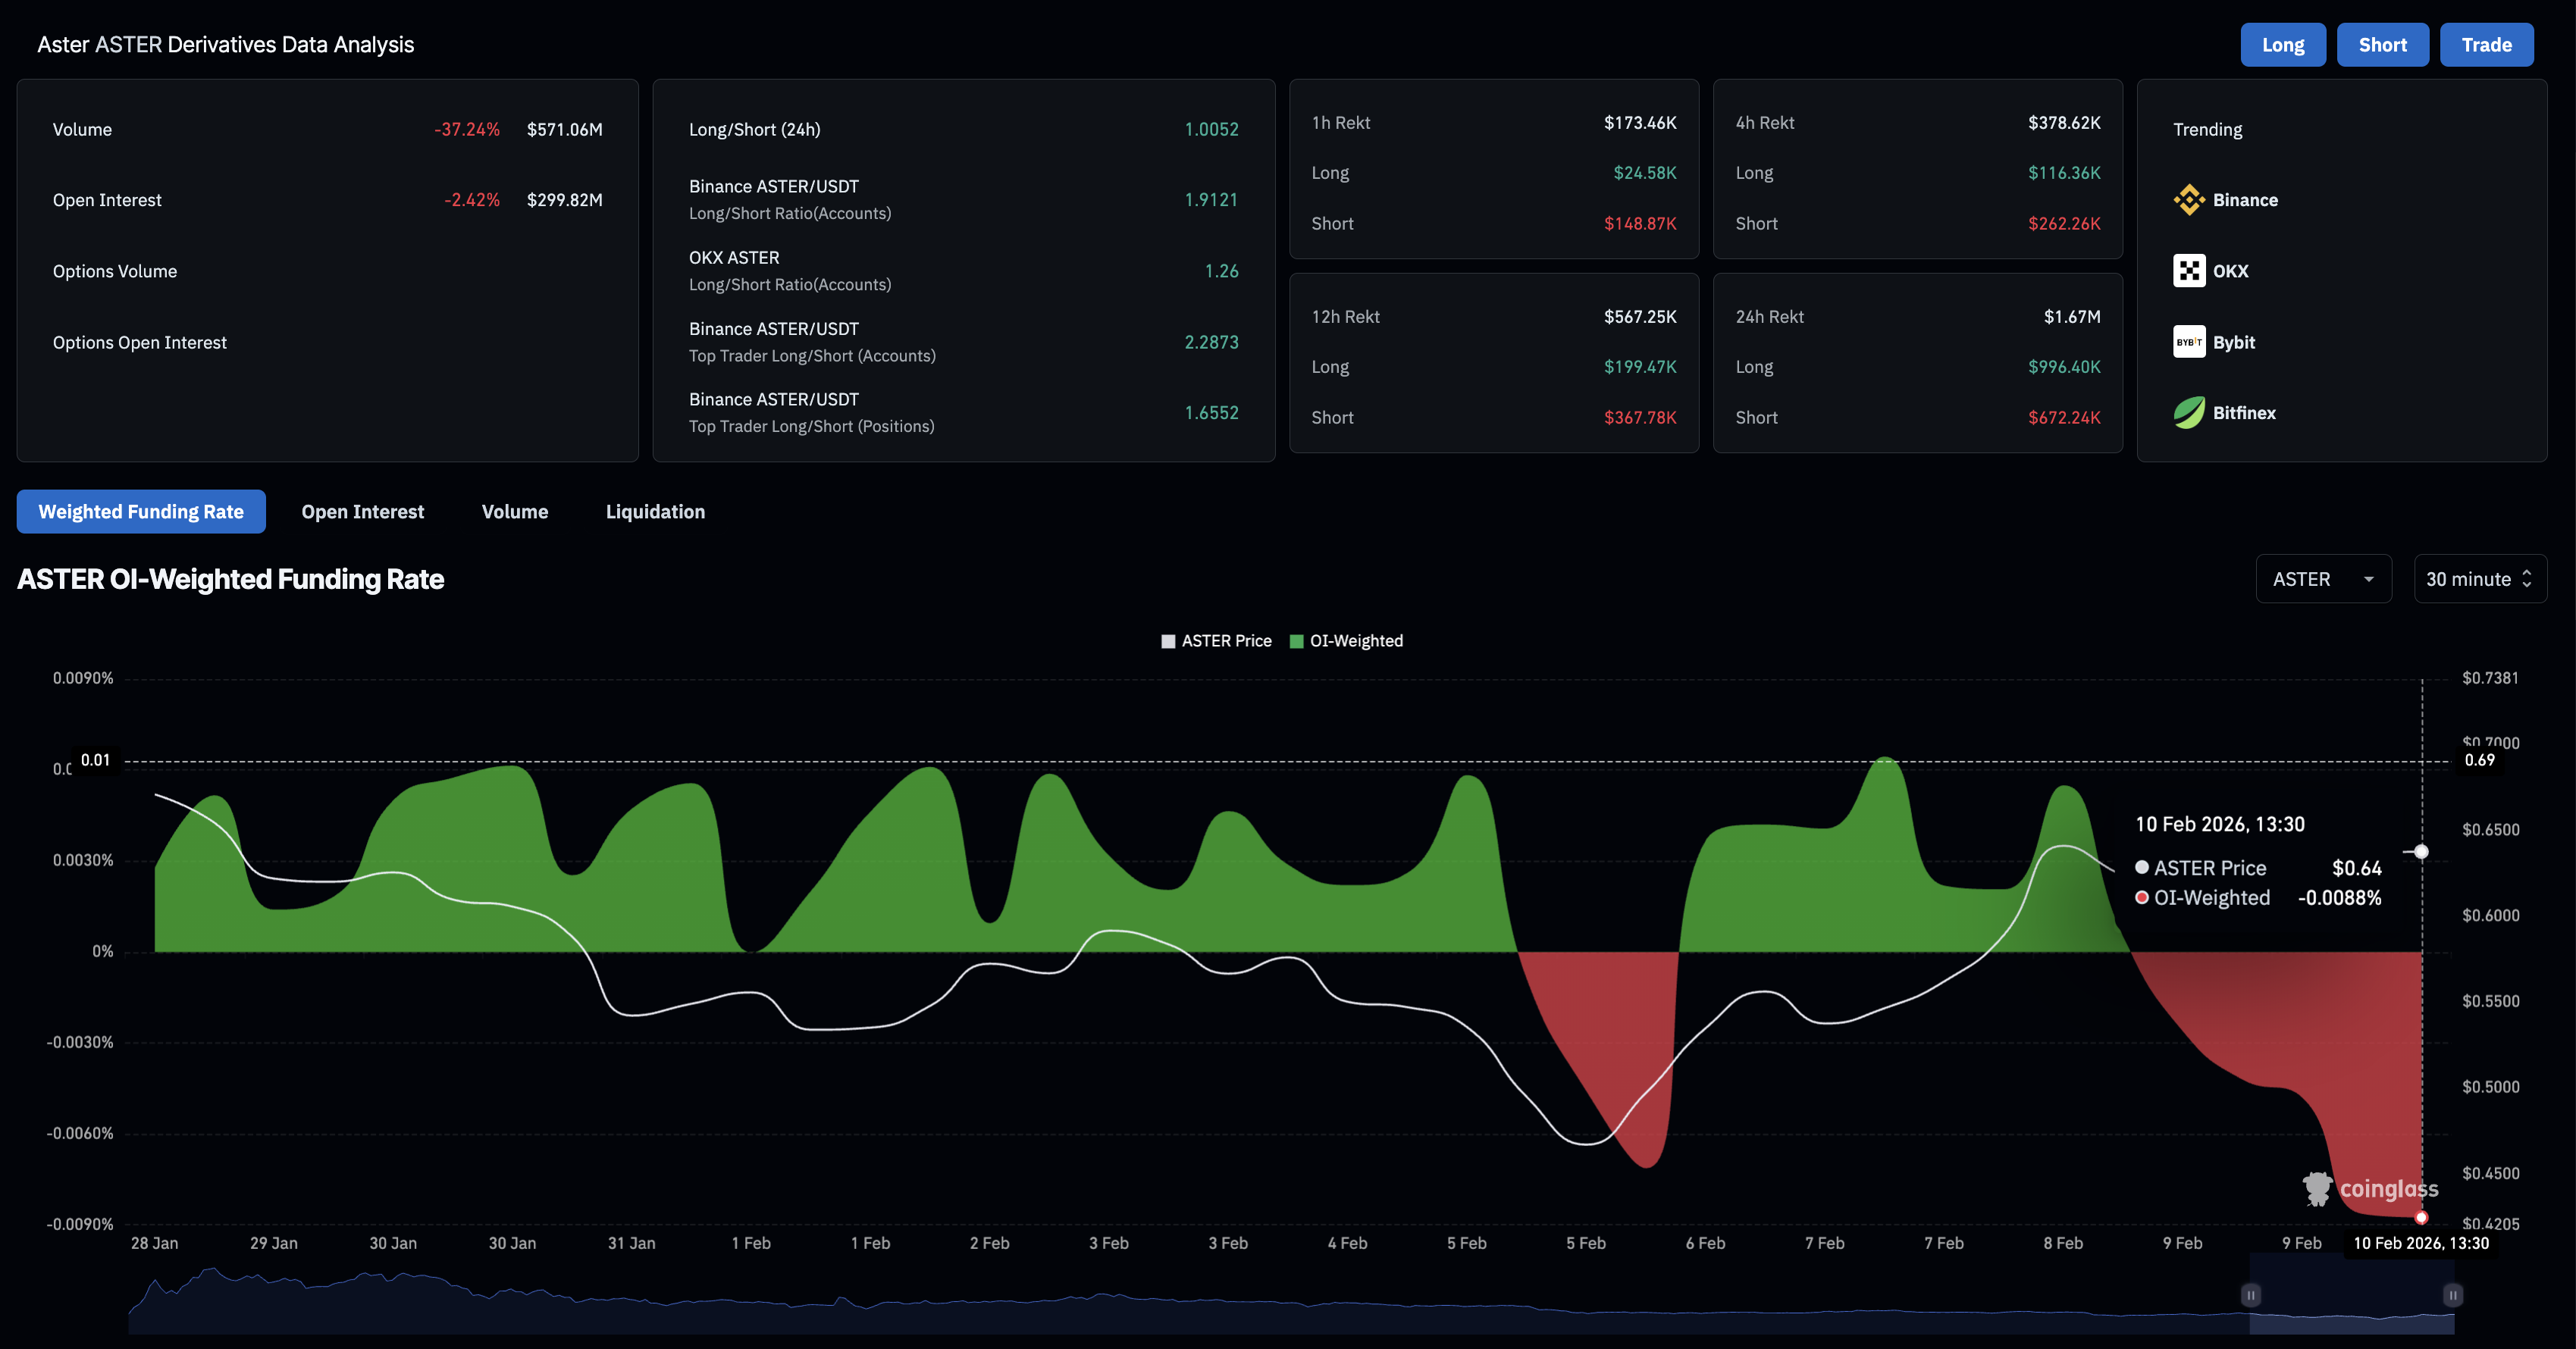
However, the derivatives data indicate that retail demand for ASTER lags behind whale interest. According to CoinGlass, ASTER futures Open Interest (OI) stands at $299.82 million, down 2.42% over the last 24 hours, indicating a decline in the value of outstanding derivatives contracts across all exchanges. At the same time, the OI-weighted funding rate fell to 0.0088% on Tuesday, suggesting bearish sentiment among traders amid capital outflows.
Typically, when whales buy and retail stands on the sidelines, it foreshadows significant upside for any crypto asset.
Aster inches closer to a crucial resistance breakout
Aster trades above $0.630 at press time on Thursday, testing a crucial resistance trendline connecting the October 7 and November 19 highs on the daily chart. A decisive close above $0.630 would confirm the trendline breakout and open the door to further upside.
On the 4-hour chart, ASTER crosses above the 200-period EMA at $0.637, while the 50-period EMA remains upward-sloping, pointing to a short-term bullish bias. However, another crucial resistance emerges on this timeframe, ranging from $0.698 (January 26 low) to the R1 Pivot Point at $0.718.
If ASTER clears this zone, it could extend the rally to the R2 Pivot Point at $0.812.
The technical indicators on the 4-hour chart confirm the bullish dominance. The Relative Strength Index (RSI) at 64 shows heightened buying pressure with further upside before reaching the overbought zone. At the same time, the Moving Average Convergence Divergence (MACD) bounces off its signal line, indicating renewed bullish momentum.
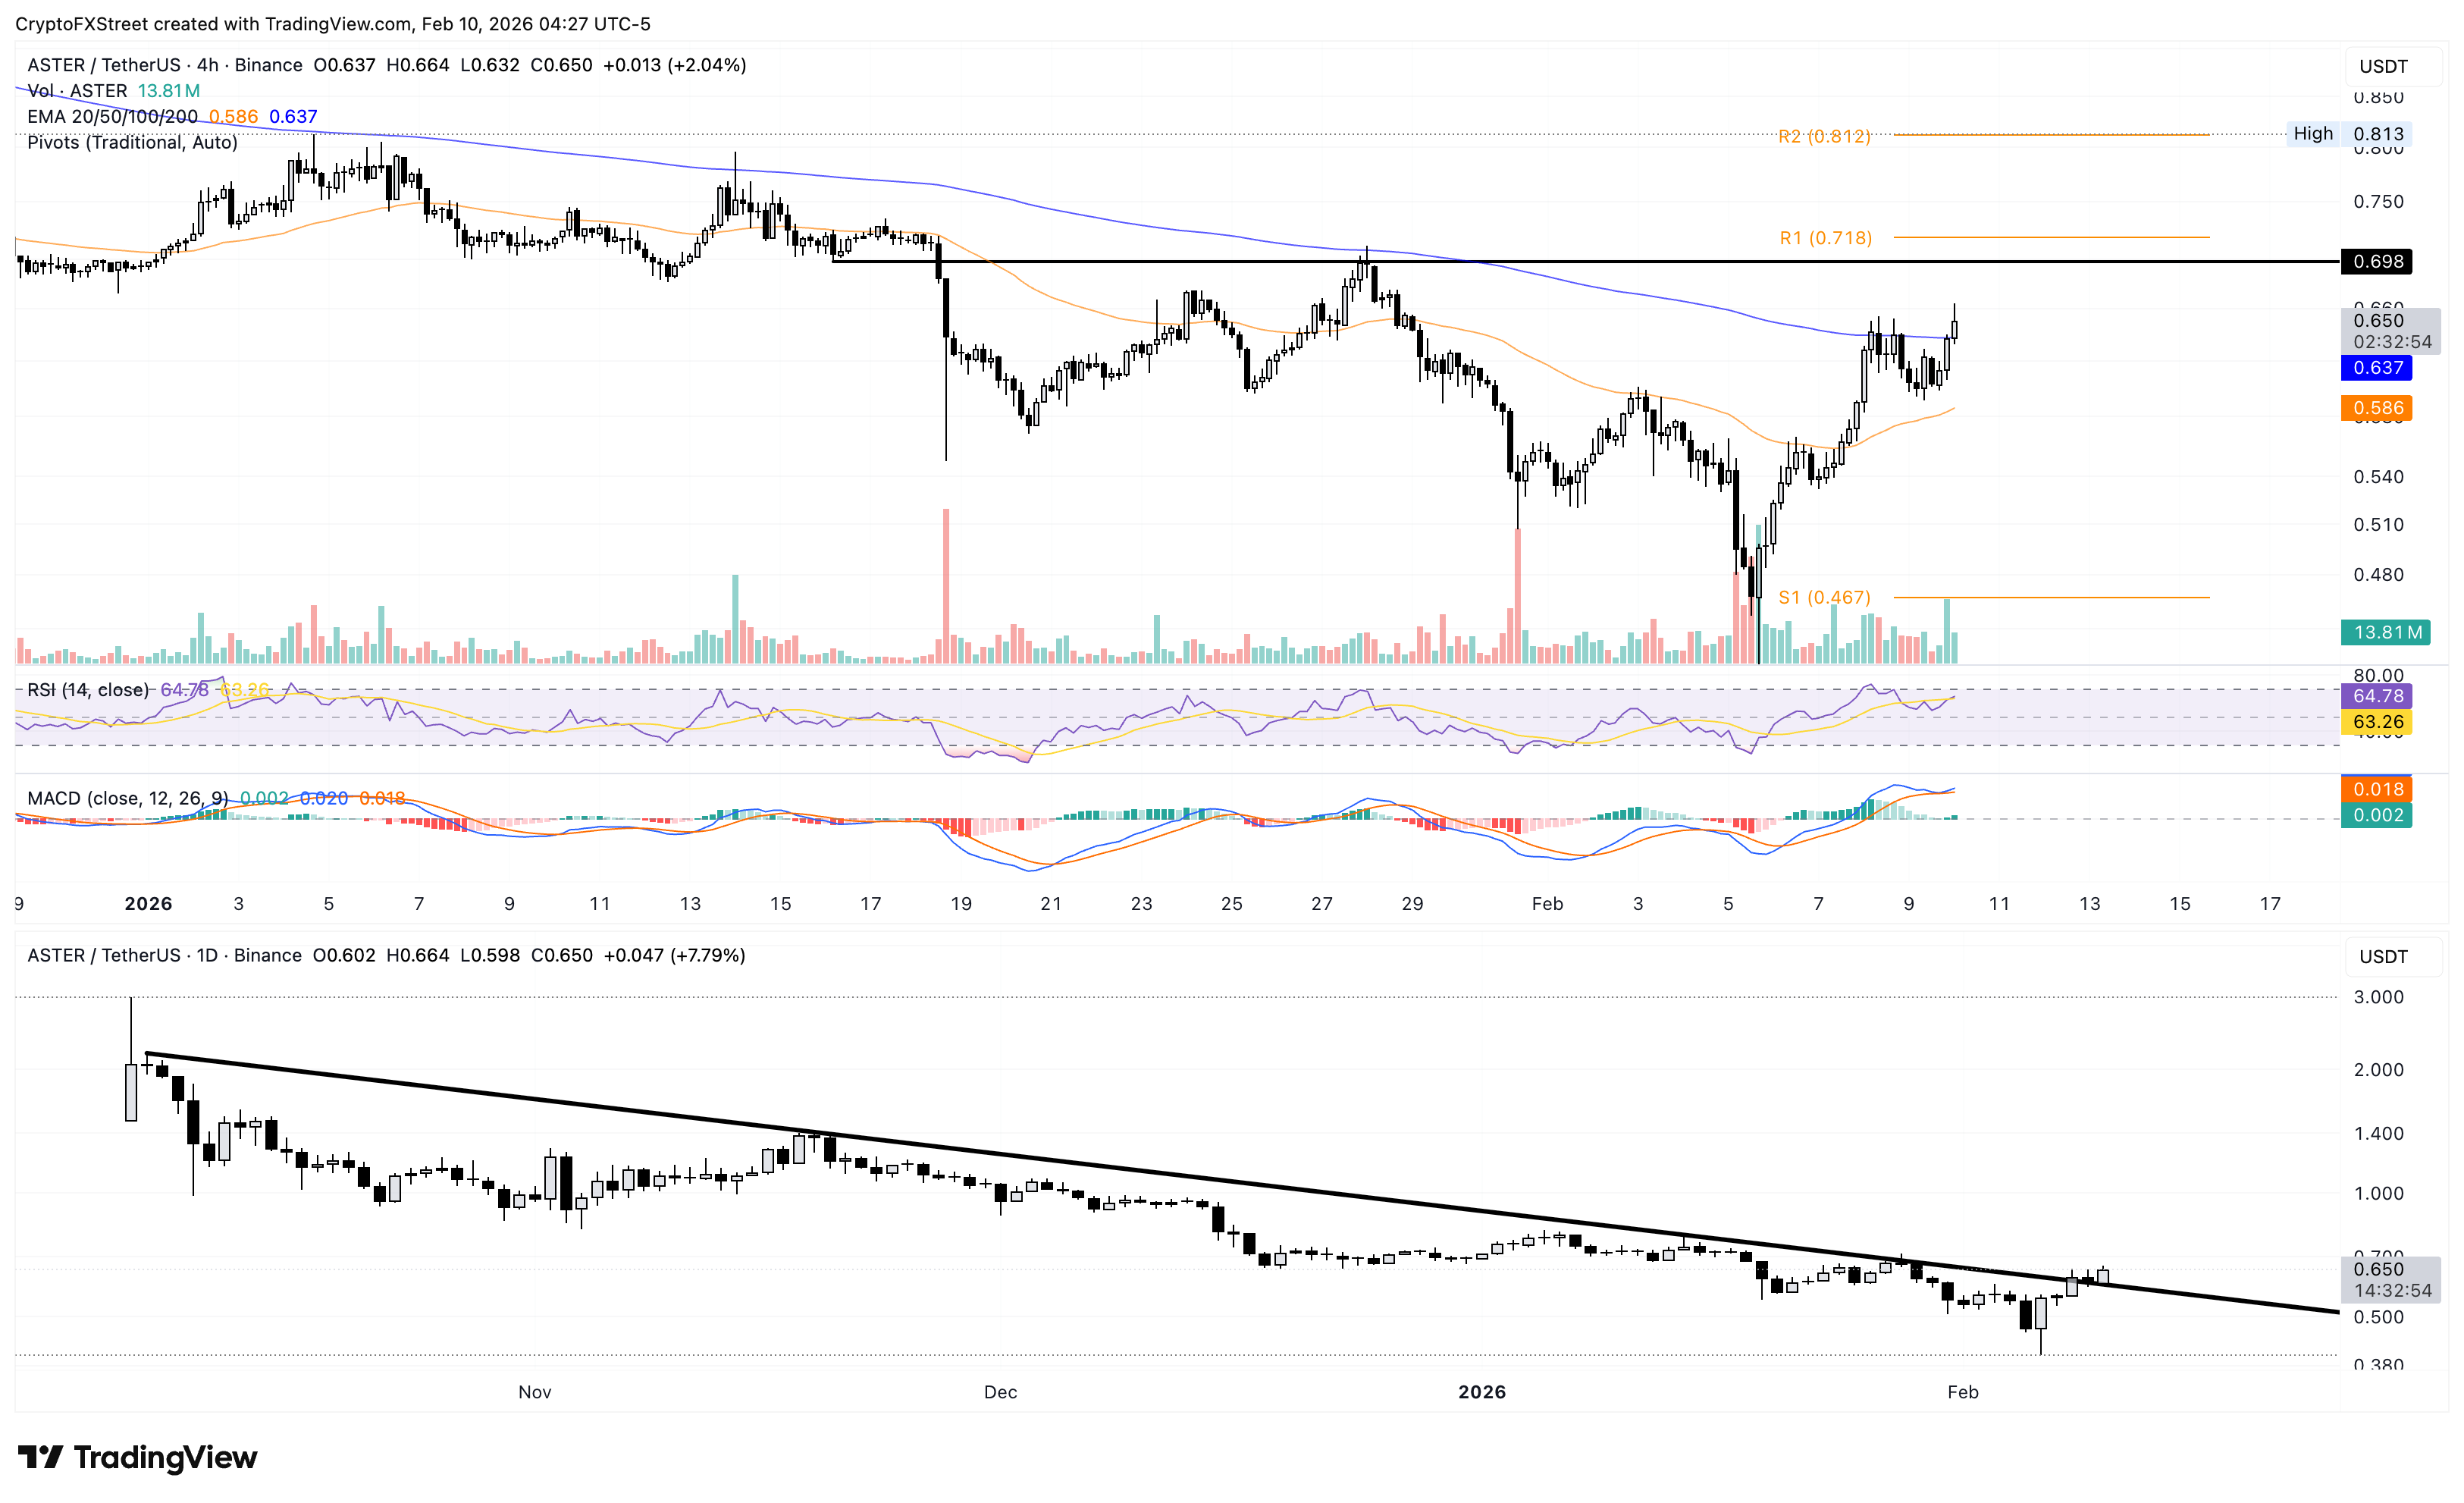
On the flip side, the 50-period EMA at $0.586 remains a crucial support, followed by a deeper zone at the S1 Pivot Point at $0.467.
Bài viết đề xuất


