
Aave Price Forecast: AAVE approaches $1 trillion in all-time loans despite recent market downturn
- Aave price rebounds, trading above $196 on Wednesday after finding support near a key technical level.
- The protocol is approaching $1 trillion in all-time loans despite recent price declines, underscoring continued network usage and DeFi demand.
- On-chain and derivatives data point to recovery, with rising whale activity, improving buy dominance, and positive funding rates.
Aave (AAVE) price is rebounding above $196 at the time of writing on Wednesday after a recent market correction earlier this week. Despite the price drop, the Decentralized Finance (DeFi) lending protocol is closing in on the $1 trillion mark in all-time loans, highlighting strong network activity and sustained demand. Meanwhile, on-chain and derivatives data point to recovery, with rising whale activity, improving buy dominance, and positive funding rates.
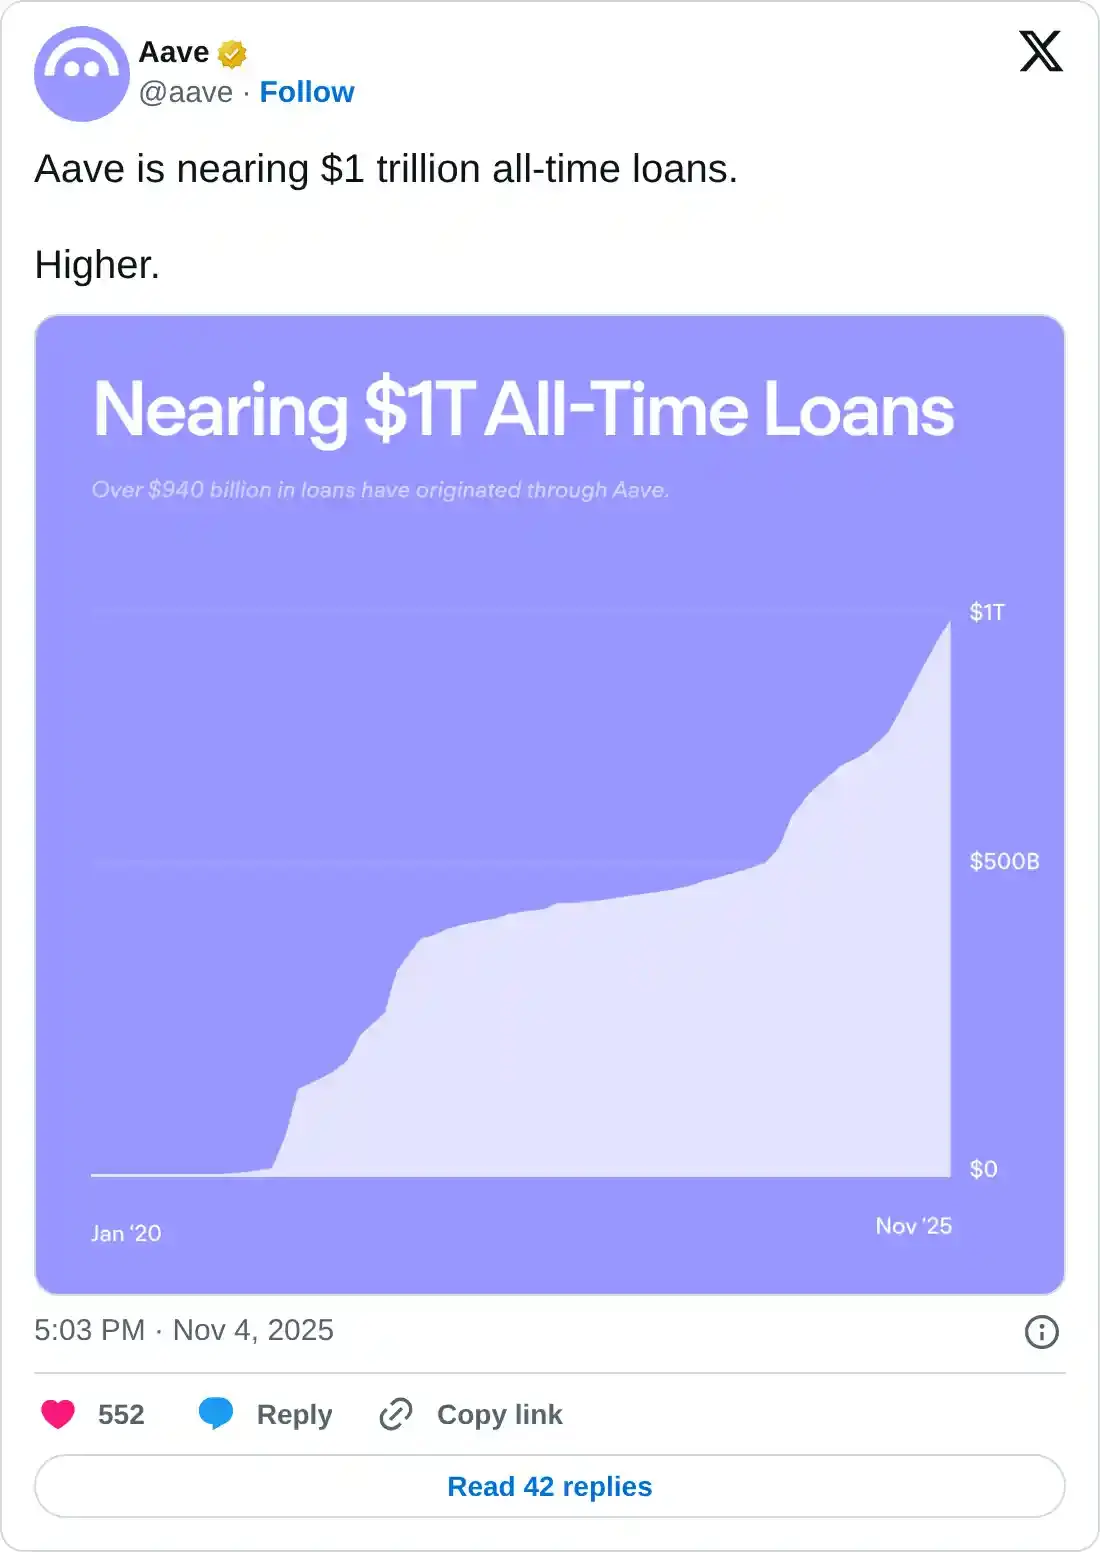
Aave is nearing $1 trillion in all-time loans
Aave announced on its official X account on Tuesday that the protocol is nearing the $1 trillion milestone in all-time loans, a significant milestone that highlights strong network activity and sustained DeFi demand despite recent price dips, reflecting the project’s resilience amid broader market pressure.
Additionally, Aave’s Horizon Real World Asset (RWA) market surpassed $520 million in deposits, making it the fastest-growing segment for RWA-backed loans and indicating rising institutional interest and expanding real-world adoption within the DeFi ecosystem.
Aave’s on-chain and derivatives data show a bullish bias
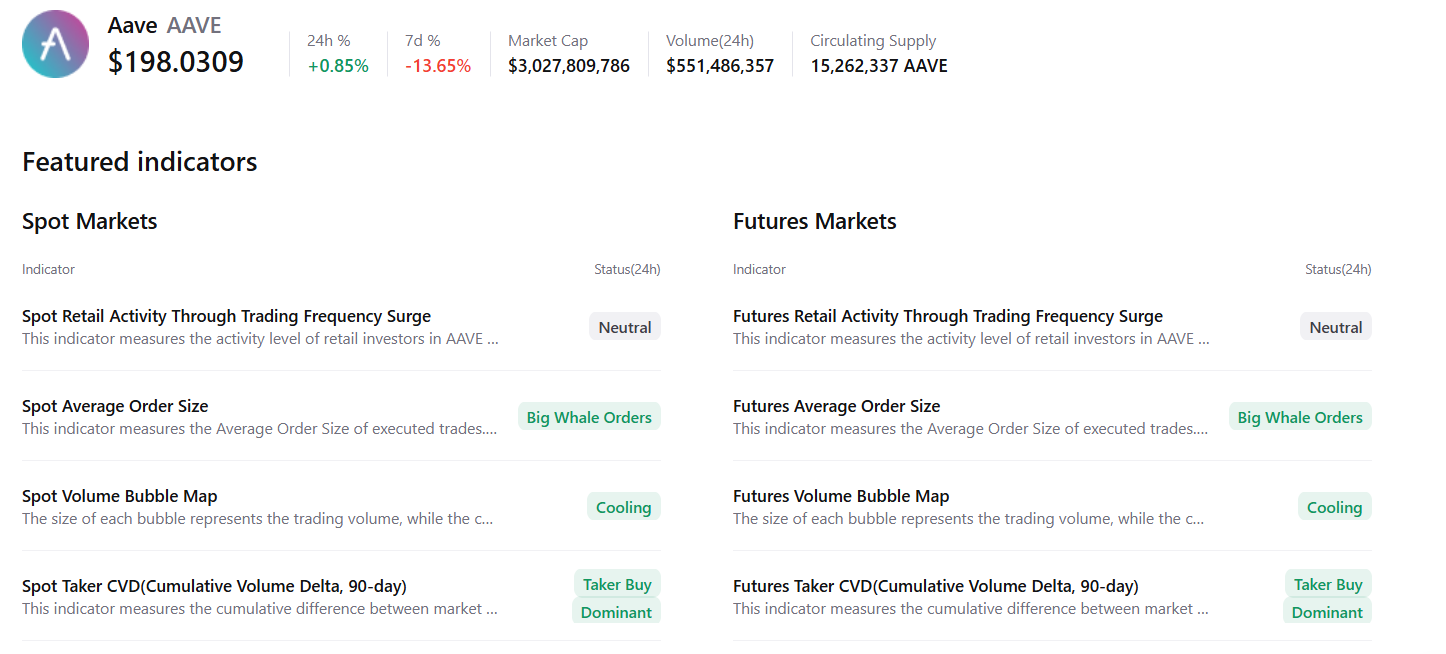
CryptoQuant’s summary data supports the positive outlook, as AAVE’s spot and futures markets show large whale orders, cooling conditions, and buy dominance, signaling a potential recovery ahead.
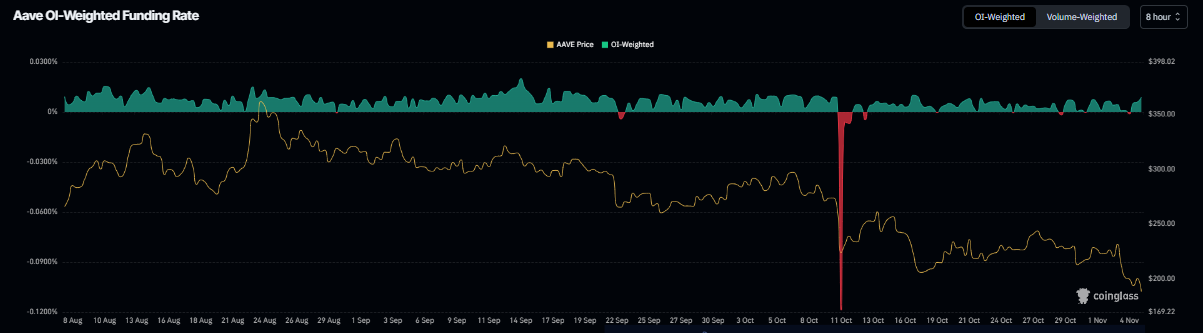
Derivatives data also support a recovery rally for Aave. Coinglass’s OI-Weighted Funding Rate data shows that the number of traders betting that the price of AAVE will slide further is lower than those anticipating a price increase.
The metric has flipped to a positive rate, standing at 0.0089% on Wednesday, indicating that longs are paying shorts. Historically, as shown in the chart below, when the funding rates have flipped from negative to positive, Aave’s price has rallied sharply.
Aave Price Forecast: AAVE retest key support zone
Aave price faced rejection around the 78.6% Fibonacci retracement level at $254.35 on October 27 and declined by more than 22% over the next 8 days, retesting the daily support at $179.27 on Tuesday. This daily support level roughly coincides with the 50% retracement level at $190.73 and the lower trendline of the falling wedge pattern, making this a key support zone. At the time of writing on Wednesday, AAVE trades slightly above at around $196.
If the support level at $179.27 holds, it could extend the recovery toward the 50-day Exponential Moving Average (EMA) at $246.01.
The Relative Strength Index (RSI) on the daily chart is 37, pointing upward toward the neutral level of 50, suggesting early signs of fading bearish momentum. However, for the recovery rally to be sustained, the RSI must move above the neutral level.
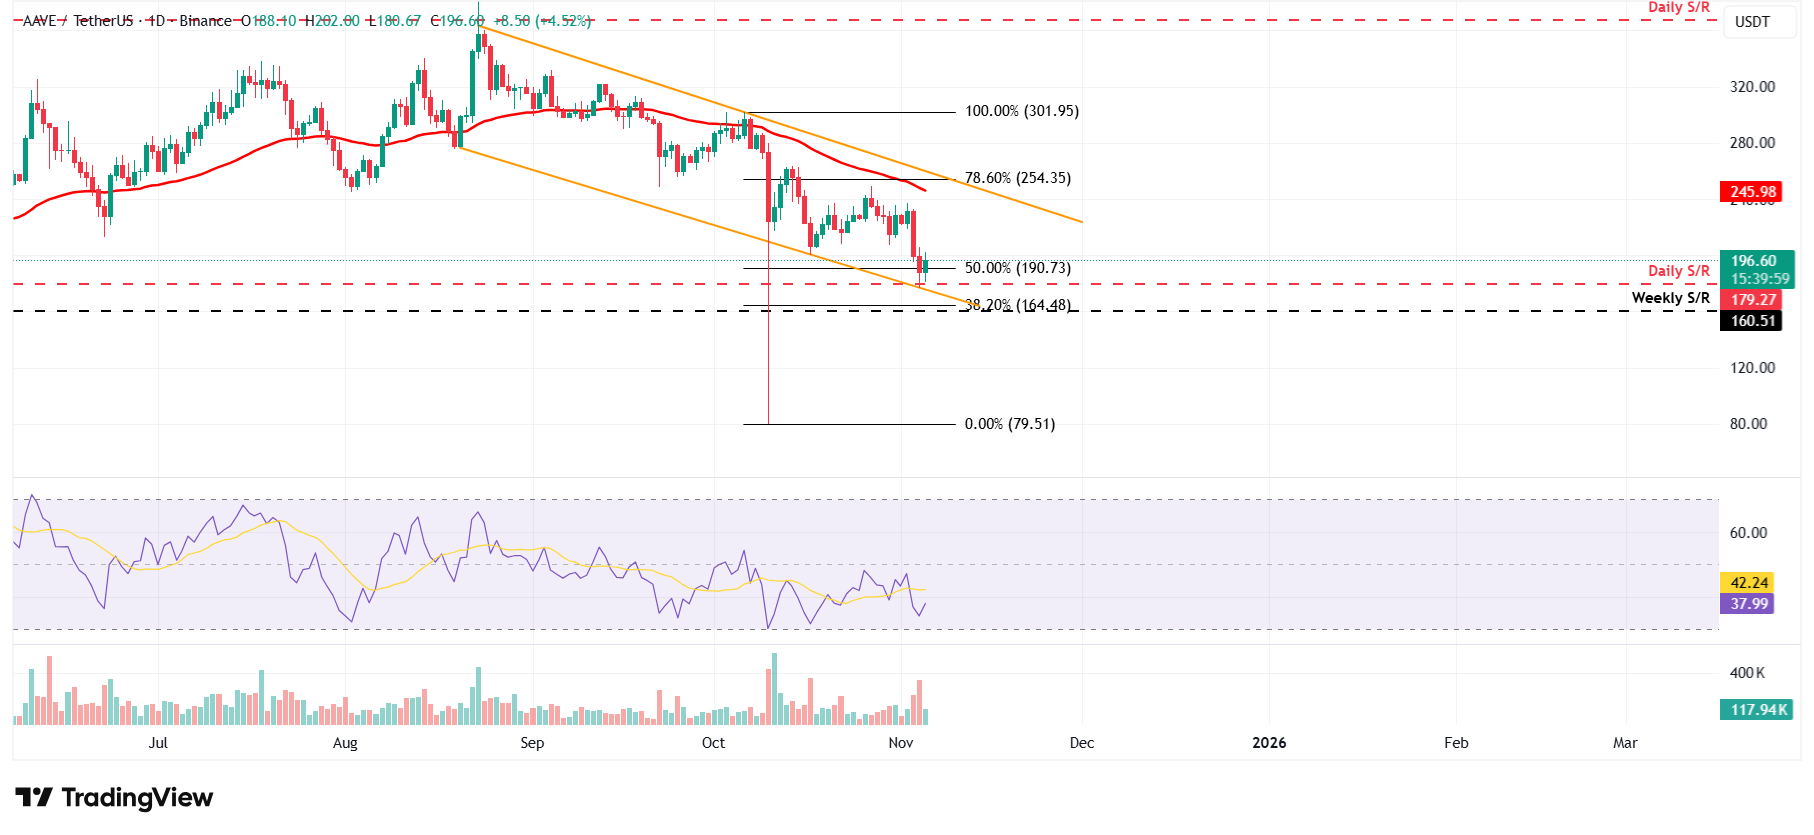
However, if AAVE closes below $179.27, it could extend the decline toward the weekly support at $160.51.
Bài viết đề xuất


