
Pi Network Price Forecast: Whale, retail demand backs PI at key support level
- Pi Network bulls hold ground at the $0.2000 psychological support after two consecutive days of pullback.
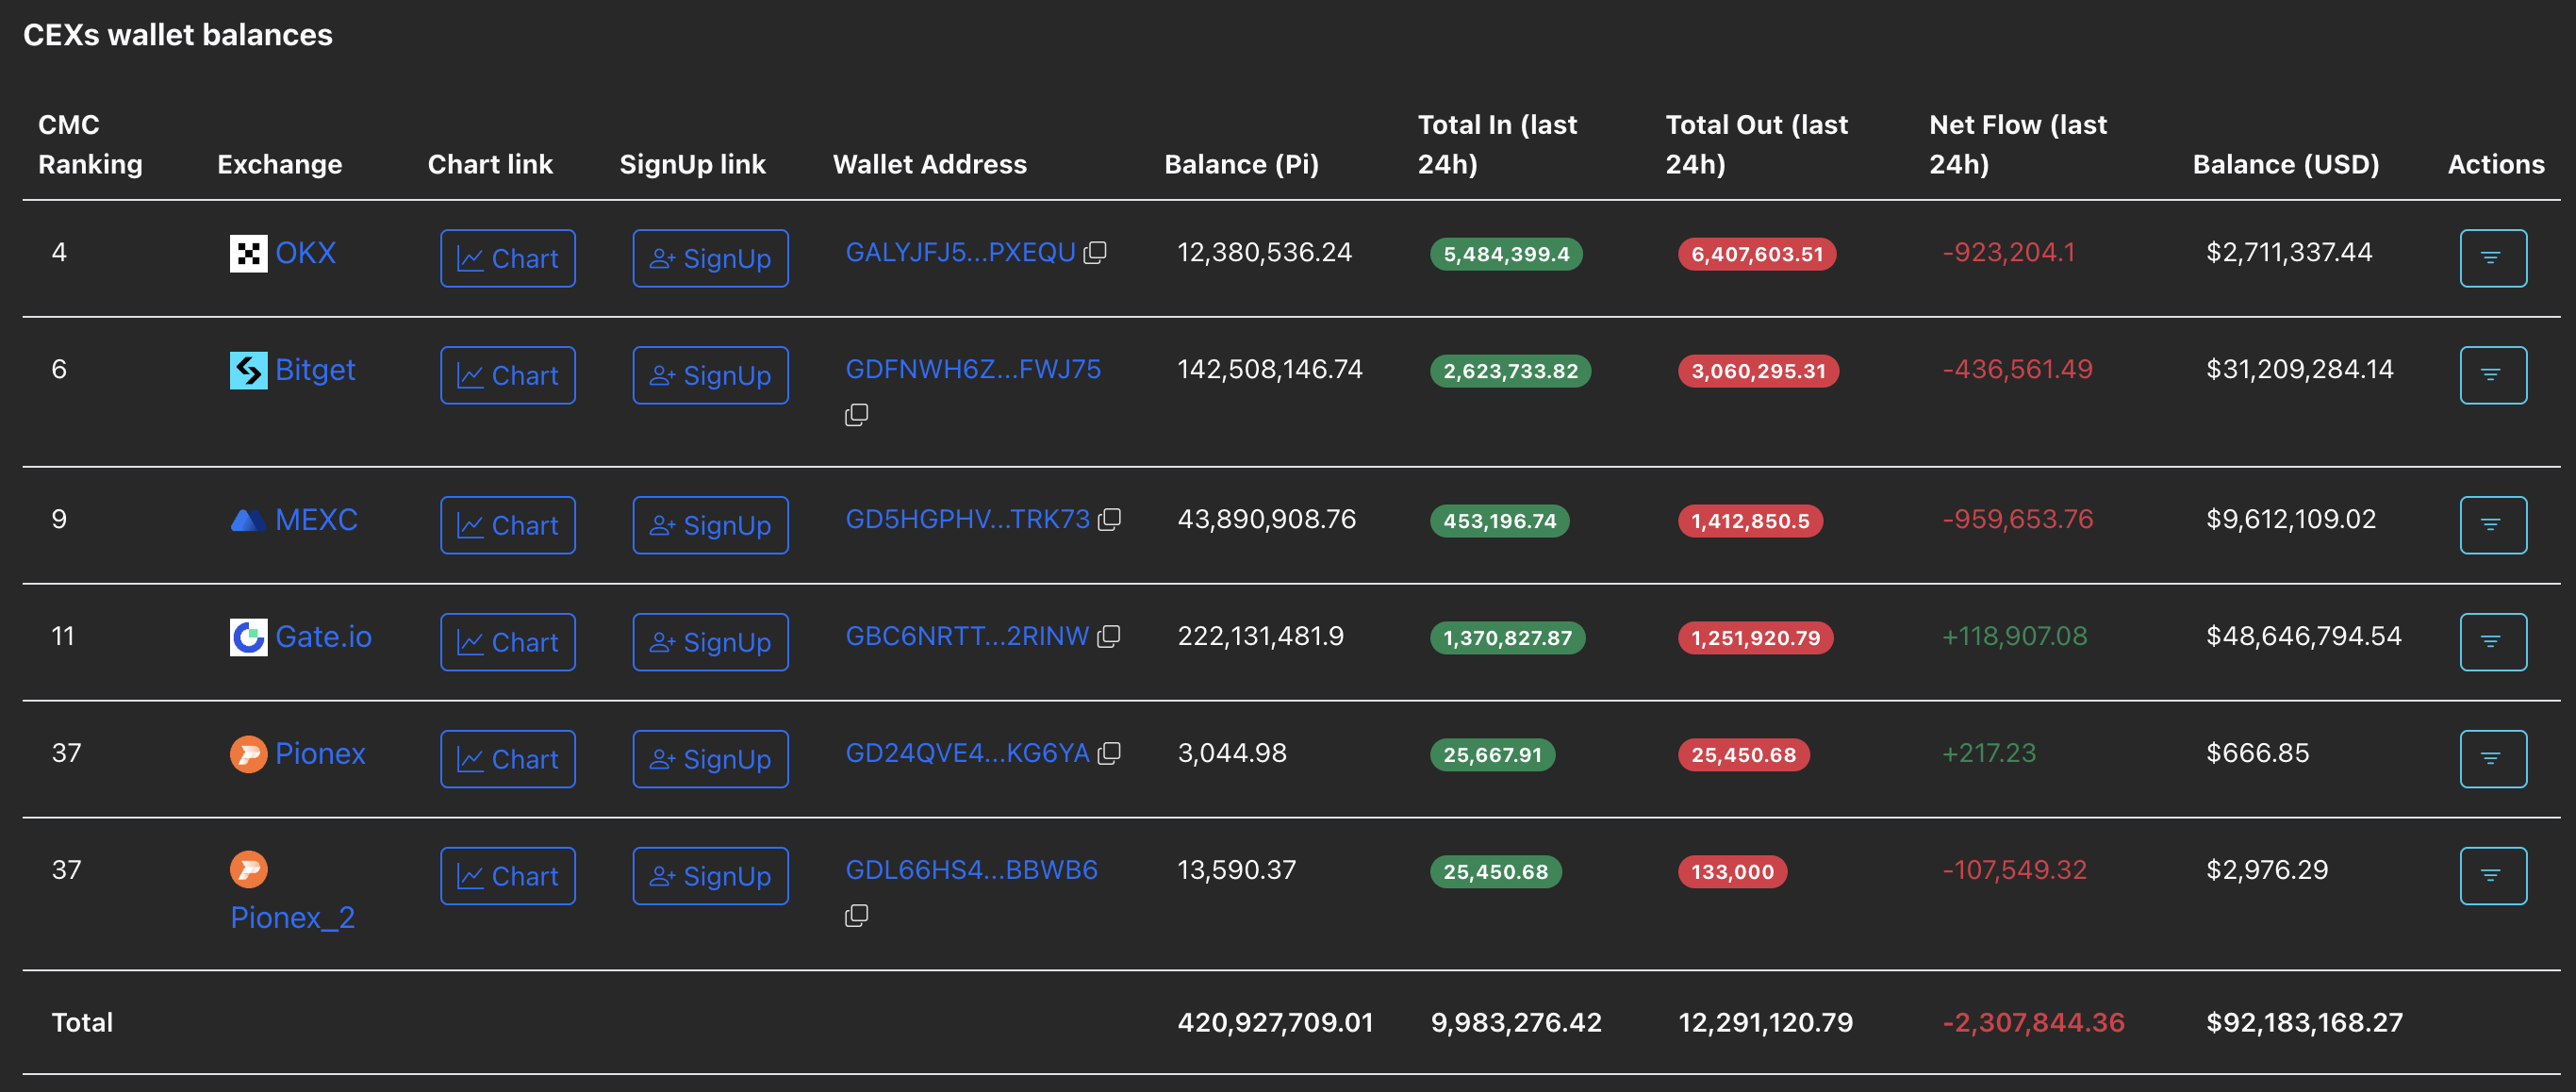
- Centralized exchanges' wallet balances record an outflow of over 2 million PI tokens, suggesting traders are buying the dip.
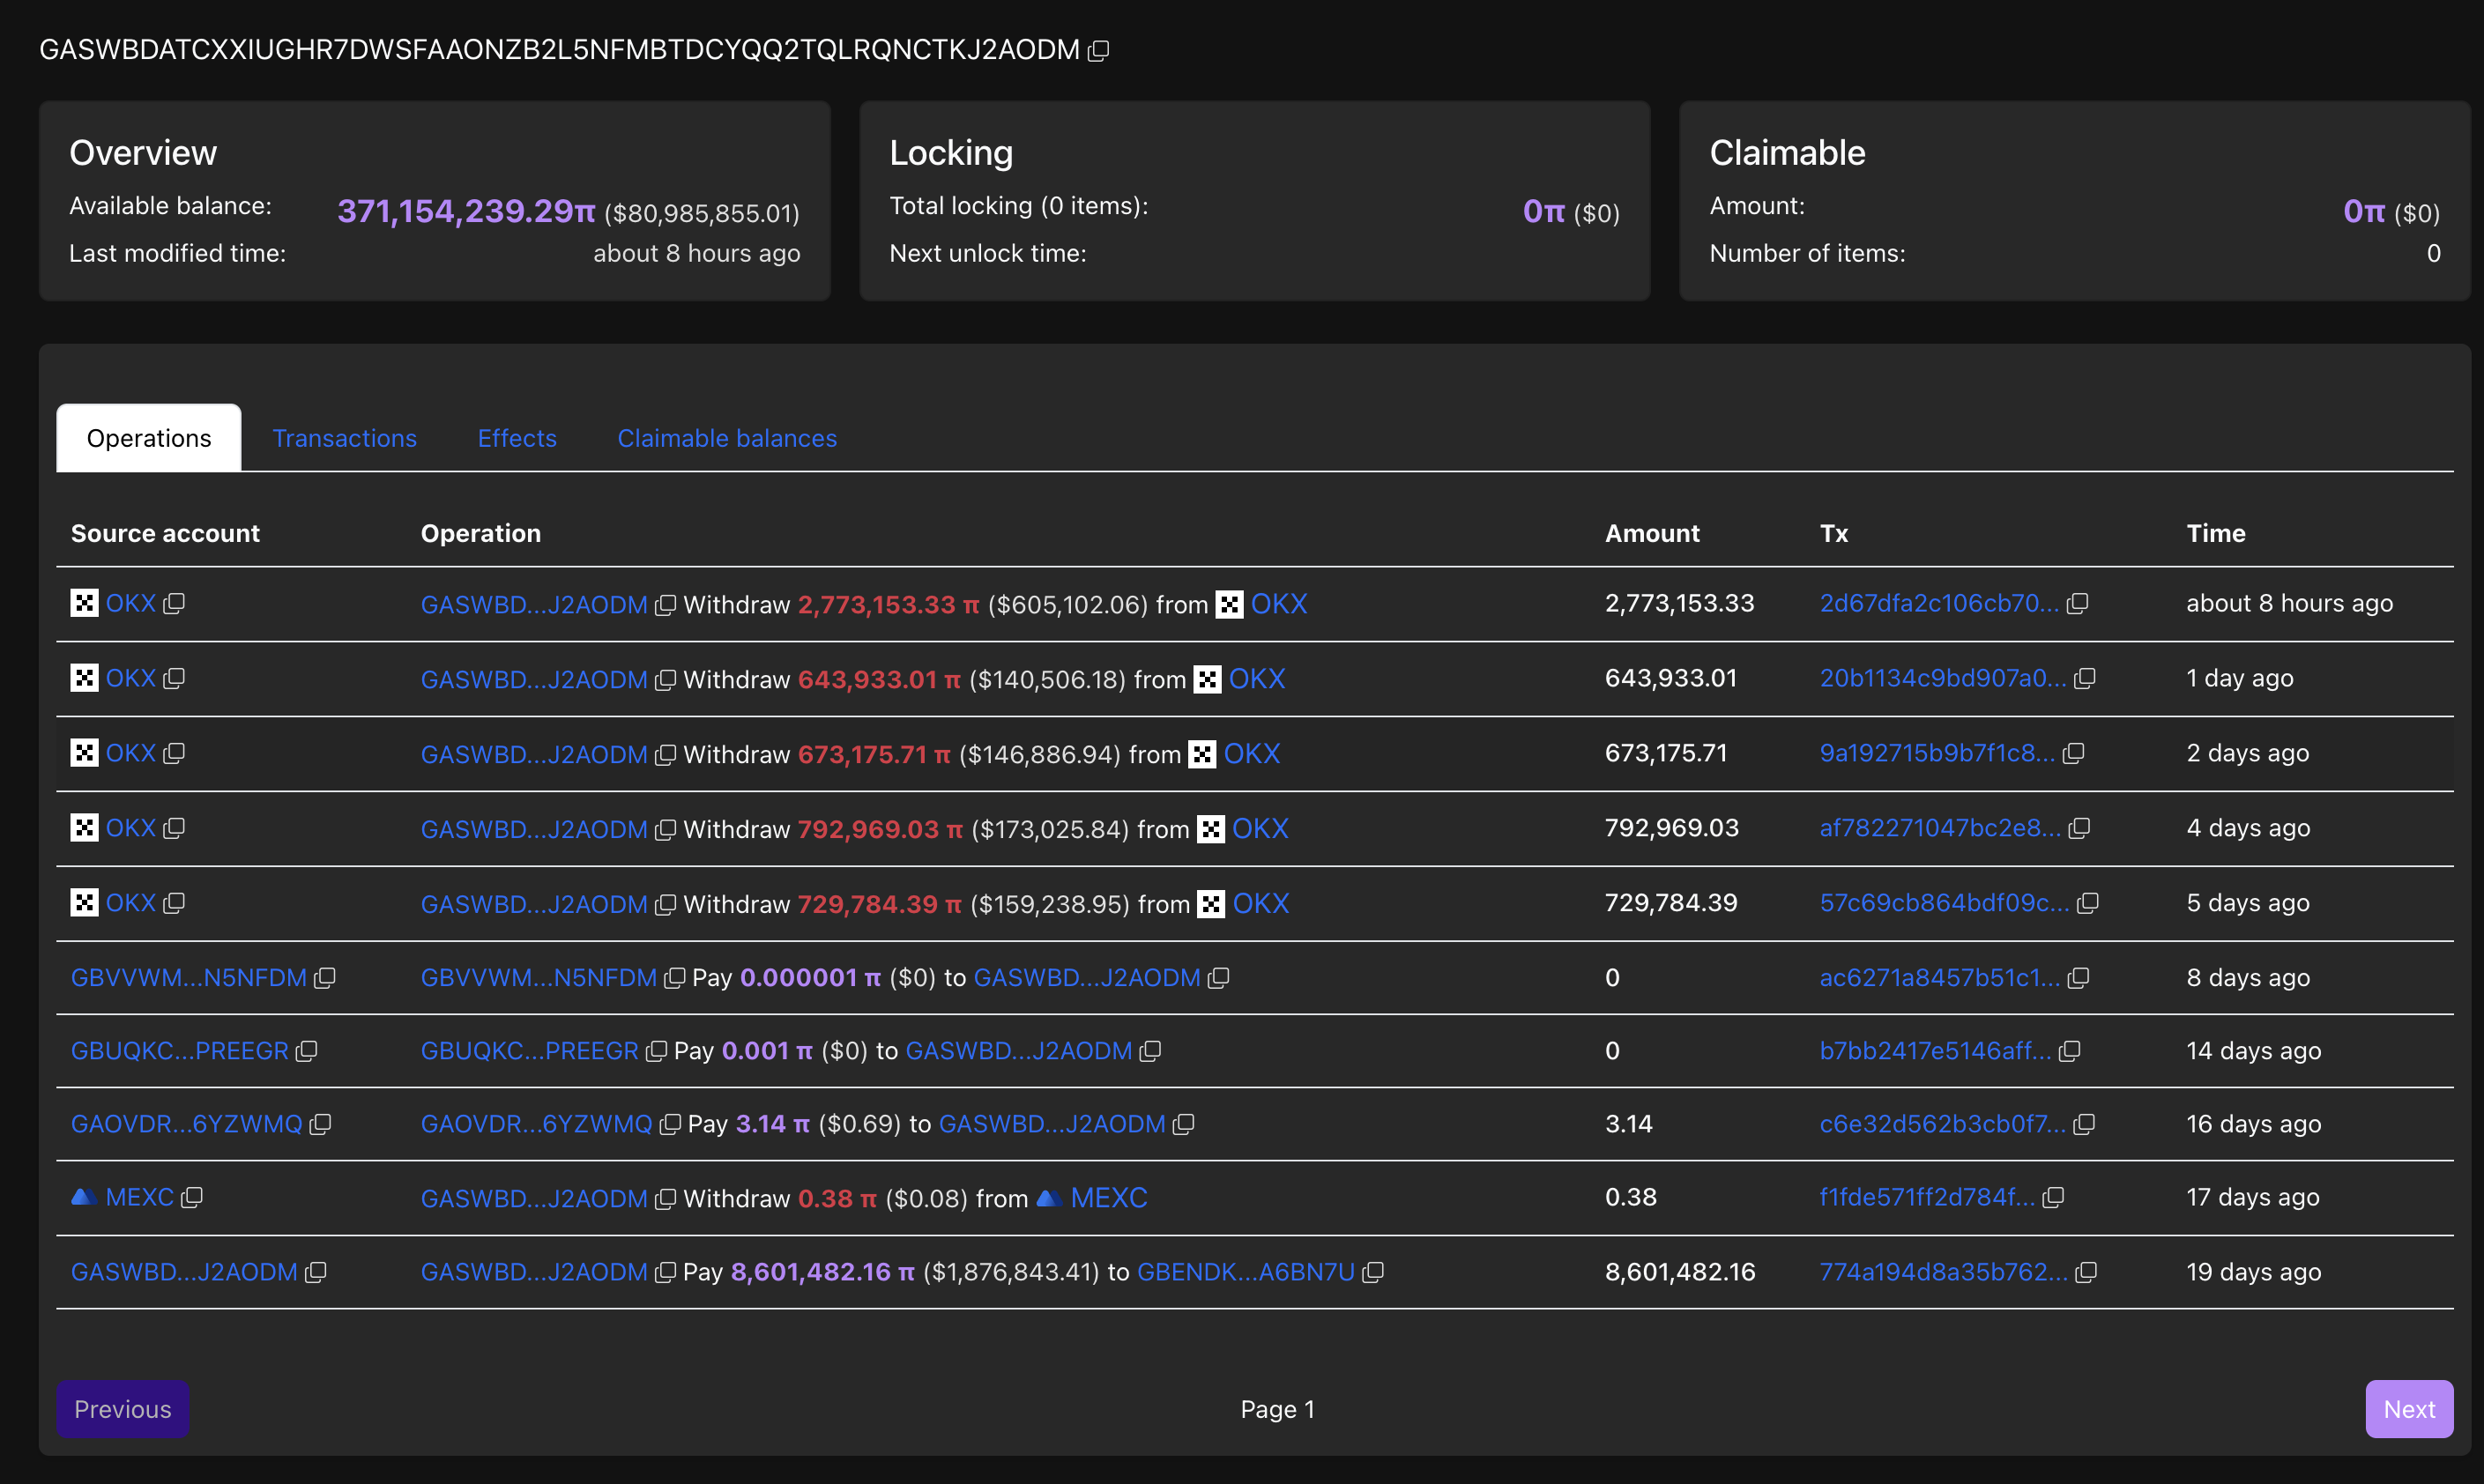
- A large wallet investor acquired 2.77 million PI tokens, marking the largest transaction in the last 24 hours.
Pi Network (PI) trades above $0.2100 at press time on Wednesday, after a 5.49% loss on Tuesday. Amid the intraday struggle and the prevailing downtrend, the on-chain data reflects support from large wallet investors and retail traders.
Still, the technical outlook indicates a bearish shift incoming in the trend momentum.
Steady on-exchange demand for PI
PiScan data shows a net outflow of 2.30 million PI tokens in the last 24 hours from the Know-Your-Business (KYB) verified Centralized Exchanges (CEXs) wallet balances. This indicates a 0.5481% decline in supply available on CEXs, reducing the selling pressure.
In the same line, the sixth-largest wallet on Pi Network acquired 2.77 million PI tokens, increasing its holdings to 371,154,239 tokens. This marked the largest transaction on the network in the last 24 hours, which could potentially lift the traders’ mood. Notably, the large wallet investor, commonly referred to as a whale, has been buying PI tokens for the last five consecutive days.
A steady reduction in supply pressure, as large wallet investors remain confident, sets the stage for a potential rebound in Pi coin.
Pi Network struggles to hold bullish momentum
Pi Network edges higher by over 2% at press time on Wednesday, bouncing off the $0.2063 low from earlier on the day. The intraday recovery aims for the 50-day Exponential Moving Average (EMA) at $0.2555, which acted as a dynamic resistance for the fourth time last week.
If PI marks a successful close above $0.2555, it could extend the uptrend to the August 1 low at $0.3220.
The technical indicators on the daily chart suggest a decline in buying pressure after PI reversed from the 50-day EMA last week. The Relative Strength Index (RSI) is at 42, standing between the halfway point and the oversold zone. At the same time, the Moving Average Convergence Divergence (MACD) retraces to the signal line, risking a crossover, which would confirm a renewal in bearish momentum.
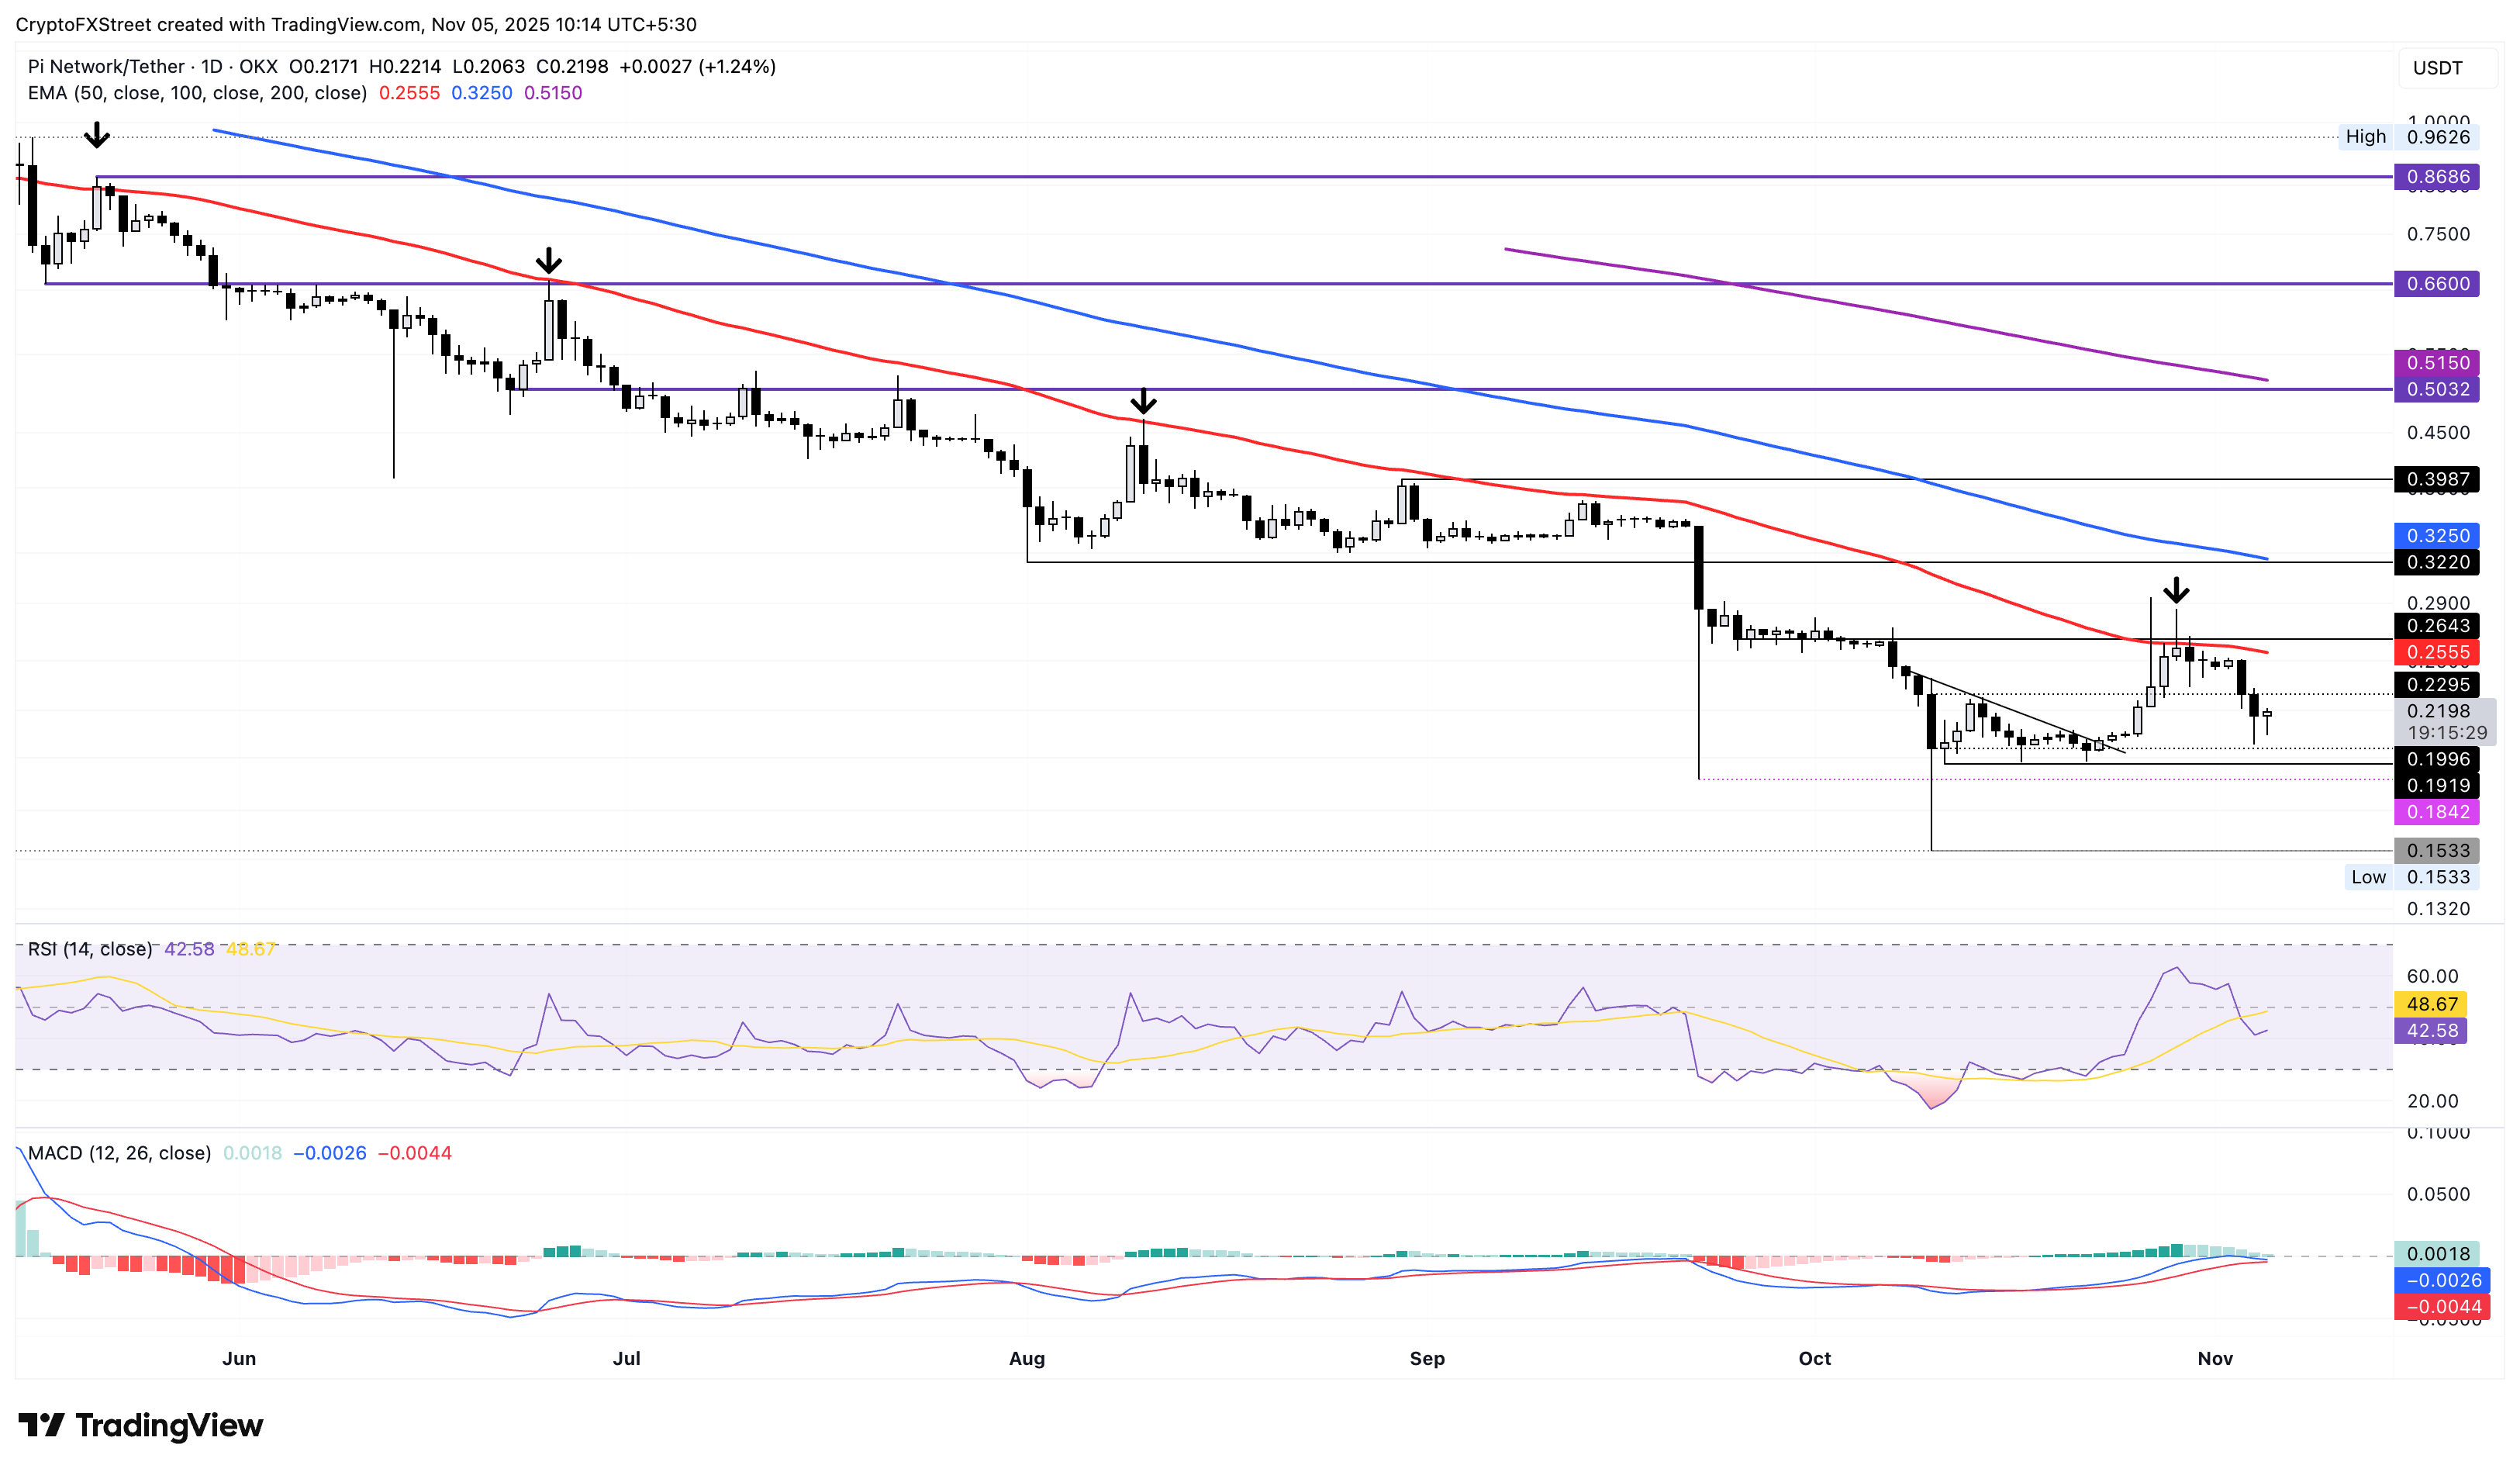
Looking down, the key support for PI remains the $0.1919 low from October 11.
Bitcoin, altcoins, stablecoins FAQs
Bitcoin is the largest cryptocurrency by market capitalization, a virtual currency designed to serve as money. This form of payment cannot be controlled by any one person, group, or entity, which eliminates the need for third-party participation during financial transactions.
Altcoins are any cryptocurrency apart from Bitcoin, but some also regard Ethereum as a non-altcoin because it is from these two cryptocurrencies that forking happens. If this is true, then Litecoin is the first altcoin, forked from the Bitcoin protocol and, therefore, an “improved” version of it.
Stablecoins are cryptocurrencies designed to have a stable price, with their value backed by a reserve of the asset it represents. To achieve this, the value of any one stablecoin is pegged to a commodity or financial instrument, such as the US Dollar (USD), with its supply regulated by an algorithm or demand. The main goal of stablecoins is to provide an on/off-ramp for investors willing to trade and invest in cryptocurrencies. Stablecoins also allow investors to store value since cryptocurrencies, in general, are subject to volatility.
Bitcoin dominance is the ratio of Bitcoin's market capitalization to the total market capitalization of all cryptocurrencies combined. It provides a clear picture of Bitcoin’s interest among investors. A high BTC dominance typically happens before and during a bull run, in which investors resort to investing in relatively stable and high market capitalization cryptocurrency like Bitcoin. A drop in BTC dominance usually means that investors are moving their capital and/or profits to altcoins in a quest for higher returns, which usually triggers an explosion of altcoin rallies.
Bài viết đề xuất


