
MYX Finance Price Forecast: A potential bull trap brewing in MYX
- MYX Finance hits a new record high as its uptrend gains further traction.
- MYX denies fraud claims over its token airdrop.
- Open Interest declines amid rising long positions, suggesting a potential bull trap.
MYX Finance (MYX) sustains an uptrend in motion amid allegations of fraud and potential bull trap, reaching a record high on Thursday. The derivative and technical outlook suggest mixed signals amid interest cooling off and a possible top formation.
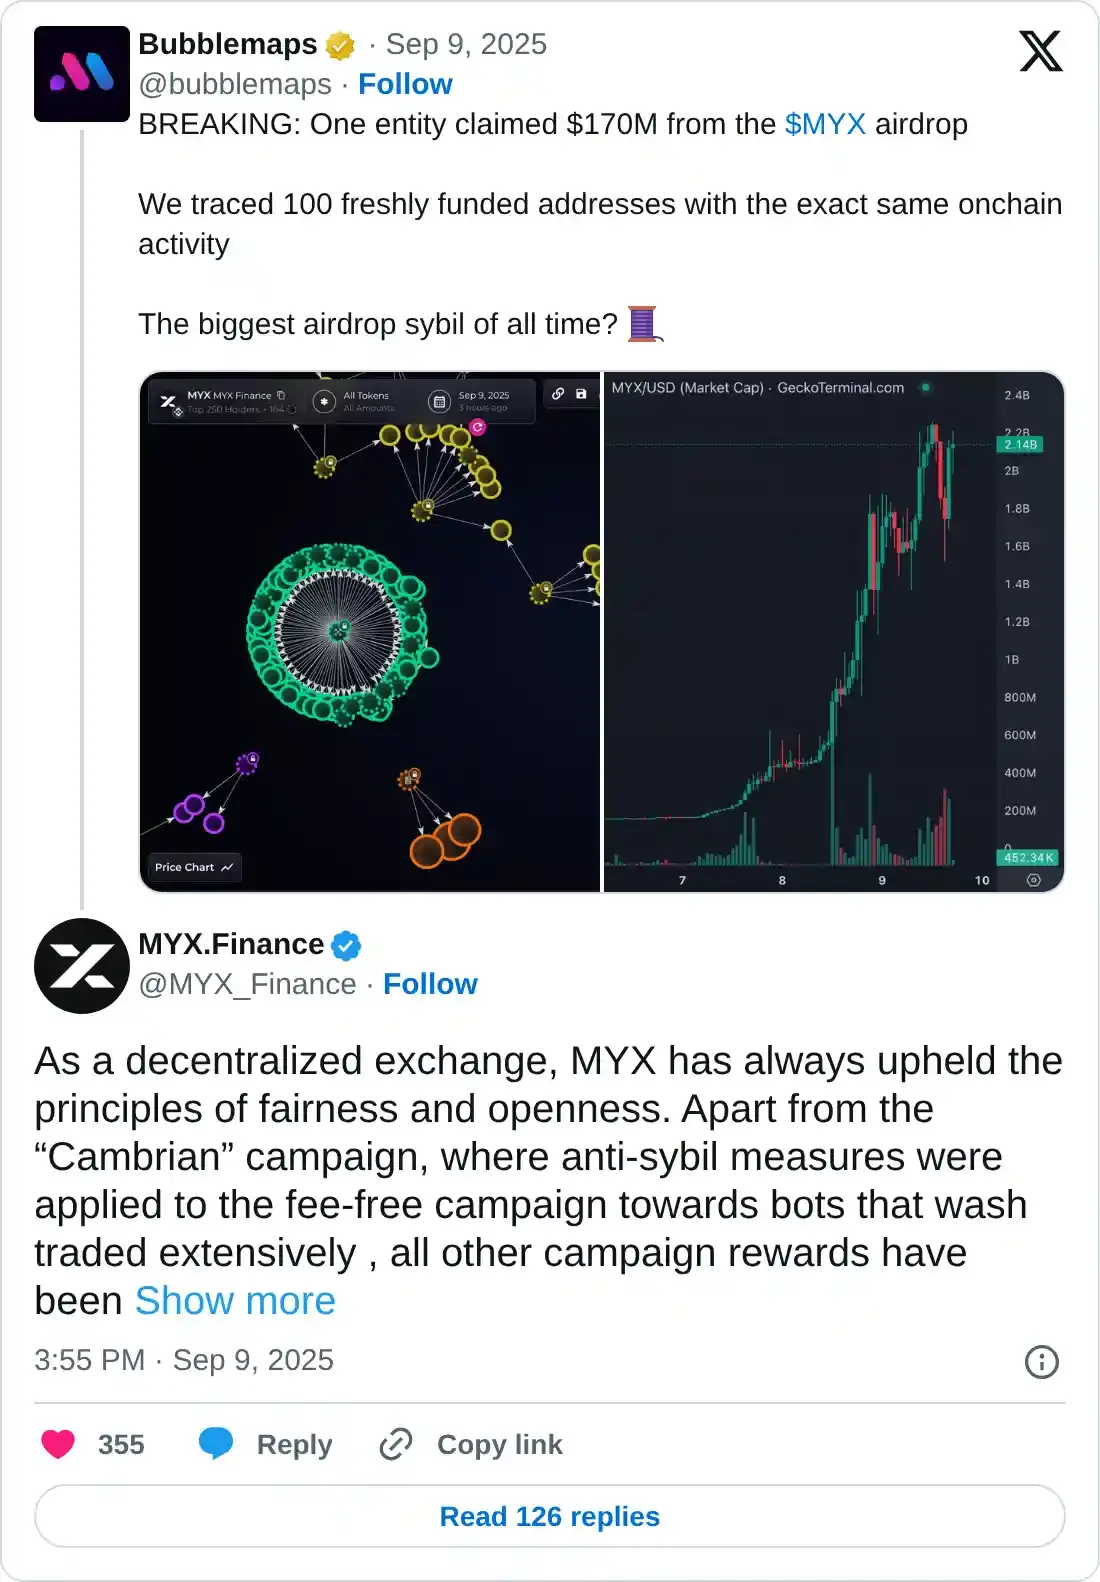
MYX Finance denies manipulation in the token airdrop
Bubblemaps, an on-chain analytics platform, alleged manipulations during the MYX token airdrop, where a single entity is alleged to have claimed over $170 million. The claim also included 100 new accounts following the same modus operandi.
Denying such claims, MYX Finance emphasized its Decentralized Exchange (DEX) model and highlighted the anti-sybil attack measures applied at the Cambrian campaign. A sybil attack is a security breach where an attacker gains control through multiple fake identities in a network.
The DEX noted that all other campaigns were without any restrictions, solely based on users’ trading volume and LP contributions. It also highlighted that no restrictions were applied to multiple high-volume participants who requested an address change before launch.
Moving forward, the team has promised to put strict anti-sybil measures in place.
Derivatives data signal potential bull trap
CoinGlass data shows that the MYX Open Interest (OI) has declined to $314.93 million, from the record high of $396.48 million on Tuesday. This sudden loss of capital in the derivatives market points to lowered interest among traders.
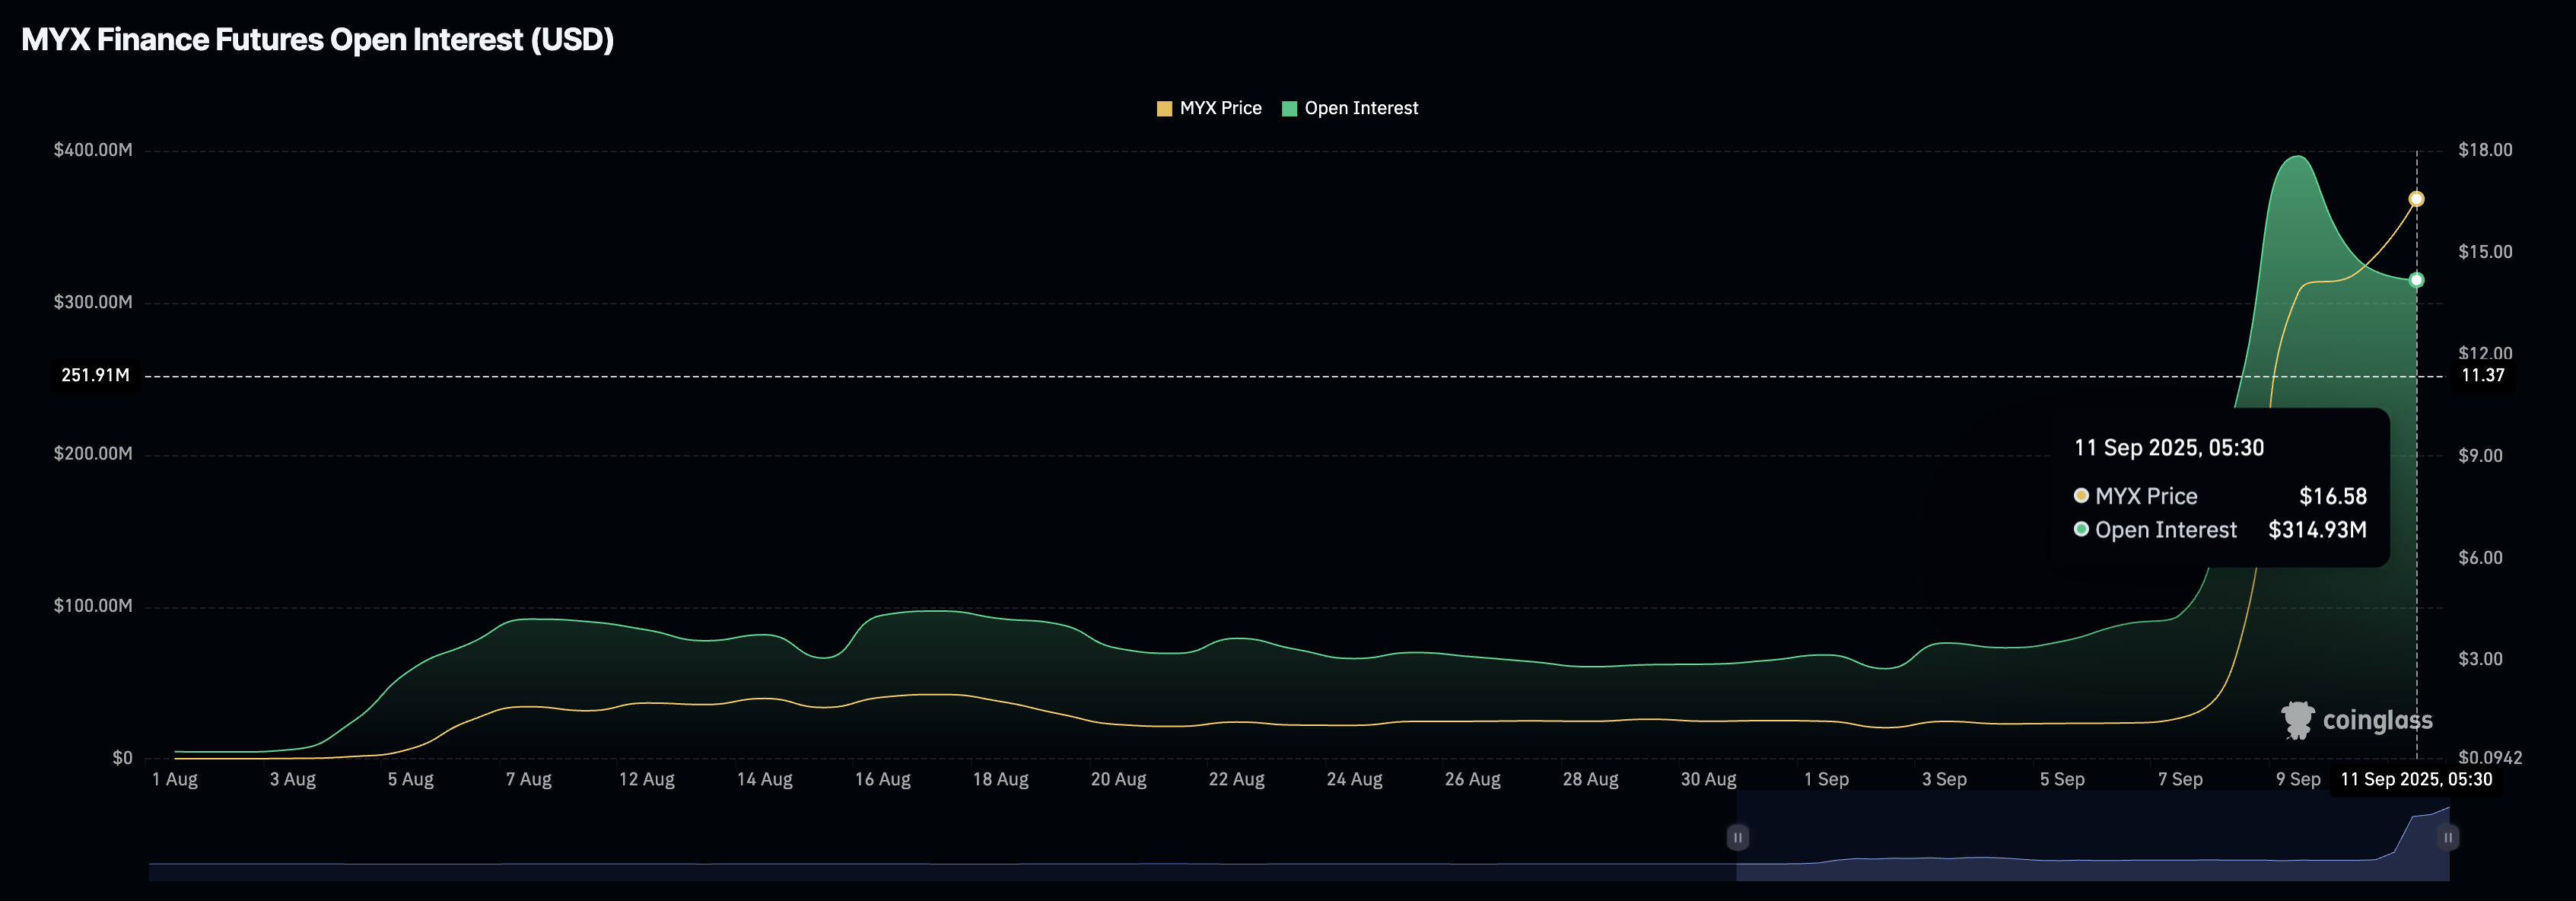
MYX Open Interest. Source: CoinGlass
Amid this, the Taker buy/sell ratio displays a surge in long positions to 53.12% over the last 24 hours, from 50.18% on Wednesday. As the declining open interest signals a lowered interest, it could trap the traders building long positions.
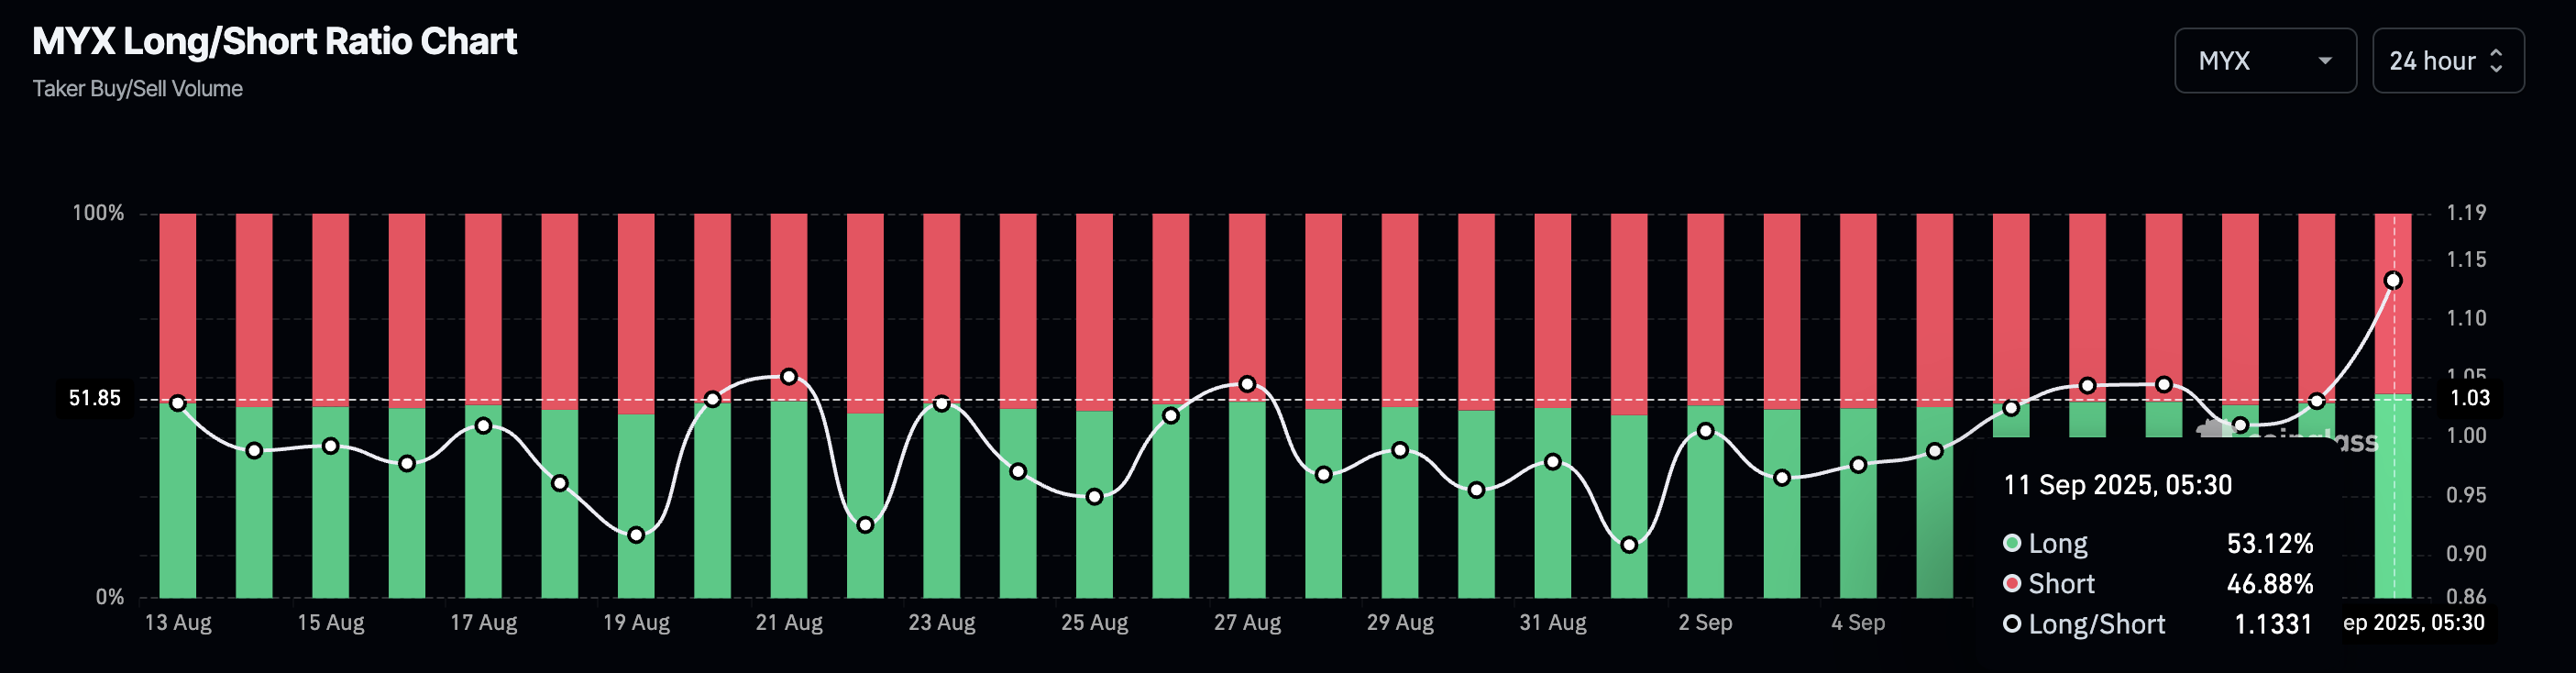
MYX long/short ratio. Source: CoinGlass
MYX hit an all-time high as profit-booking scare looms
MYX edges higher by 13% at press time on Thursday, extending the uptrend for the sixth consecutive day, which accounts for a surge of over 400% rise this week. The DEX token trades at an all-time high, entering a price discovery mode.
The uptrend could target the 1.272 Fibonacci level at $27.93, which is derived from the retracement between $1.13 low of Saturday and $14.08 close of Monday.
Adding to the bullish potential, the Relative Strength Index (RSI) at 97 shows extremely high levels of buying pressure, which could melt down to a profit-booking spree.
Still, the Moving Average Convergence Divergence (MACD) indicator displays a successive rise in green histogram bars, indicating a boost in bullish momentum.
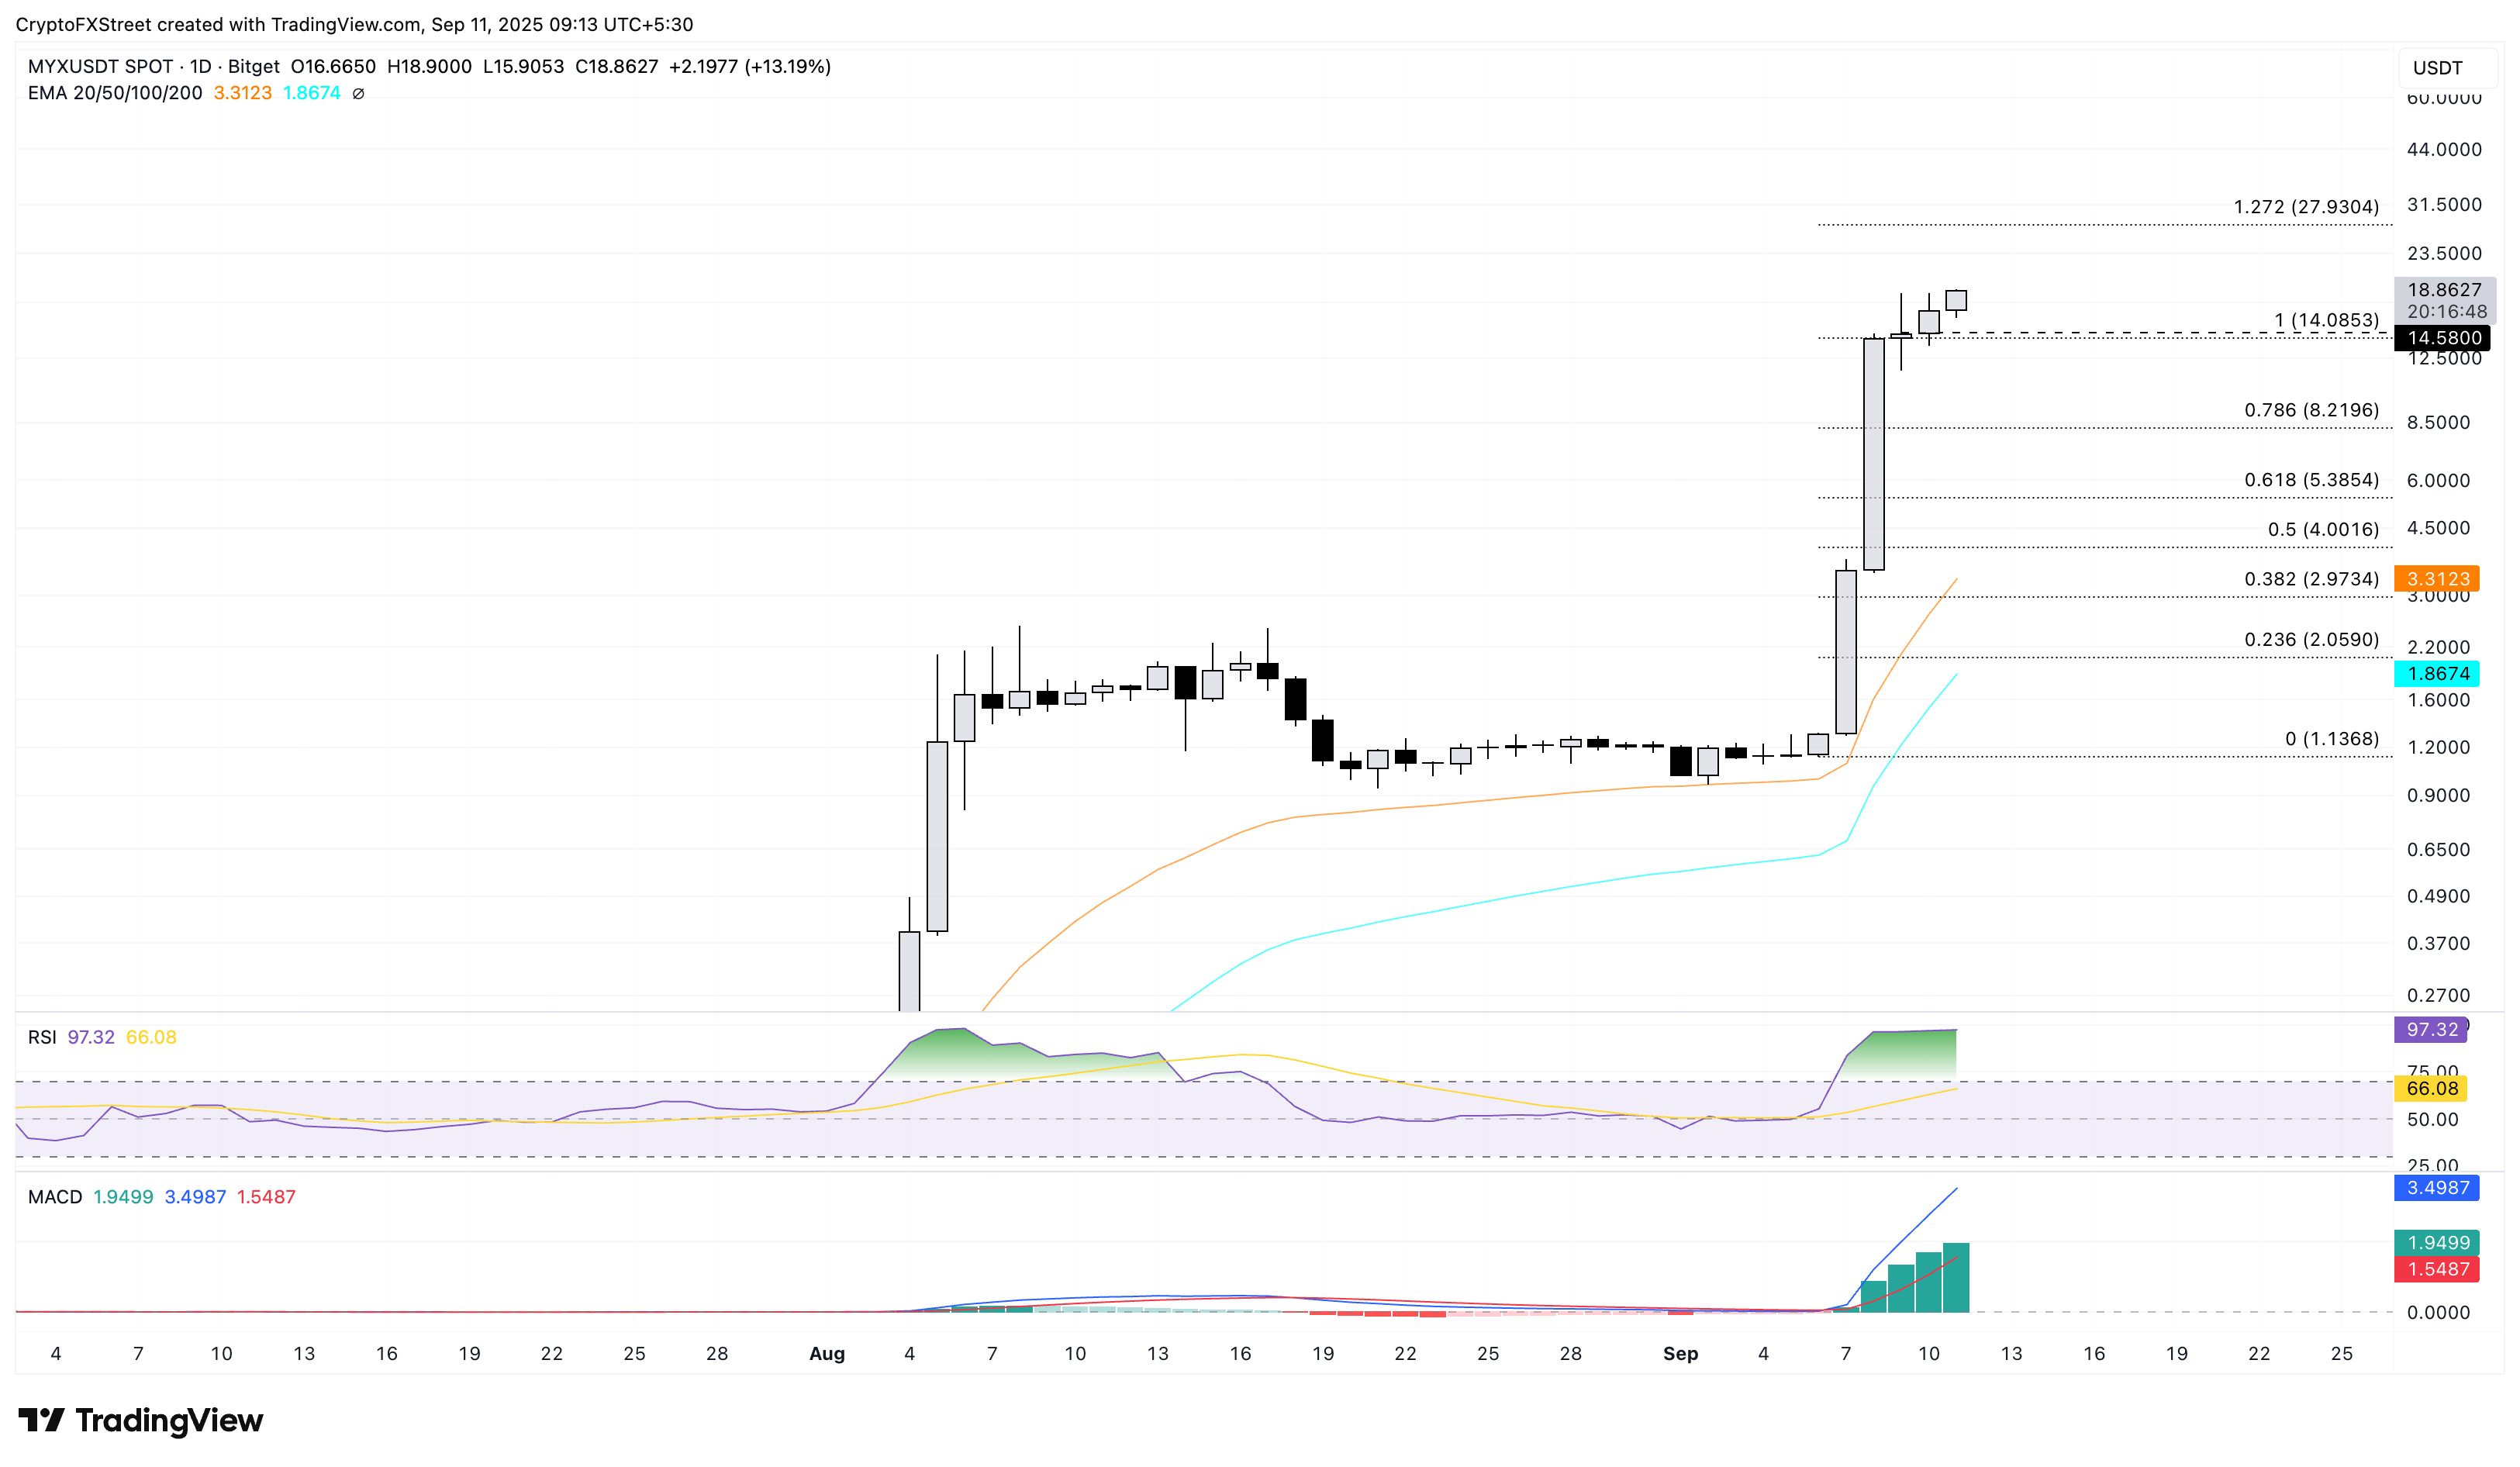
MYX/USDT daily price chart.
Looking down, MYX could test the 78.6% Fibonacci level at $8.21 if it drops below the $14.00 figure.
Bài viết đề xuất


