Crypto Today: Bitcoin, XRP show recovery strength as Ethereum consolidates
- Bitcoin holds above $111,000, buoyed by growing optimism as the US Fed is set to cut interest rates next week.
- Ethereum consolidates above $4,078 support as risk-off sentiment persists.
- XRP extends recovery eyeing a breakout above the $3.00 pivotal level.
Bitcoin (BTC) offers bullish signals, trading above $112,000 on Monday. Despite recent fluctuations in price, interest in Bitcoin remains elevated, particularly among corporate holders.
As for altcoins, Ripple (XRP) is edging higher, following in Bitcoin’s footsteps, while Ethereum (ETH) extends sideways trading above its short-term support around $4,078.
Data spotlight: Bitcoin rises as investors focus on the Fed
Bitcoin’s bullish outlook is largely hinged on the growing optimism that the United States (US) Federal Reserve (Fed) would cut interest rates next week.
According to the CME FedWatch tool, there is a 90.1% chance that the Federal Reserve will cut rates by 25 basis points (bps) to a range of 4% to 4.25%, a potential lifeline for risk asset classes, such as crypto and Equities.
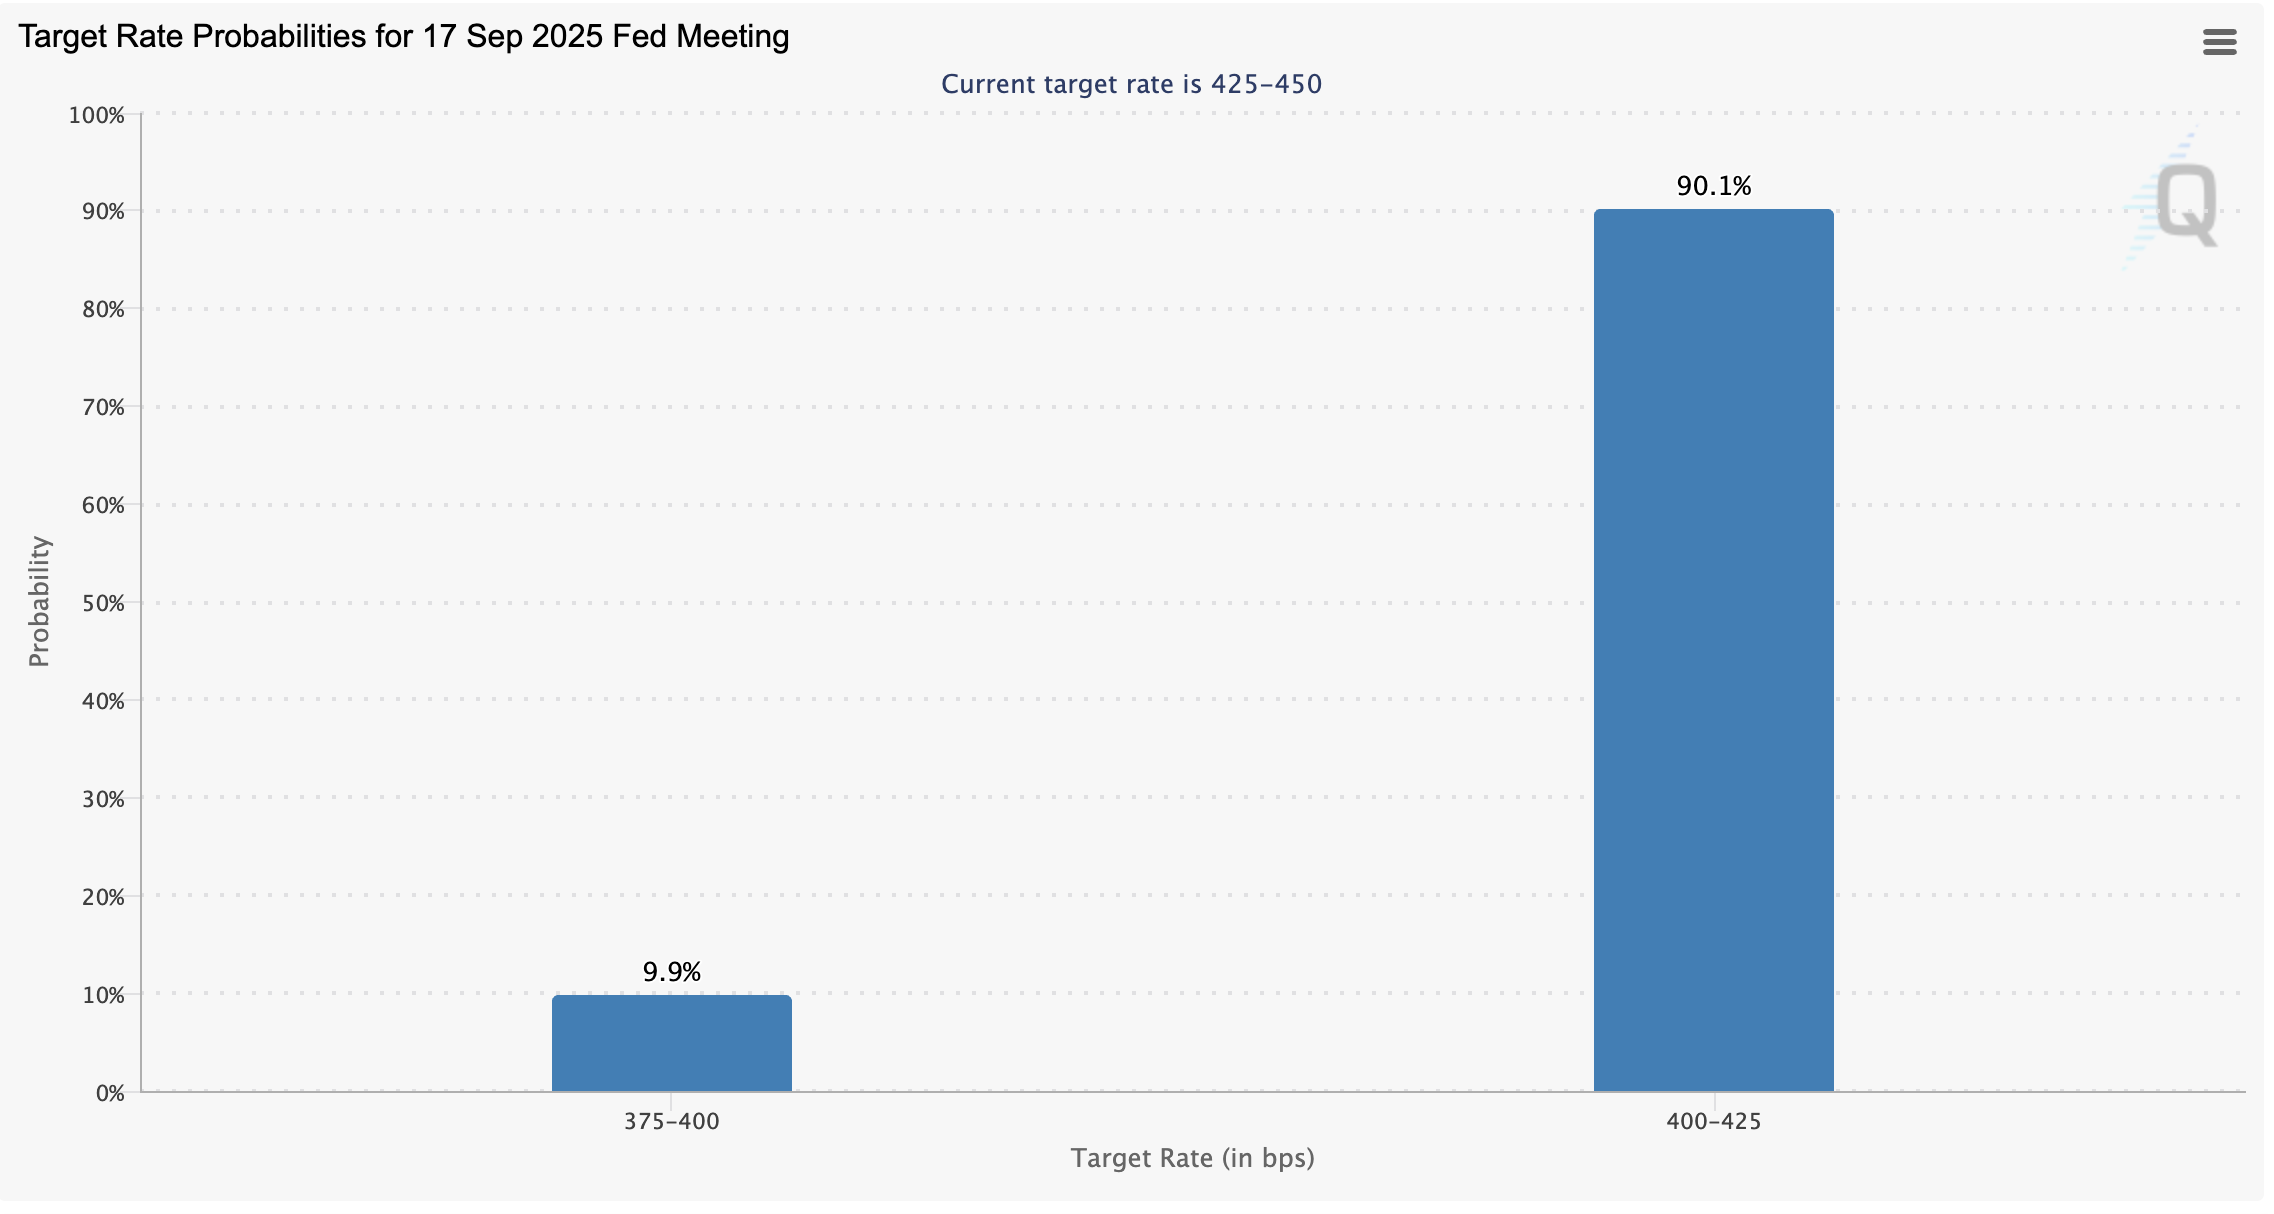
FedWatch tool | Source: CME Group
Despite high market expectations, Fed officials will consider incoming economic data, including the Producer Price Index (PPI) on Wednesday, the Consumer Price Index (CPI) and Jobless Claims on Thursday, when assessing the US economic standpoint ahead of the September 17 interest rate decision.
Meanwhile, interest in Bitcoin remains high, particularly among treasury companies, which cumulatively hold approximately 847,470 BTC, valued at $94.7 billion, according to SoSoValue.
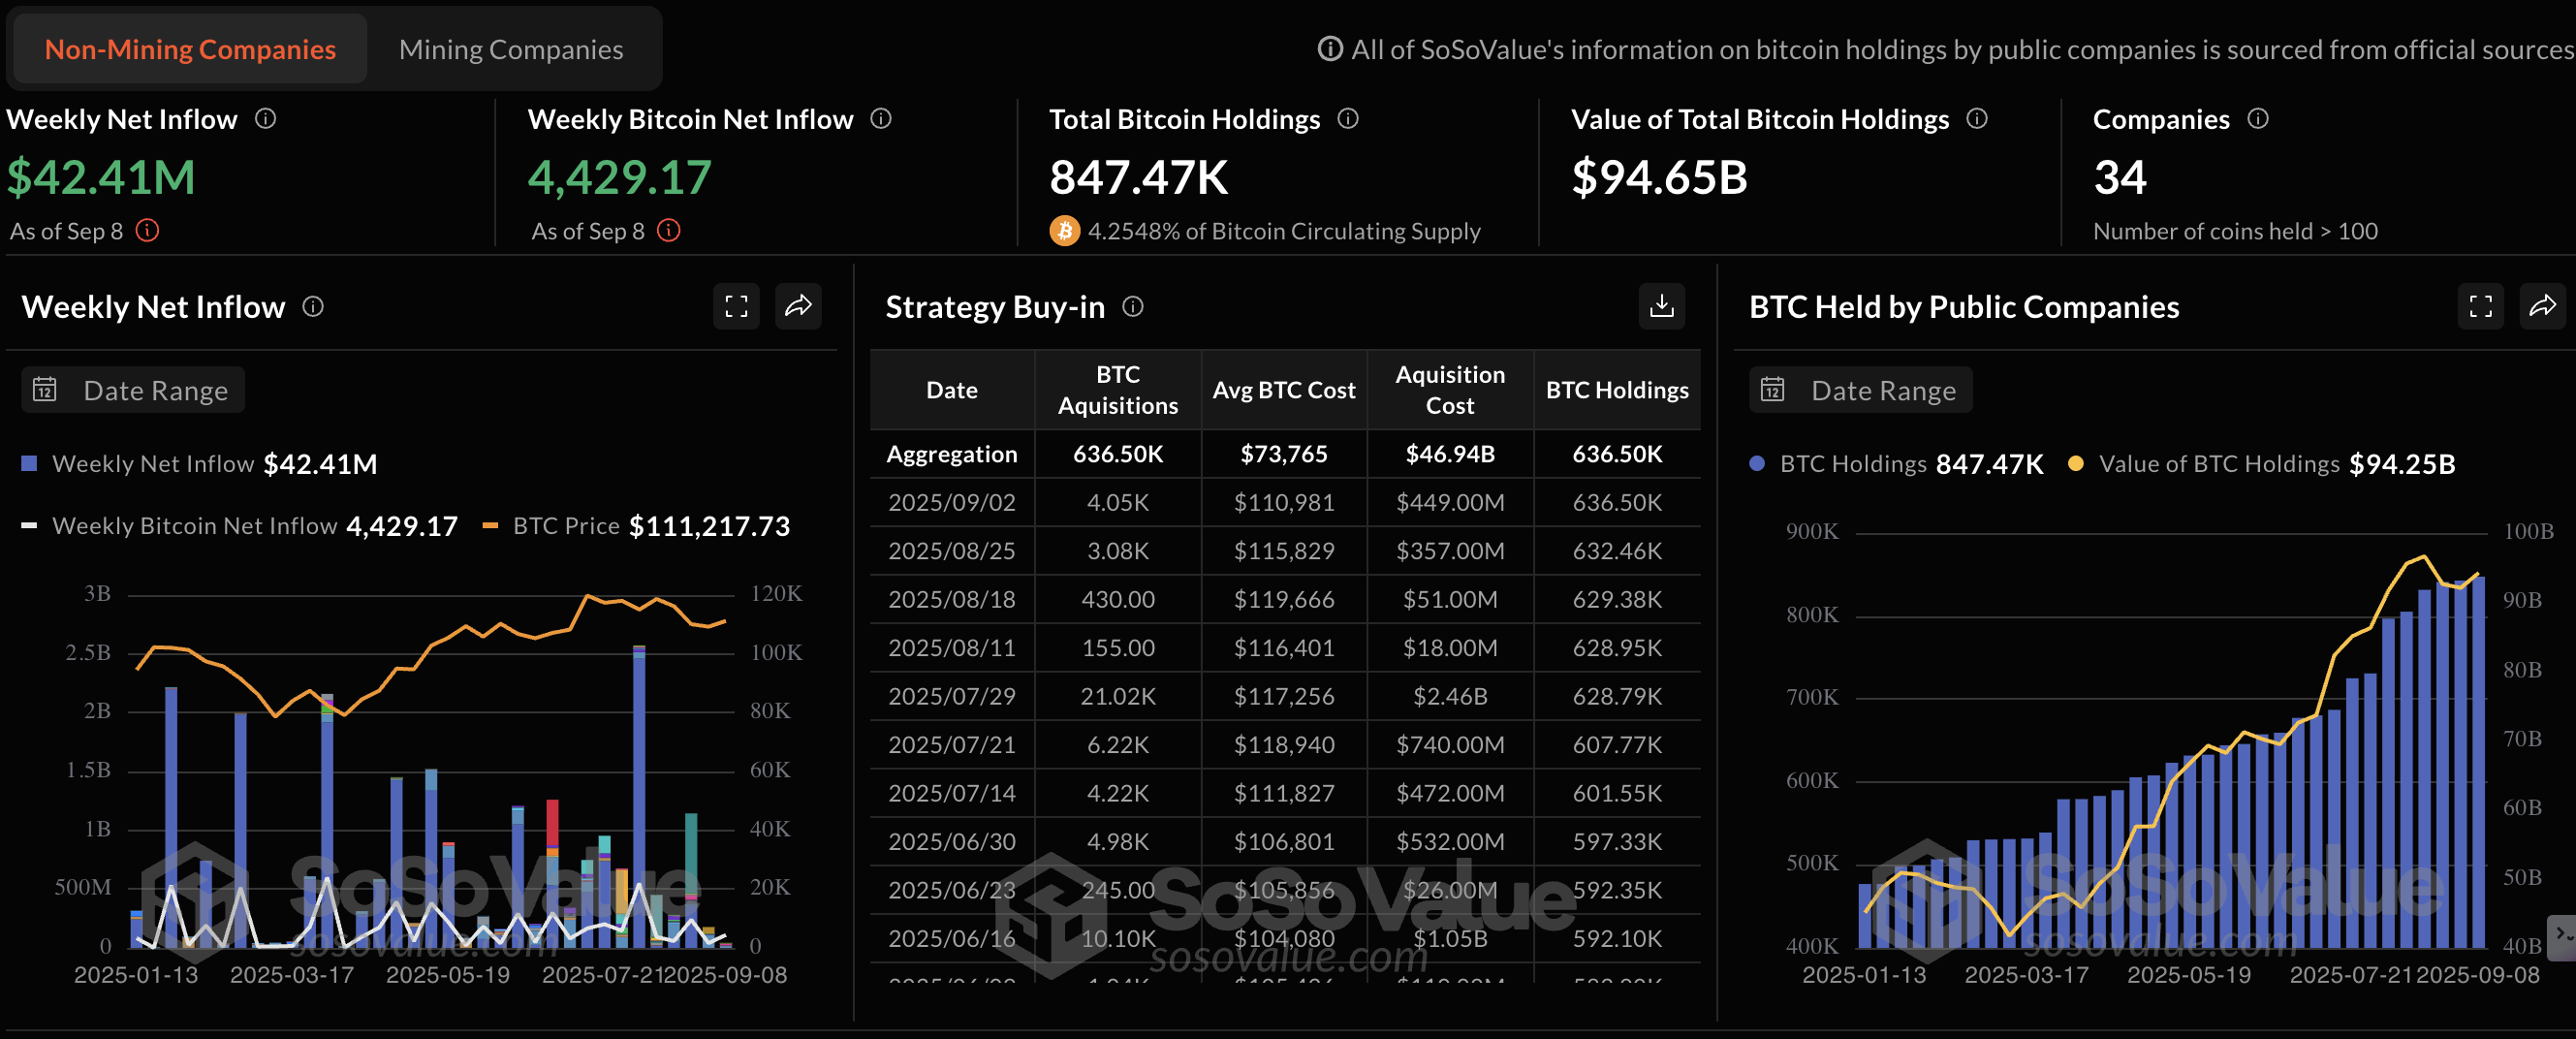
Bitcoin treasuries holdings | Source: SoSoValue
Japan’s Metaplanet continues to increase exposure to the largest cryptocurrency by market capitalization, purchasing an additional 136 BTC worth around $15.26 million on Monday. Metaplanet (3350) currently holds 20,136 BTC, valued at $2.24 billion, at an average cost of $102,495. It is the fifth-largest corporate holder of Bitcoin behind Bullish (BLSH), Bitcoin Standard Treasury Company (BSTR), XXI (CEP) and Strategy (MSTR).
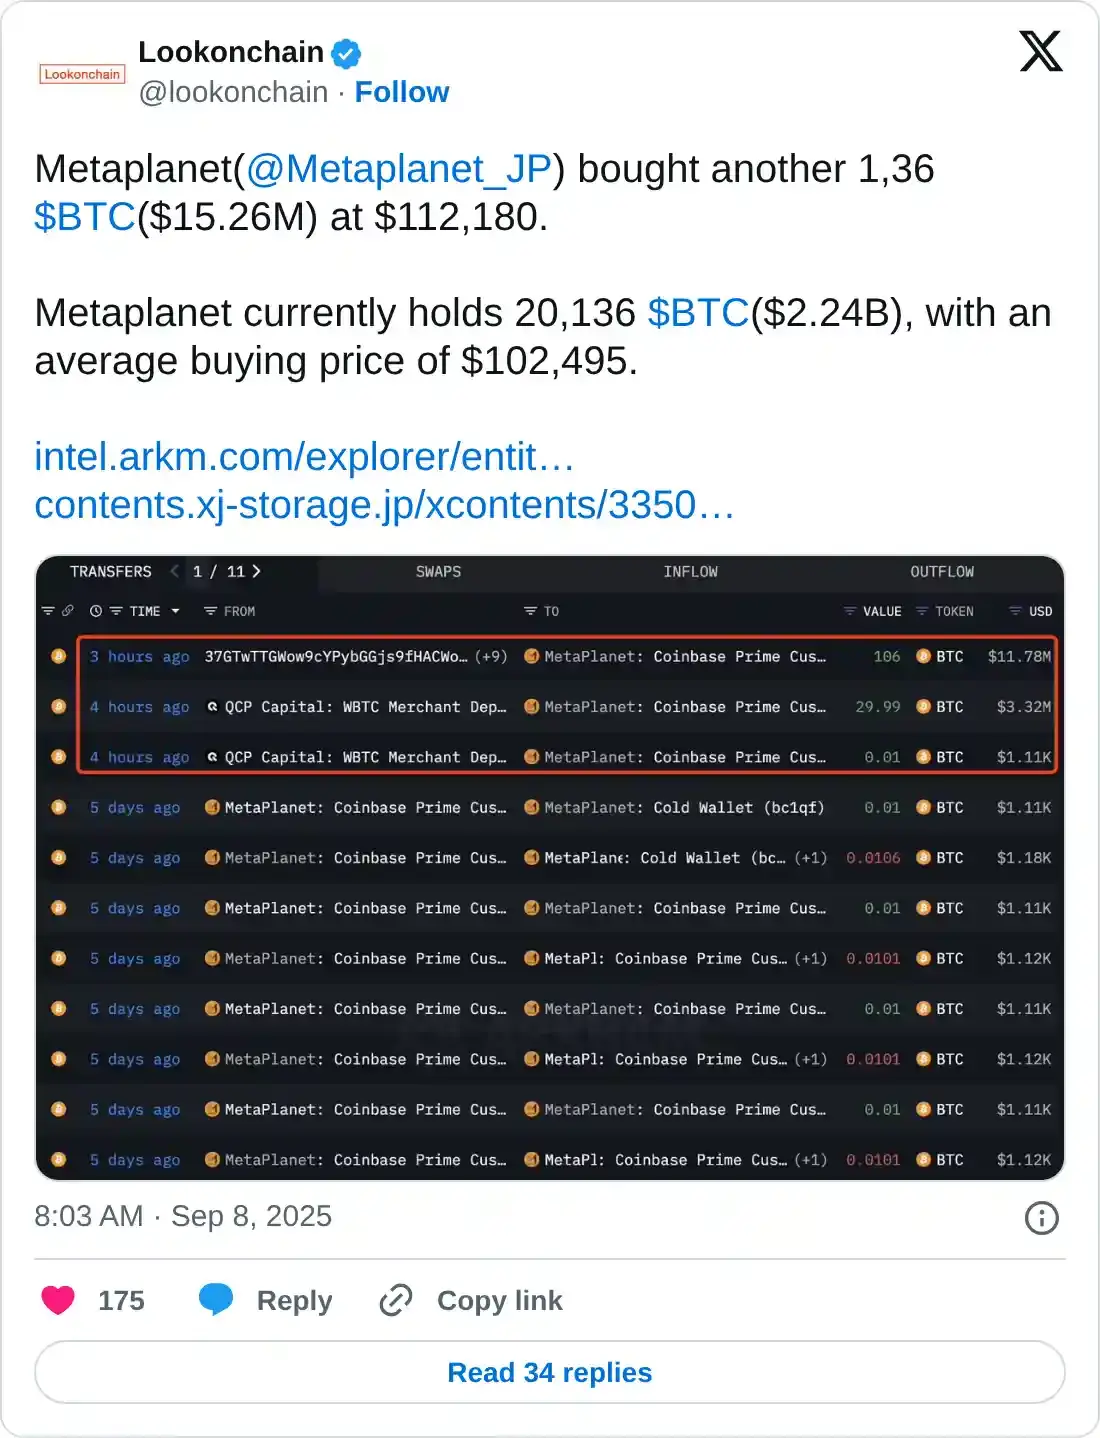
Chart of the day: Bitcoin eyes $118,000 breakout
Bitcoin hovers above $111,000 short-term support at the time of writing on Monday, as bulls take another shot at extending recovery toward the $118,000 medium-term resistance.
The daily chart below highlights a bullish structure underpinned by a buy signal from the Moving Average Convergence Divergence. The blue MACD line crossed above the red signal line on Sunday, encouraging traders to seek exposure.
The positive tone for BTC has since increased, as evidenced by the reversal of the Relative Strength Index (RSI) at 48. A break above the midline would indicate bullish momentum and increase the probability of the Bitcoin price stabilizing the uptrend toward the $118,000 level.
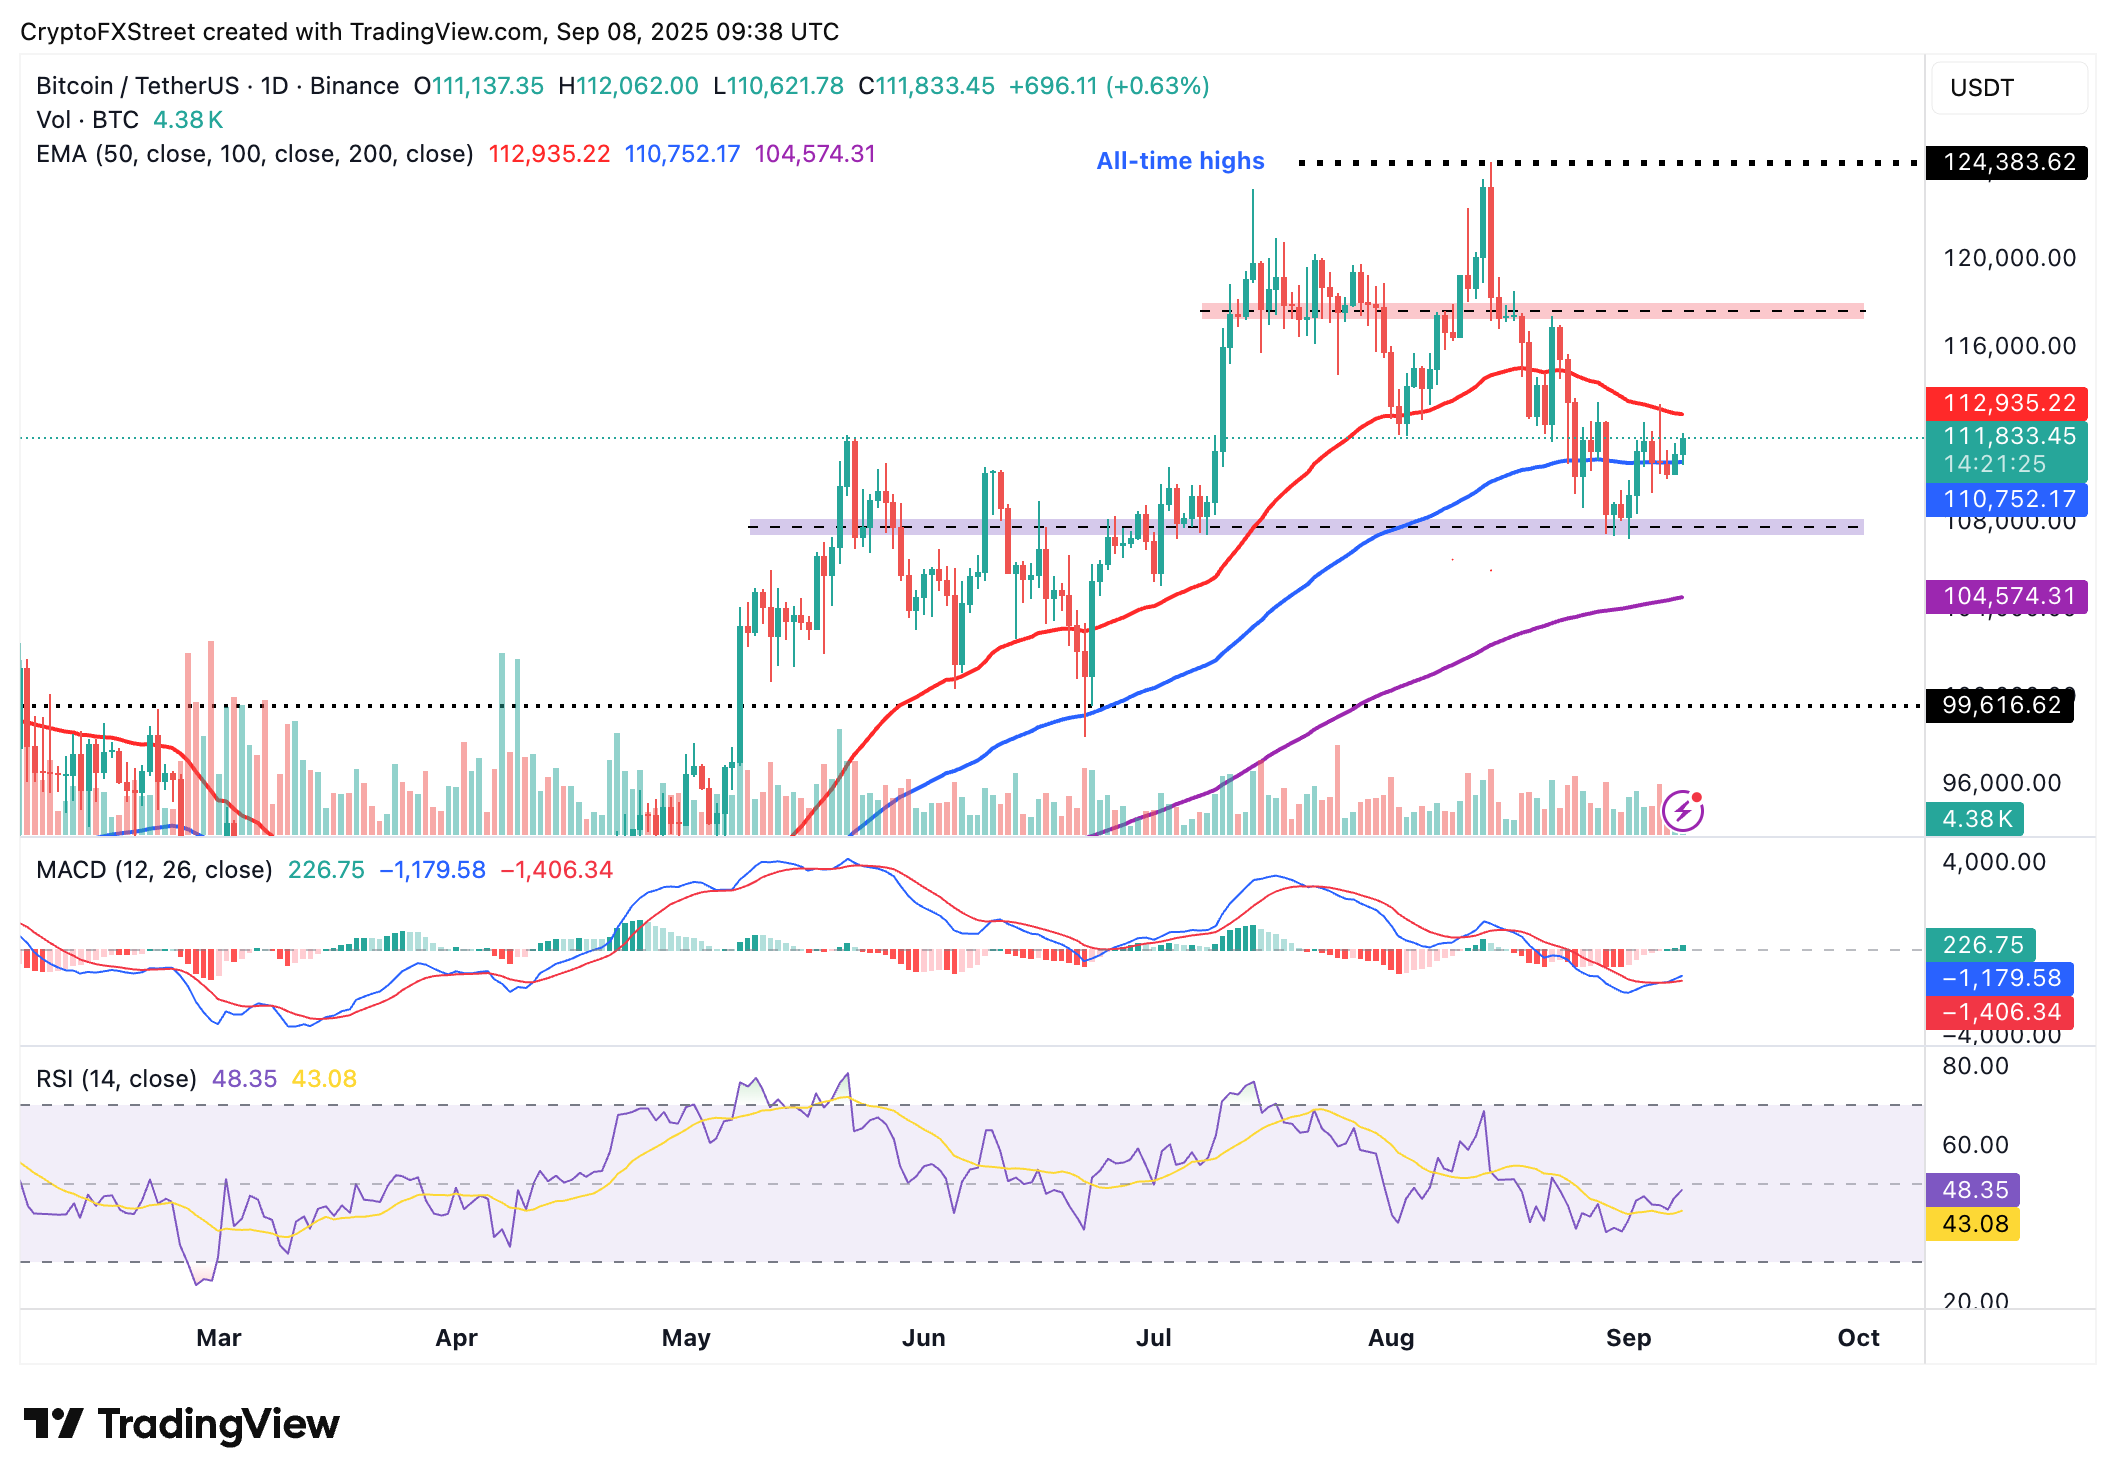
BTC/USDT daily chart
If traders book early profits, resulting in a price reversal, the 100-day Exponential Moving Average (EMA) at $110,752 is in line to absorb the selling pressure.
Altcoins update: Ethereum consolidates as XRP showcases recovery signs
Ethereum trades relatively sideways between support at around $4,078 and resistance around its all-time high of $4,956 reached on August 24. The smart contracts token also holds above key upward-facing moving averages, including the 50-day EMA at $4,078, the 100-day EMA at $3,620 and the 200-day EMA at $3,200, which back a potential bullish outcome.
Still, traders must be cautious, considering the MACD indicator has maintained a sell signal since August 25. Investors may remain on the sidelines as long as the MACD maintains the sell signal, thereby increasing the likelihood of a prolonged downtrend.
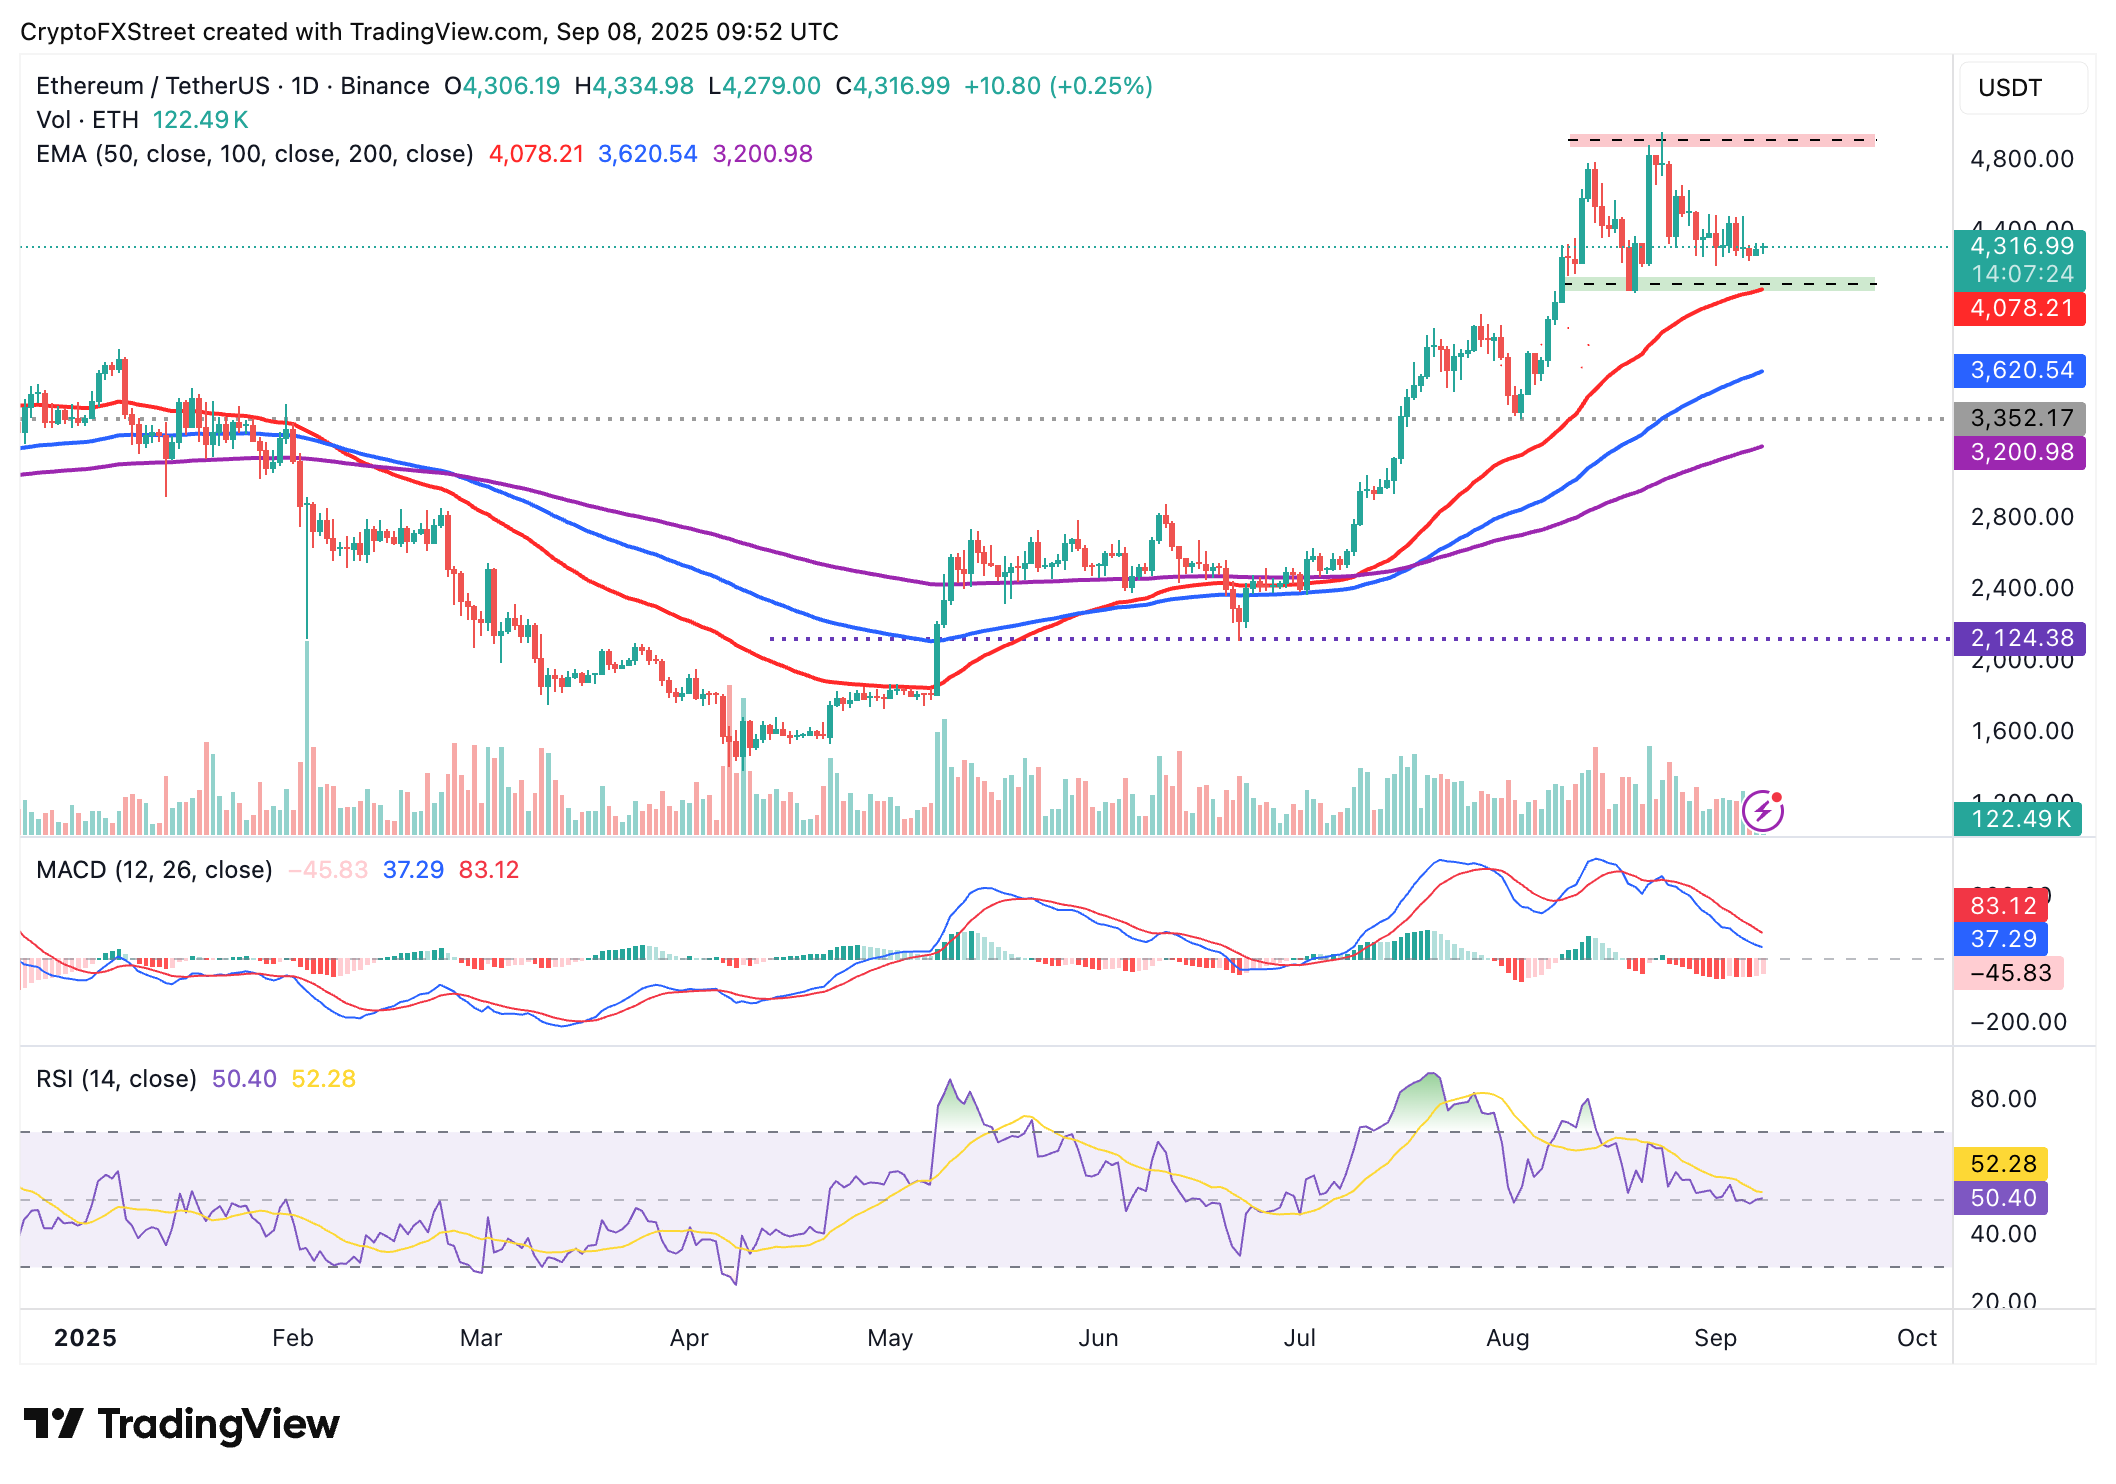
ETH/USDT daily chart
As for XRP, bulls are gearing up for a breakout above the $3.00 pivotal level, which could pave the way for gains toward the record high of $3.66 reached on July 18. The token holds above the 50-day EMA at $2.90, providing short-term support.
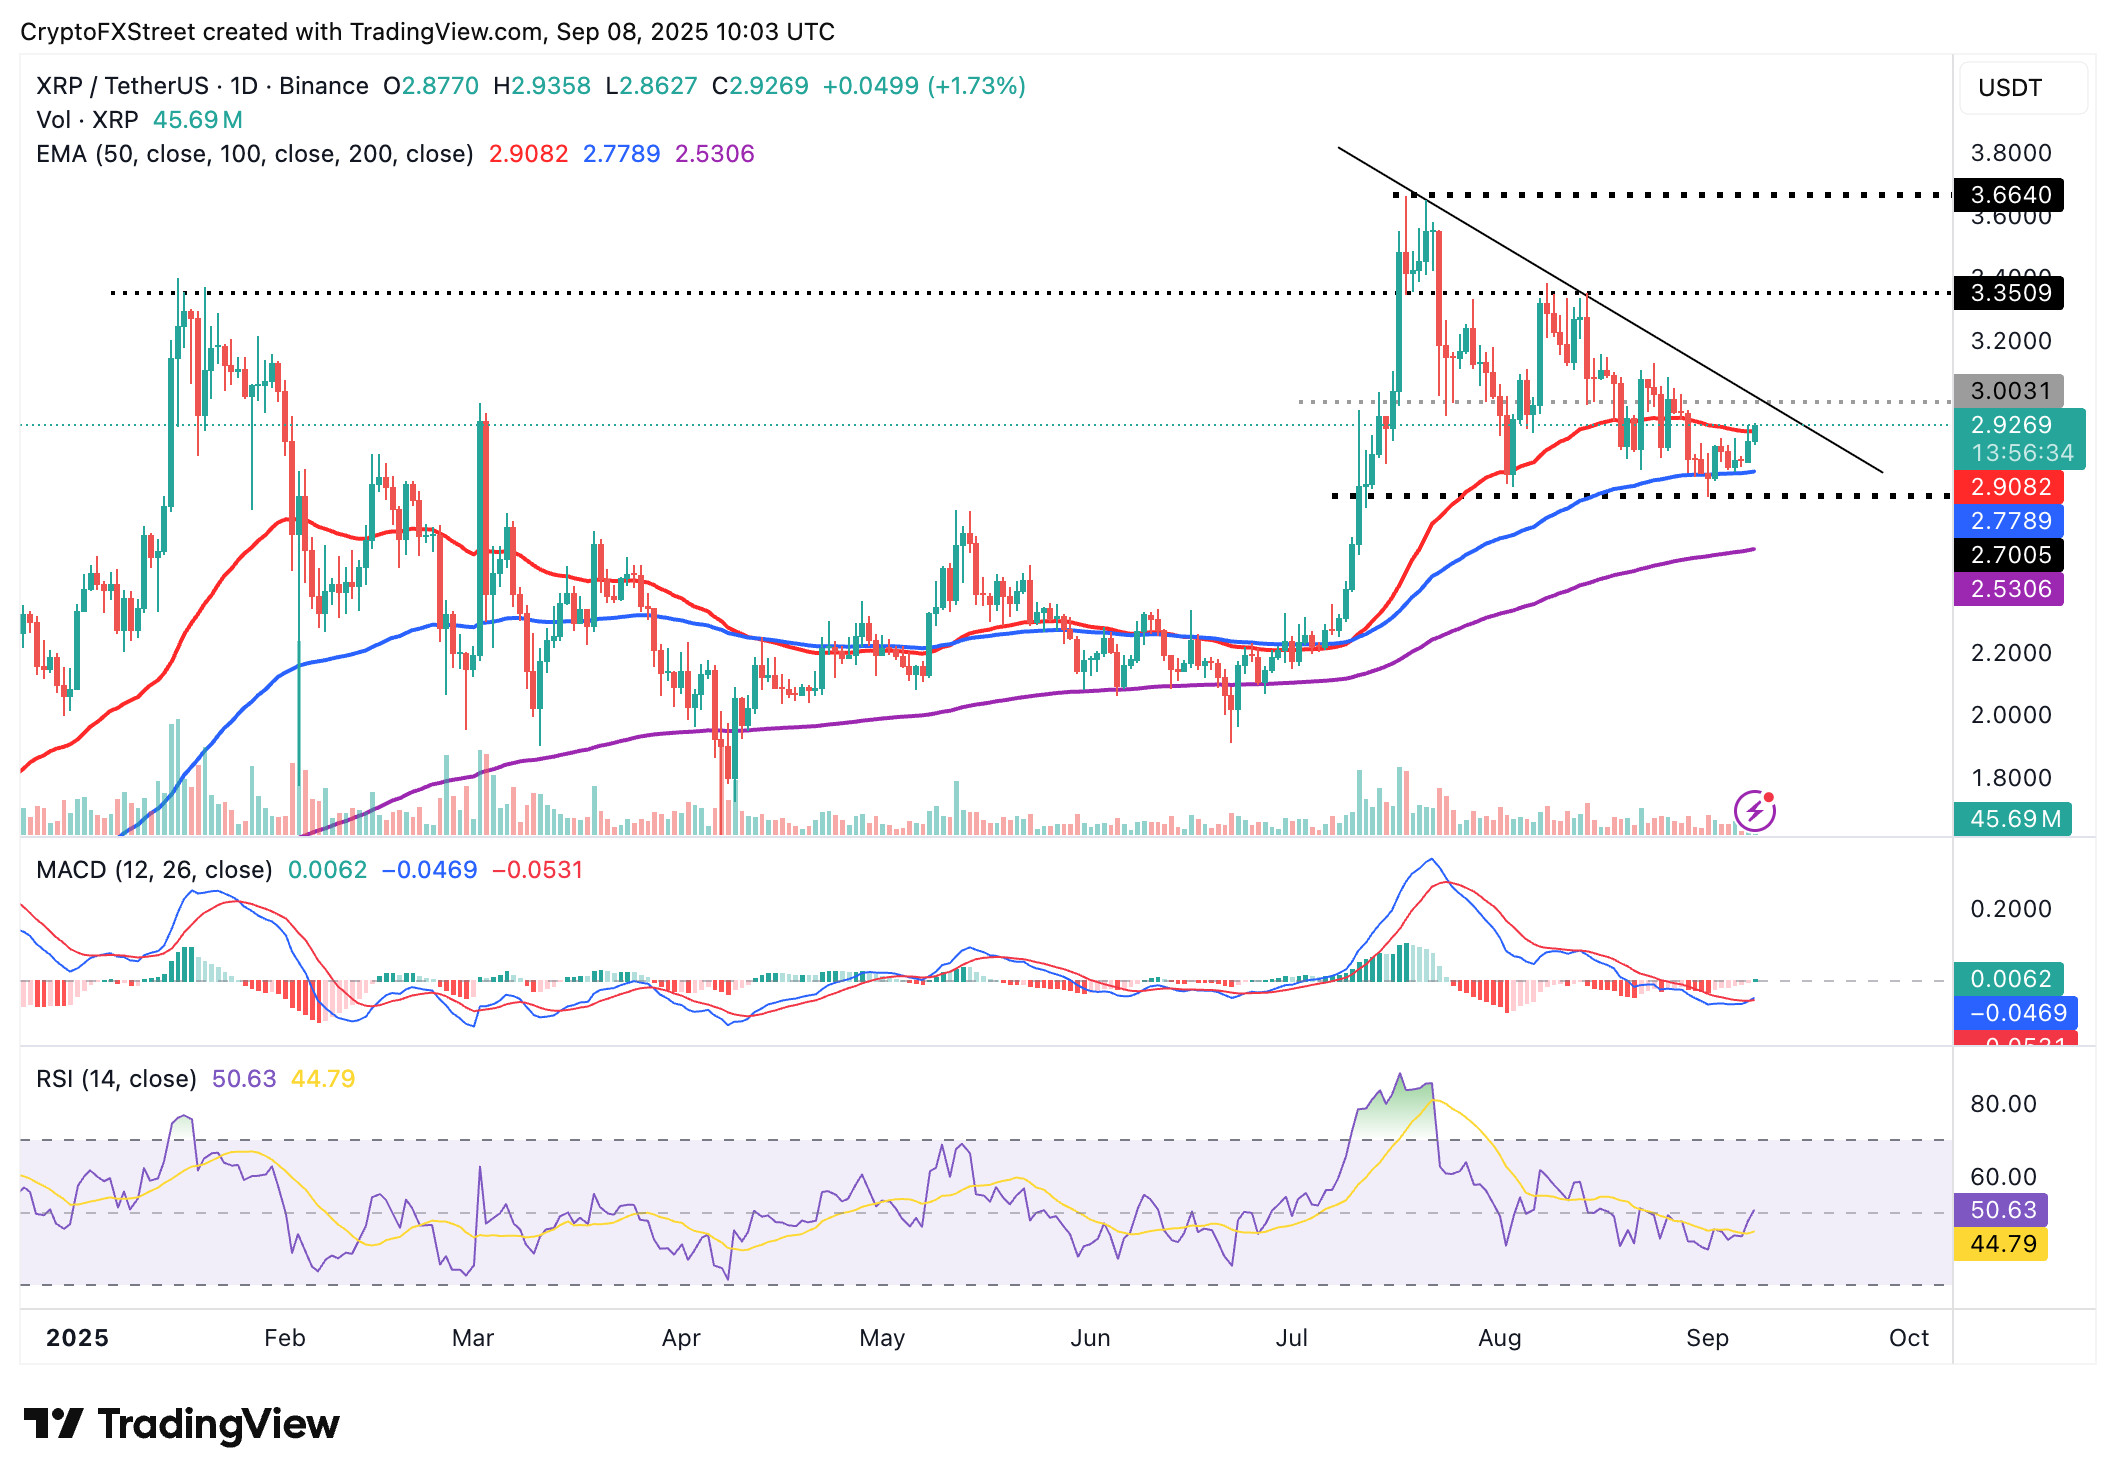
XRP/USDT daily chart
The path of least resistance remains upward, backed by a buy signal from the MACD indicator. As traders increase their exposure, the RSI rises, currently above the midline, reflecting growing demand for XRP.
Cryptocurrency prices FAQs
Token launches influence demand and adoption among market participants. Listings on crypto exchanges deepen the liquidity for an asset and add new participants to an asset’s network. This is typically bullish for a digital asset.
A hack is an event in which an attacker captures a large volume of the asset from a DeFi bridge or hot wallet of an exchange or any other crypto platform via exploits, bugs or other methods. The exploiter then transfers these tokens out of the exchange platforms to ultimately sell or swap the assets for other cryptocurrencies or stablecoins. Such events often involve an en masse panic triggering a sell-off in the affected assets.
Macroeconomic events like the US Federal Reserve’s decision on interest rates influence crypto assets mainly through the direct impact they have on the US Dollar. An increase in interest rate typically negatively influences Bitcoin and altcoin prices, and vice versa. If the US Dollar index declines, risk assets and associated leverage for trading gets cheaper, in turn driving crypto prices higher.
Halvings are typically considered bullish events as they slash the block reward in half for miners, constricting the supply of the asset. At consistent demand if the supply reduces, the asset’s price climbs.


