
Avalanche Price Forecast: AVAX rebounds as Dinari Global brings US tokenized stocks on-chain
- Avalanche rebounds to recover most of the losses incurred on Thursday as the market corrected.
- Dinari Global announces the launch of tokenized US stocks on a layer-1 omni-chain with Avalanche.
- The technical outlook remains mixed as AVAX faces a crucial overhead resistance.
Avalanche (AVAX) edges higher by nearly 7% at press time on Friday, nearly overcoming the loss from the previous day. The quick reversal is underpinned by the announcement of Dinari Financial Network launching US tokenized stocks on Avalanche, alongside improving network metrics such as TVL and Decentralized Exchange (DEX) volumes.
Still, the technical outlook highlights a crucial overhead resistance for AVAX to surpass in order to extend the recovery run.
Avalanche powers the new Dinari Layer-1 blockchain
Dinari Global, a US-based issuer of tokenized stocks and other securities, has announced the launch of its own proprietary Layer-1 blockchain utilizing the Avalanche tech stack. The blockchain, known as Dinari Financial Network, will serve as a payment settlement and coordination layer across multiple networks, including Arbitrum (ARB), Base, and Plume, with plans to incorporate Solana (SOL) later.
The deal opens a gateway for multiple firms to build their proprietary Layer-1 chains, which could further boost the adoption of Avalanche.
Furthermore, Avalanche announced the arrival of AAA-rated Collateralized Loan Obligations (CLOs) worth over $21 billion from Grove.finance to its Decentralized Finance (DeFi) ecosystem. The deal also includes over $250 million in Real World Assets (RWAs).
Avalanche eyes major resistance breakout
Avalanche price remains above the 200-day Exponential Moving Average (EMA) at $23.39. The intraday recovery is inching towards the 38.2% Fibonacci level, acting as overhead resistance at $25.50, which is stretched between the $53.98 high from December 8 and the $16.04 low from April 6.
A decisive push above this resistance is crucial to prolong the recovery run, potentially targeting the 50% retracement level at $29.43.
The 50-day EMA is rising toward the 200-day EMA, eyeing a Golden Cross, which would flash a buy signal as short-term recovery outpaces the longer-term trend.
Still, the momentum indicators remain mixed as short-term volatility persists. On the daily chart, the Relative Strength Index (RSI) is at 57, up from 52 on Thursday, indicating increased buying pressure and suggesting further potential for recovery.
Additionally, the Moving Average Convergence Divergence (MACD) maintains an uptrend with its signal line, but lacks swiftness, suggesting low bullish momentum.
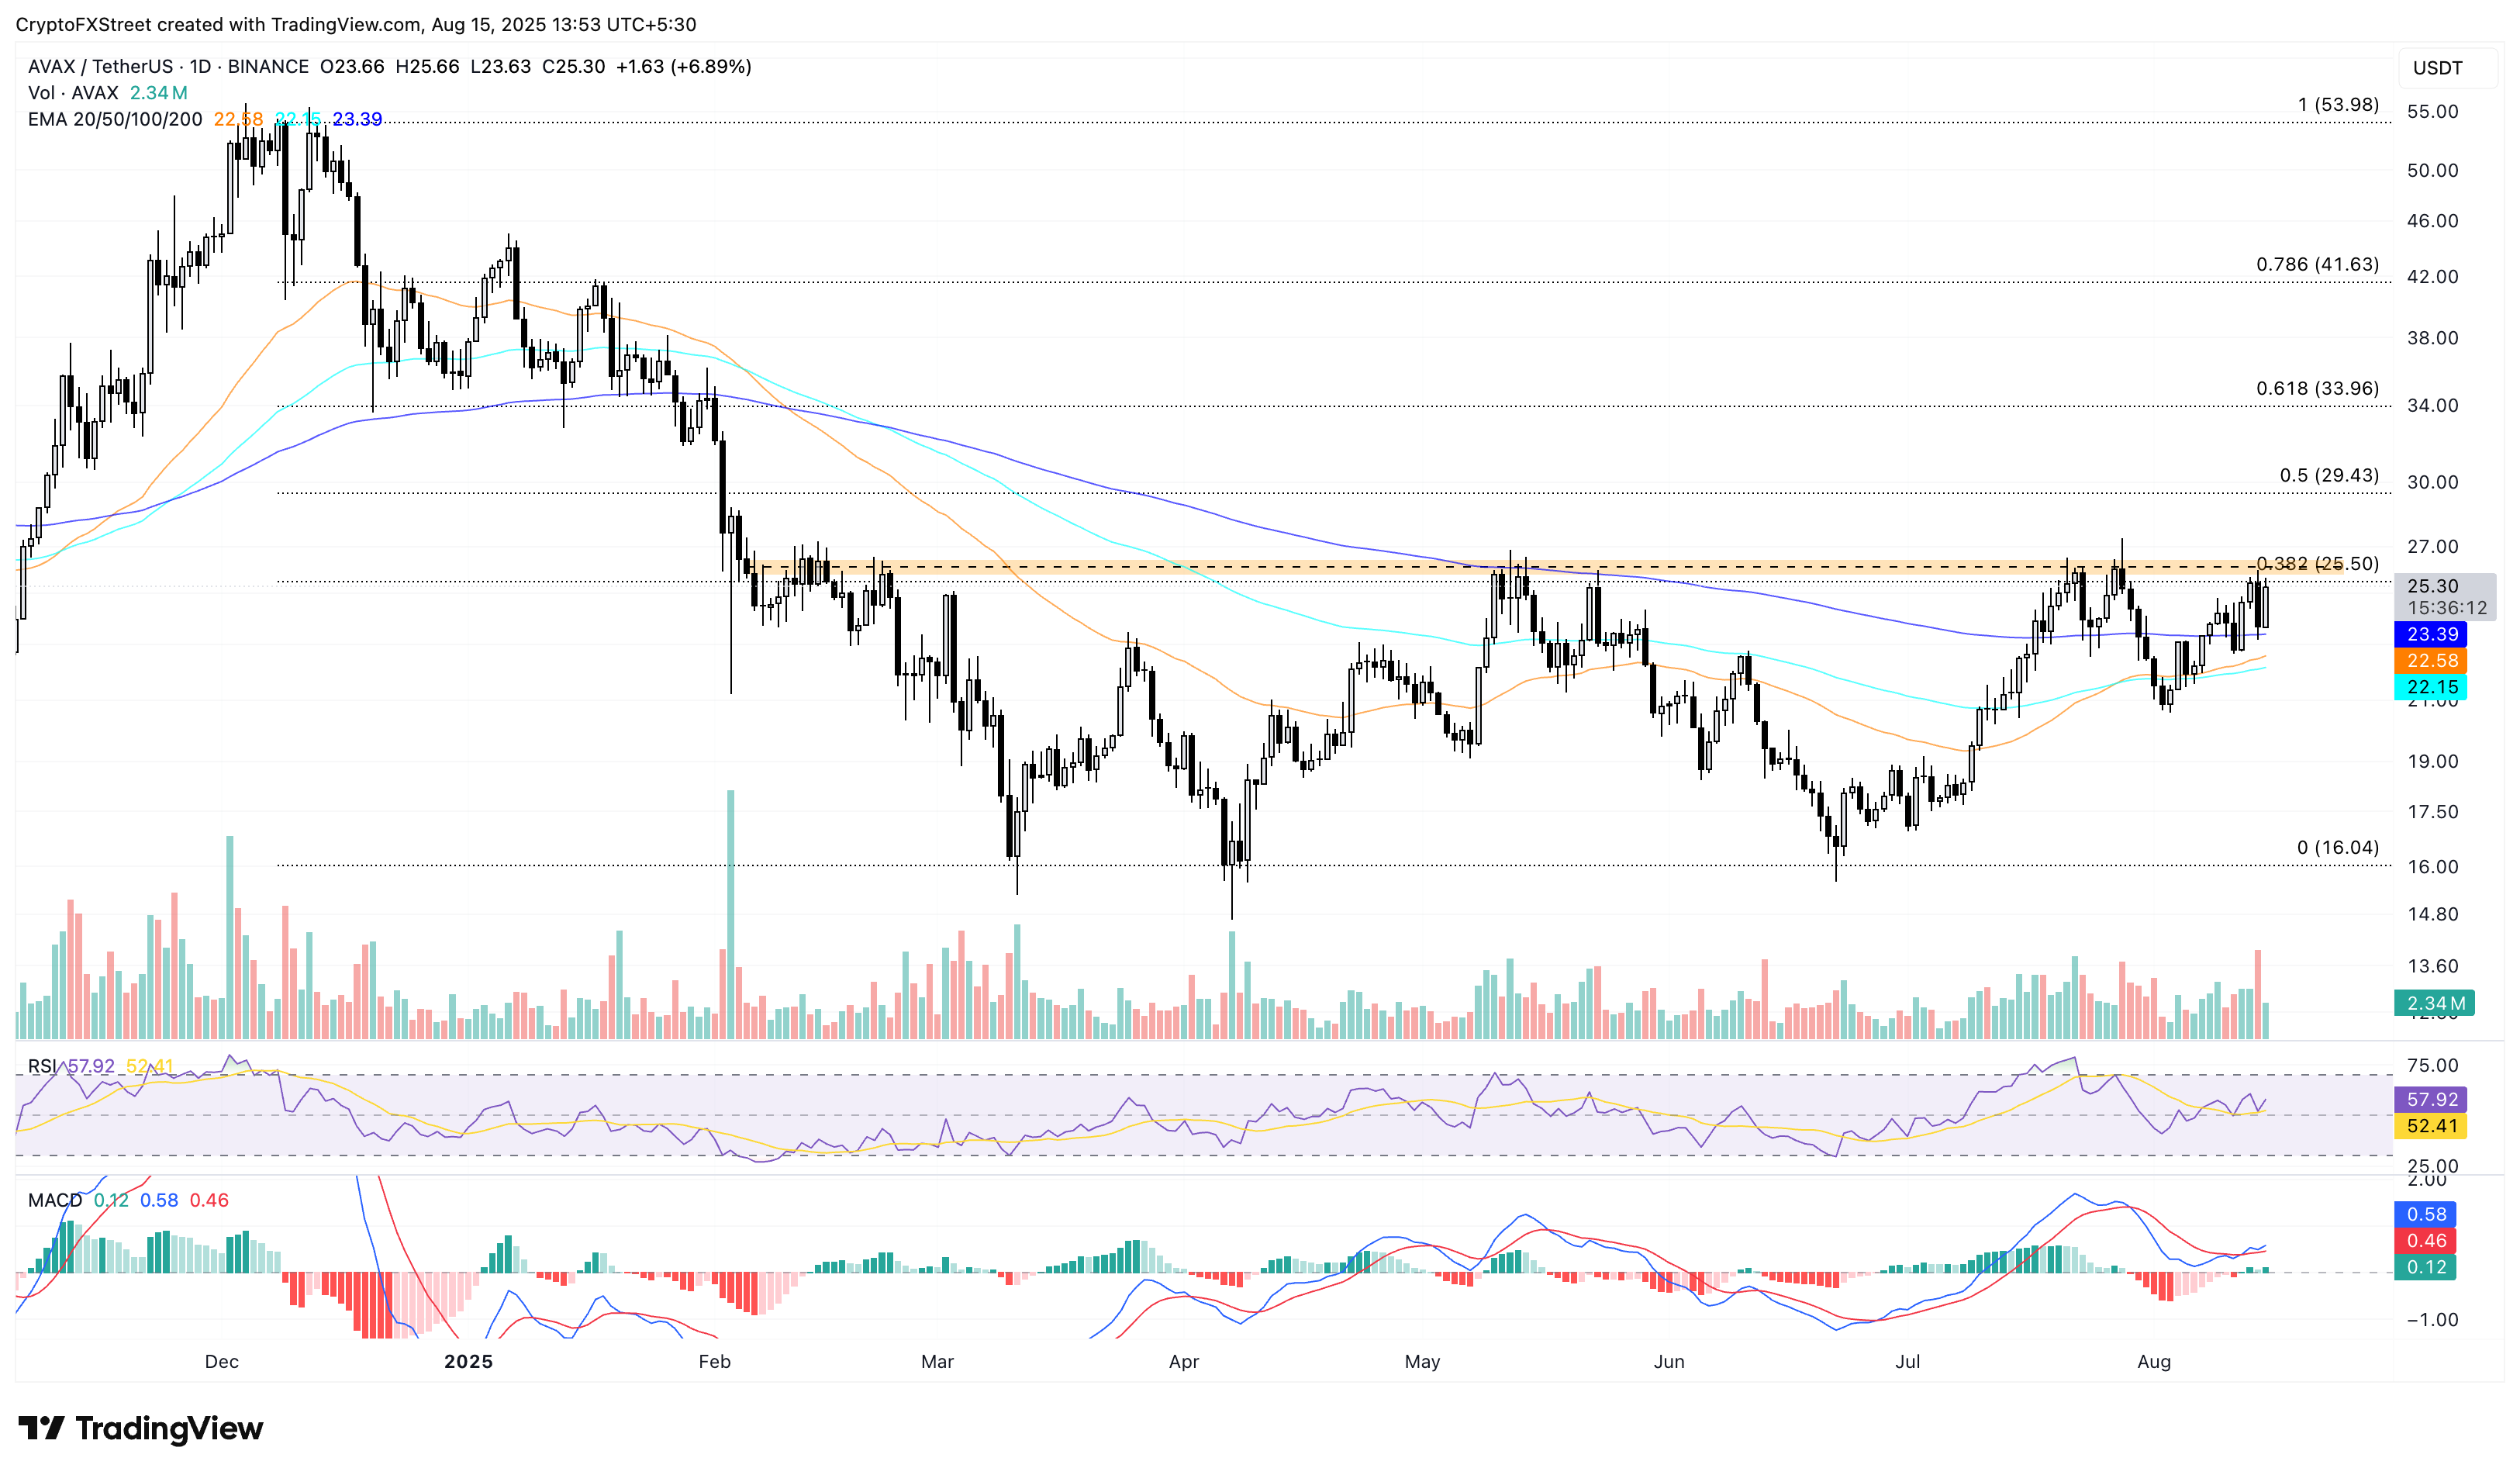
AVAX/USDT daily price chart.
Looking down, if AVAX drops below the 200-day EMA at $23.39, it could extend the decline to the 50-day EMA at $22.58.
Bài viết đề xuất


