
Solana Price Forecast: Sol steadies near $168 as Seeker mobile device shipments begin
- Solana price hovers around $168 on Tuesday after recovering nearly 7% in the last two days.
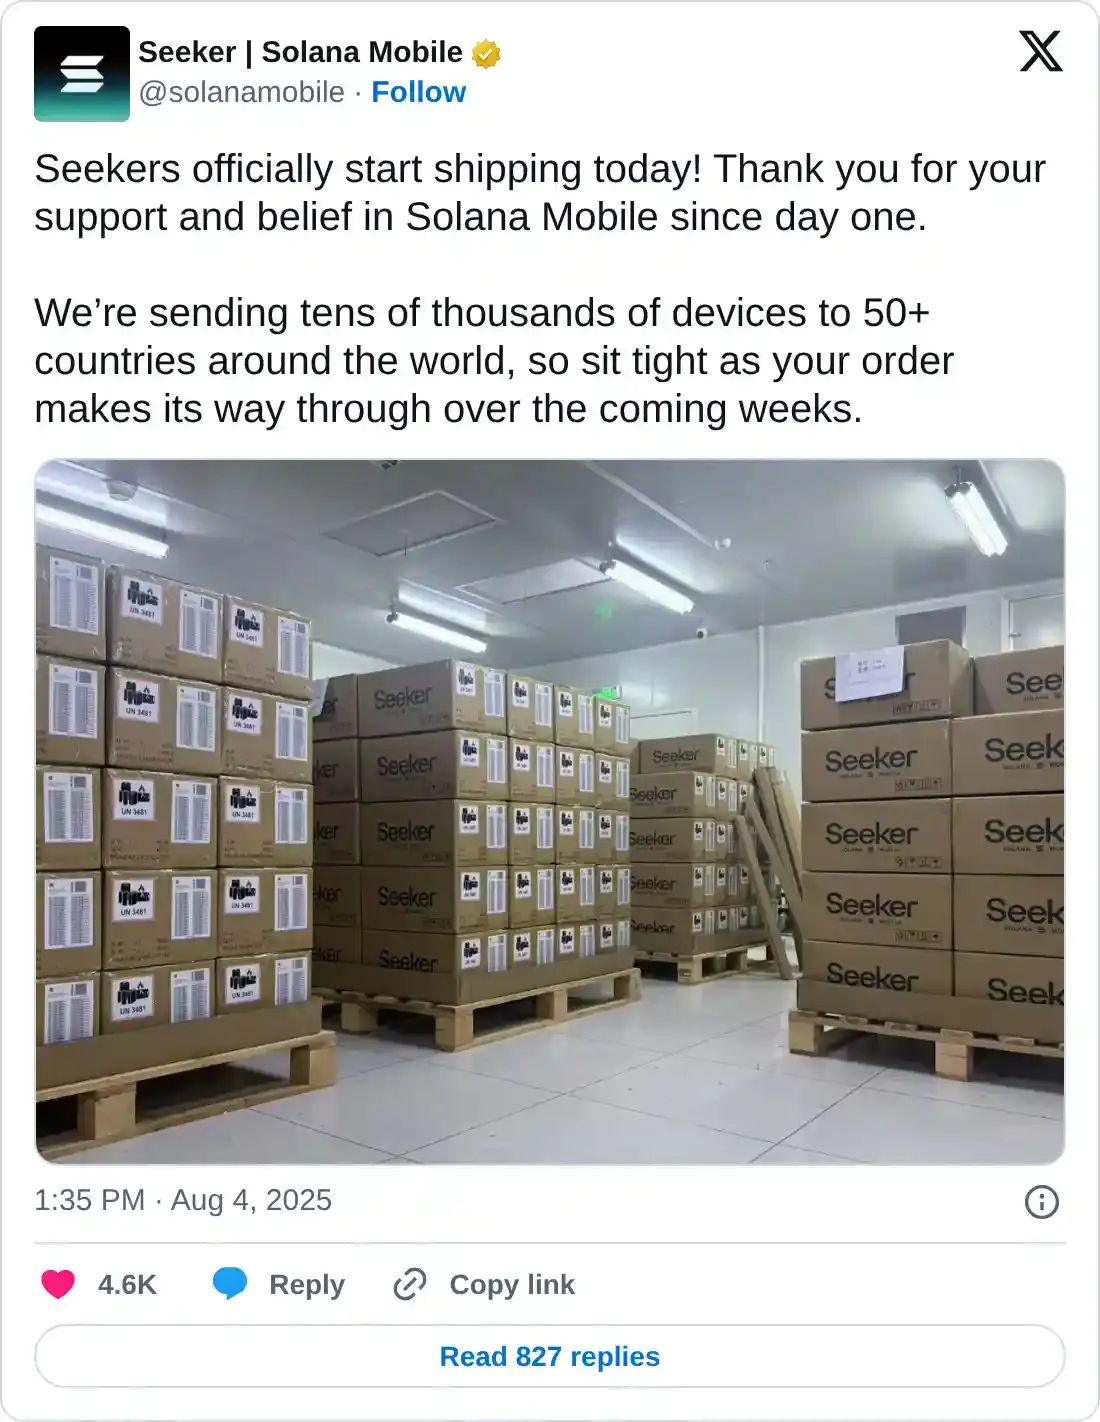
- Solana started shipping its Seeker mobile device on Monday, supplying users in over 50 countries.
- Derivatives data points to growing optimism, with funding rates turning positive, signaling the shift of traders' sentiment from bearish to bullish.
Solana (SOL) price hovers around $168 at the time of writing on Tuesday after recovering nearly 7% in the past two days. This recovery is further supported by the news on Monday that Solana has started shipping its Seeker mobile device to more than 50 countries, a move that could further expand its ecosystem reach. Derivatives data shows that SOL’s funding rates have flipped positive, and improving trader sentiment, adding to the growing optimism for SOL’s near-term outlook.
Seeker mobile device shipments begin
Solana’s Seekers mobile announced on Monday that the shipping of the devices has begun and is supplying users in over 50 countries, a move that could further expand its ecosystem reach.
“We’re sending tens of thousands of devices to 50+ countries around the world, so sit tight as your order makes its way through over the coming weeks,” said Seeker on its X post.
The Seeker phone, which has amassed over 150,000 pre-orders, will feature upgraded technology, a mobile-native crypto wallet and a decentralized application store.
Traders' sentiment shifts from bearish to bullish
Solana’s derivatives data shows a bullish bias. CoinGlass’s OI-Weighted Funding Rate data shows that the number of traders betting that the price of Solana will slide further is lower than the number anticipating a price increase.
The metric has flipped to a positive rate on Tuesday and reads 0.0006%, indicating that longs are paying shorts. Historically, as shown in the chart below, when the funding rates have flipped from negative to positive, the Solana price has rallied sharply.
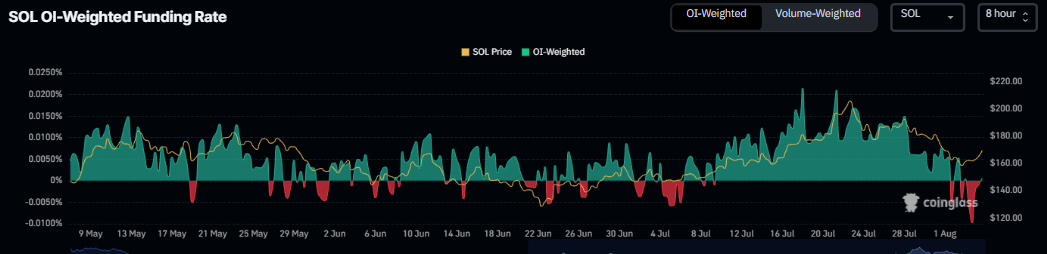
Solana’s funding rate chart. Source: Coinglass
Solana Price Forecast: SOL recovers after a sharp fall
Solana price closed below its daily level of $184.13 last week on Monday and declined 13.44% in the next five days. Support was found around its 200-day Exponential Moving Average (EMA) at $162.75 on Sunday. This 200-day EMA roughly coincides with the 61.8% Fibonacci retracement level at $163.40, making this a key support zone. At the start of this week on Monday, SOL recovered 4.68% and at the time of writing on Tuesday, it hovers around $168.67.
If the 200-day EMA at $162.75 continues to hold as support, SOL could extend the rally toward its daily resistance level at $184.13.
The Relative Strength Index (RSI) on the daily chart reads 47 and points upward toward its neutral level of 50, indicating fading bullish momentum. For the recovery rally, the RSI must move above its neutral level.
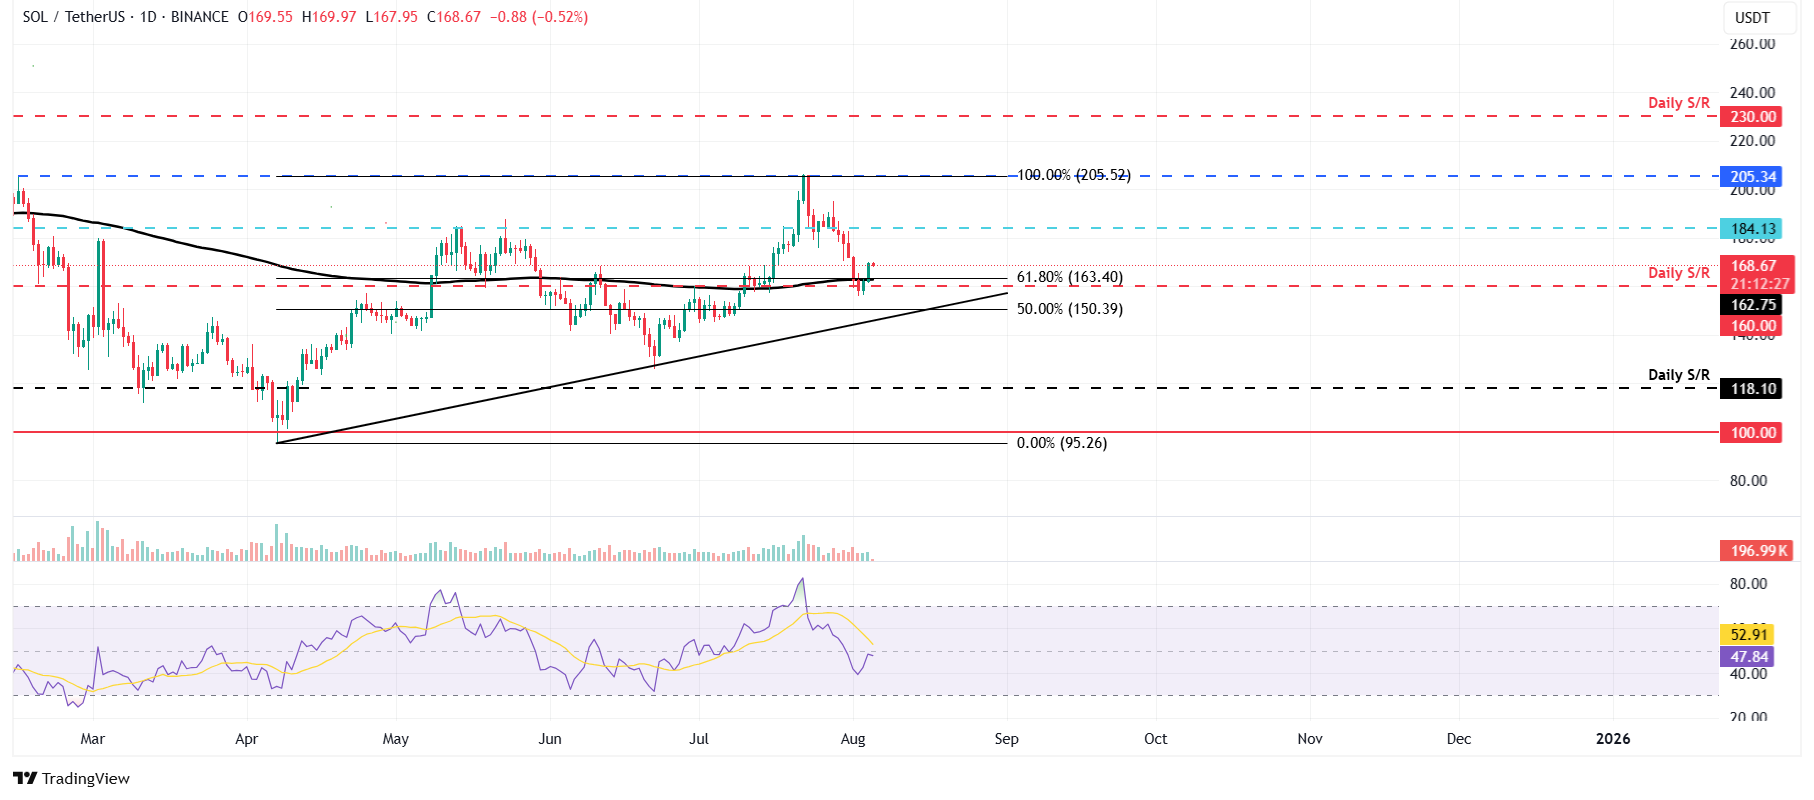
SOL/USDT daily chart
However, if SOL faces a correction, it could extend the decline towards its 50% price retracement level at $150.39.
Bài viết đề xuất


