
Sui Price Forecast: SUI bulls aim for 15% gains as open interest and bullish bets increase among traders
- Sui’s price extends gains by nearly10% on Thursday, approaching a key resistance level at $3.65; a decisive close would signal further gains ahead.
- On-chain data hints at a bullish outlook as SUI’s Open Interest and bullish bets among traders are rising.
- Adidas’s recent collaboration with XOCIETY, a flagship Web3 game on Sui’s blockchain, enhances its adoption, ecosystem growth, and token utility.
Sui (SUI) price extends recent gains, soaring10% higher at the time of writing on Thursday and approaching its key resistance level at $3.65. Sui’s on-chain metrics support this price rally, as its Open Interest (OI) reaches a new all-time high of $1.62 billion, while its bullish bets among traders are also rising. Moreover, Adidas’s recent collaboration with XOCIETY, a flagship Web3 game on Sui’s blockchain, enhances its adoption, ecosystem growth, and token utility, further supporting the bullish thesis.
Sui’s Open Interest reaches a new all-time high
Coinglass’ data shows that the futures’ OI in SUI at exchanges rose from $1.39 million on Monday to $1.62 billion on Thursday, a new all-time high. An increasing OI represents new or additional money entering the market and new buying, which could fuel the current rally in the Sui’s price.
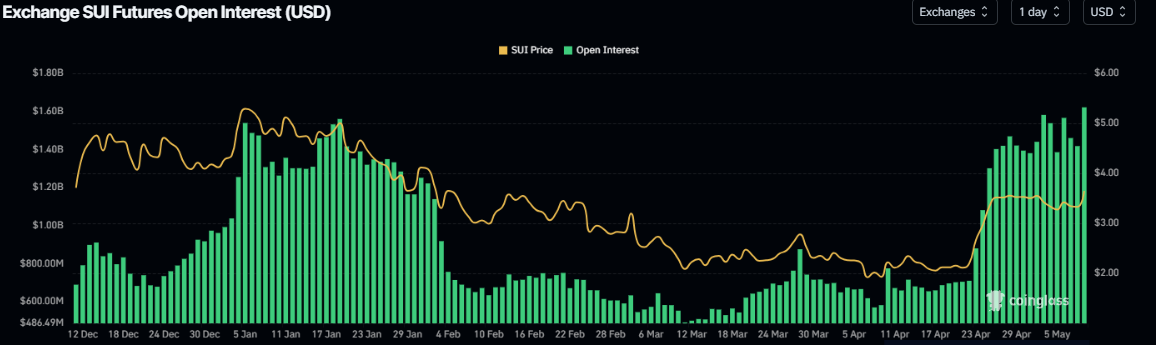
Sui Open Interest chart. Source: Coinglass
Another bullish sign is Coinglass’s SUI long-to-short ratio, which reads 1.09, the highest level in over a month. This ratio above one reflects bullish sentiment in the markets as more traders are betting on the asset price to rise.
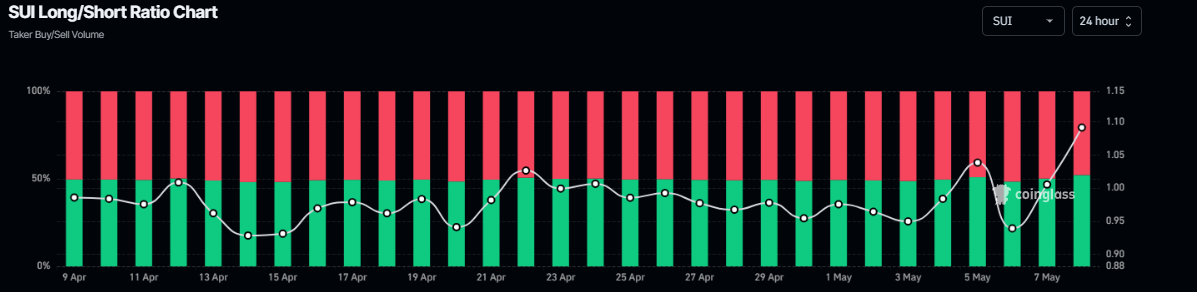
SUI long-to-short ratio chart. Source: Coinglass
Earlier on Tuesday, Sui highlighted on its official X post a collaboration between Adidas and XOCIETY, a flagship Web3 game on Sui’s blockchain, integrating exclusive Adidas digital apparel as NFTs, which aligns with Adidas’ ongoing Web3 efforts. This collaboration is a positive signal for Sui Network, enhancing its adoption, ecosystem growth, and token utility.
Sui Price Forecast: SUI bulls aim for over 15% gains
Sui’s price has been rejected around its daily level of $3.65 since last week, consolidating within a tight range until Wednesday. At the time of writing on Thursday, SUI trades higher by nearly 10%, approaching its daily resistance level at $3.65.
If SUI breaks and closes above $3.65 on a daily basis, it could extend the rally by over 15% from its current levels to retest the January 31 high of $4.25.
The Relative Strength Index (RSI) on the daily chart moves above 70, indicating strong bullish momentum. However, traders should be cautious as the chances of a pullback are high due to the overbought condition. Another possibility is that the RSI remains above the overbought level of 70 and continues its upward trend.
The Moving Average Convergence Divergence (MACD) indicator is about to flip a bullish crossover. If it does, it would give a buying signal and indicate an upward trend.
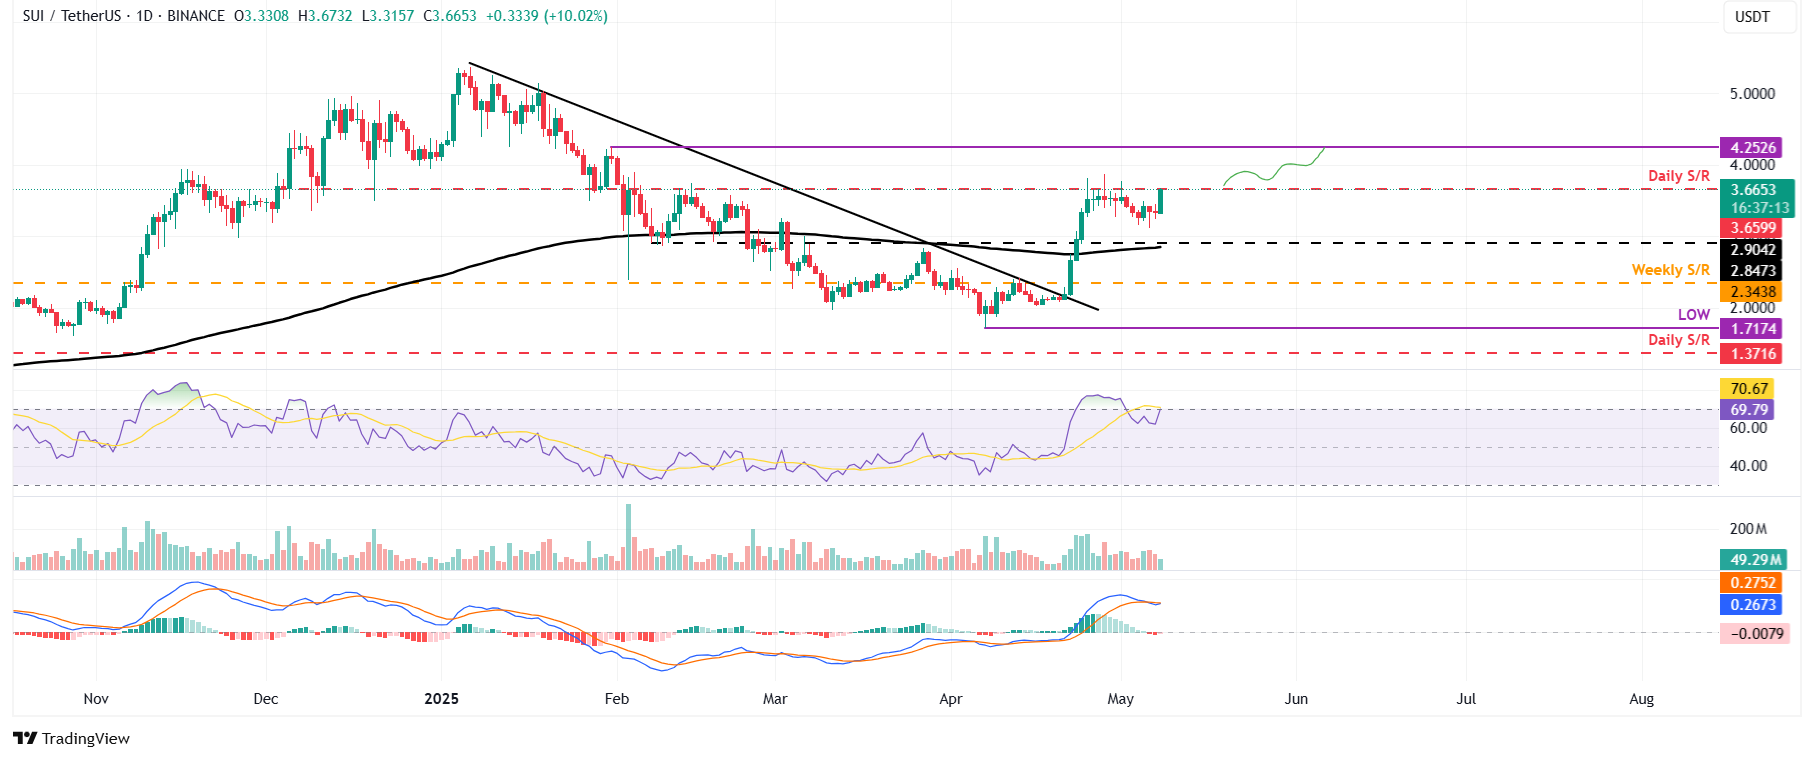
SUI/USDT daily chart
However, if SUI faces a correction, it could extend the decline to retest Tuesday’s low of $3.12.
Bài viết đề xuất


