
Bitcoin Price Forecast: BTC steadies around $101,000 as easing US-China tensions offer market relief
- Bitcoin price hovers around $101,000 on Wednesday, finding support near a crucial level following a sharp correction.
- China to lift some tariffs on US farm products while Trump cuts fentanyl levies on Chinese goods, improving market sentiment.
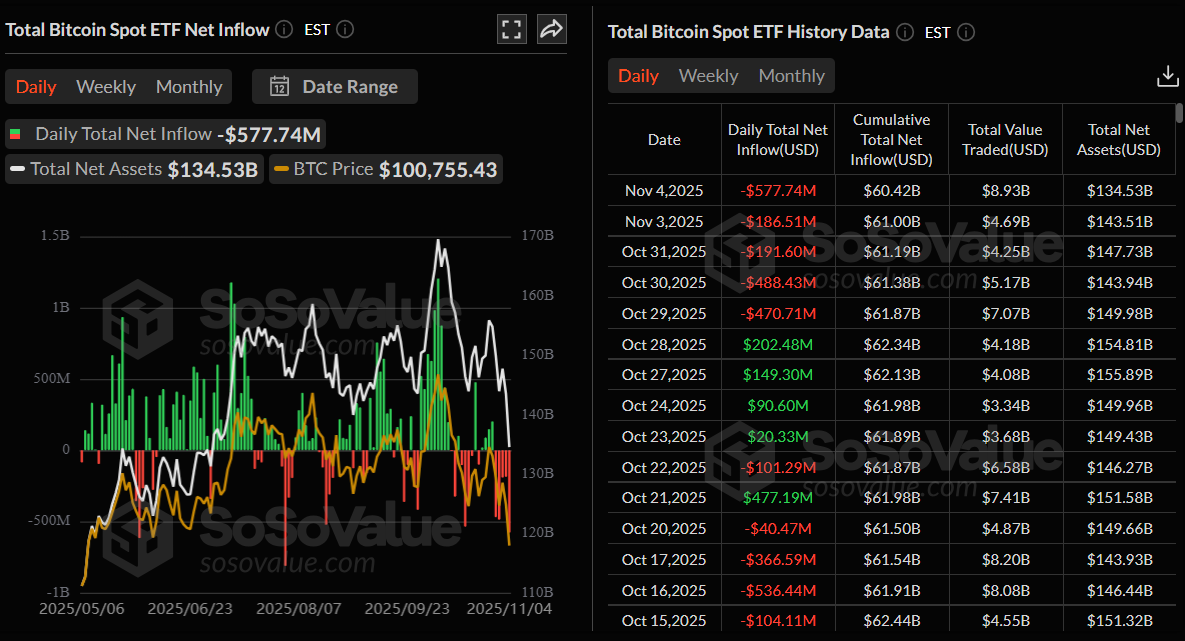
- US-listed spot ETF recorded an outflow of $577.74 million on Tuesday, the highest single-day levels since early August.
Bitcoin (BTC) price holds near $101,000 at the time of writing on Wednesday, finding support near a crucial level amid easing US-China trade tensions. China’s decision to lift some tariffs on US agricultural products and US President Donald Trump’s move to cut levies on fentanyl-related imports helped calm global markets. Despite improved macro sentiment, US-listed spot Bitcoin Exchange Traded Funds (ETFs) record outflows of over $577 million on Tuesday, hinting at fading institutional demand for the largest cryptocurrency by market capitalization.
US-China easing trade tension could support BTC recovery
Bitcoin price steadies around $101,000 during the European trading session on Wednesday, after correcting by more than 8% earlier this week. This mild price resilience comes amid improving macro conditions, as the Chinese Finance Ministry announced on Wednesday that China will lift some tariffs on US agricultural goods starting November 10.
Additionally, China will suspend 24% of US tariffs for a year while maintaining a 10% levy on other goods. Following a meeting with a US agriculture delegation, China’s top trade negotiator, Li Chenggang, urged the United States to create favorable conditions for deeper cooperation.
These developments follow Tuesday’s announcement by US President Donald Trump to cut fentanyl-related tariffs on imports from China, lowering the rate from 20% to 10%, and the continued freeze of some of his reciprocal levies on Chinese goods. The moves, set to take effect on November 10, stem from agreements reached during the October summit in South Korea aimed at de-escalating trade tensions between the world’s two largest economies.
These easing trade conditions have improved global market sentiment, which could support the near-term price recovery of Bitcoin and other risk assets.
Bitcoin spot ETFs record highest single-day outflow since August
Institutional demand for Bitcoin has continued to weaken so far this week. SoSoValue data shows that spot Bitcoin ETFs recorded an outflow of $577.74 million on Tuesday, continuing its daily streak of outflows since October 29. This outflow recorded was the highest single-day outflow since early August. If these outflows continue and intensify, BTC could extend its ongoing price correction, suggesting declining institutional confidence.
Bitcoin’s steady and orderly sell-off
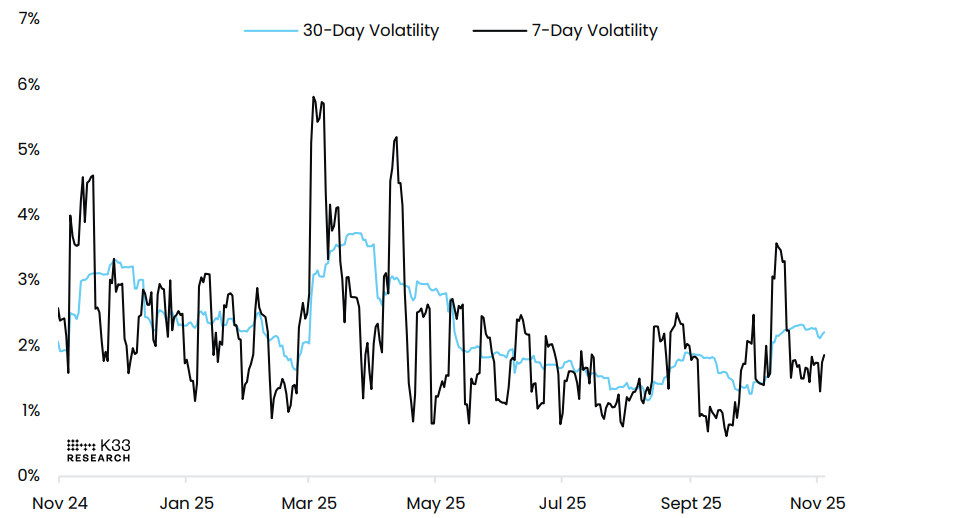
A K33 Research report on Tuesday stated that Bitcoin’s recent price correction has occurred in a steady, orderly manner, without a substantial spike in short-term volatility.
The BTC’s 7-day volatility chart below currently stands at 1.9%, in line with last week’s 1.8%, indicating that the drop hasn’t been chaotic — the market is relatively calm despite the losses.
Meanwhile, the analyst further explained that the Fear and Greed Index, which measures investor sentiment, has dropped to 21, its lowest level since April 8. Between February 26 and April 8, the index experienced multiple instances of lower readings than the current one, amid BTC’s then-poor momentum. Nonetheless, the push into extreme fear represents yet another indicator of the current stressed sentiment in the market.
Bitcoin Price Forecast: BTC finds support around a key level
Bitcoin price faced rejection around its previously broken trendline on Monday and declined 8.18% until the next day, retesting the 50% retracement level at $100,353. At the time of writing on Wednesday, BTC is finding support around $100,353 and trading slightly above $101,000.
If the 50% retracement level at $100,353 continues to hold as support, BTC could extend its recovery toward the next key resistance level at $106,435.
The Relative Strength Index (RSI) is 32, hovering near oversold territory, suggesting that selling momentum may be easing and that a potential short-term rebound could be on the horizon.
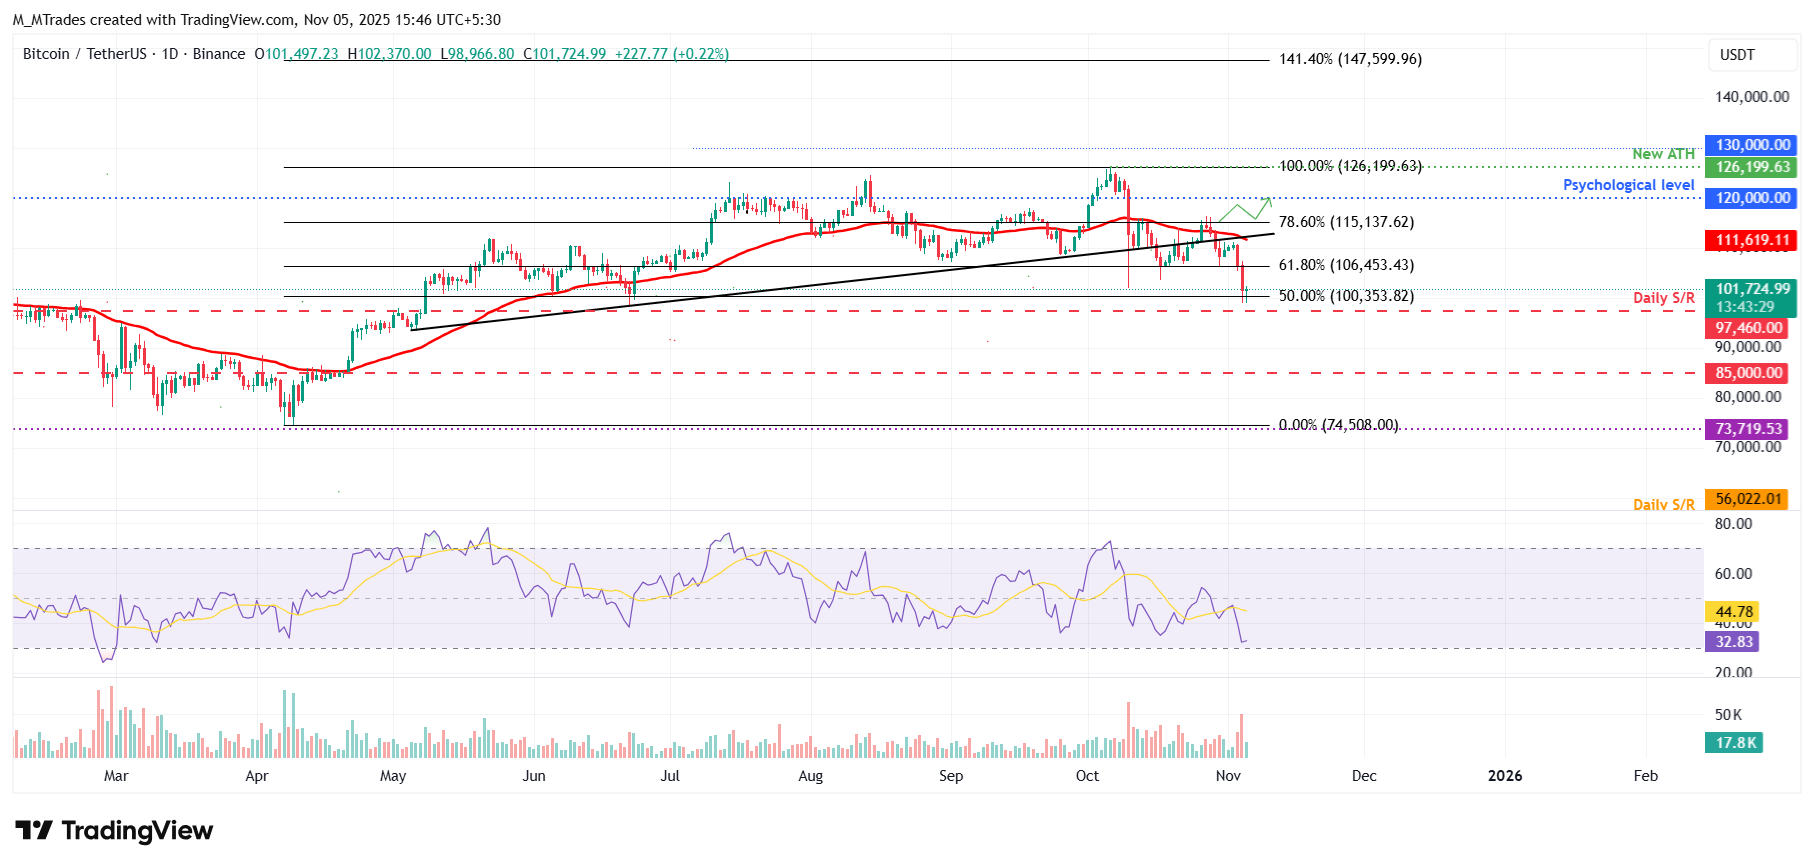
On the other hand, if BTC closes below the $100,353 support level, it could extend the decline toward the next daily support at $97,460.
Bitcoin, altcoins, stablecoins FAQs
Bitcoin is the largest cryptocurrency by market capitalization, a virtual currency designed to serve as money. This form of payment cannot be controlled by any one person, group, or entity, which eliminates the need for third-party participation during financial transactions.
Altcoins are any cryptocurrency apart from Bitcoin, but some also regard Ethereum as a non-altcoin because it is from these two cryptocurrencies that forking happens. If this is true, then Litecoin is the first altcoin, forked from the Bitcoin protocol and, therefore, an “improved” version of it.
Stablecoins are cryptocurrencies designed to have a stable price, with their value backed by a reserve of the asset it represents. To achieve this, the value of any one stablecoin is pegged to a commodity or financial instrument, such as the US Dollar (USD), with its supply regulated by an algorithm or demand. The main goal of stablecoins is to provide an on/off-ramp for investors willing to trade and invest in cryptocurrencies. Stablecoins also allow investors to store value since cryptocurrencies, in general, are subject to volatility.
Bitcoin dominance is the ratio of Bitcoin's market capitalization to the total market capitalization of all cryptocurrencies combined. It provides a clear picture of Bitcoin’s interest among investors. A high BTC dominance typically happens before and during a bull run, in which investors resort to investing in relatively stable and high market capitalization cryptocurrency like Bitcoin. A drop in BTC dominance usually means that investors are moving their capital and/or profits to altcoins in a quest for higher returns, which usually triggers an explosion of altcoin rallies.
Bài viết đề xuất


