
Crypto Today: Bitcoin, Ethereum, XRP stabilize after sell-off as China suspends retaliatory tariffs on US goods
- Bitcoin reclaims $100,000 after a gruesome two-day sell-off as China suspends 24% retaliatory tariff on some US imports.
- Ethereum pares losses amid risk-off sentiment, as evidenced by ETF outflows.
- XRP holds $2.00 support, but recovery could still be a pipe dream in the short term.
Bitcoin (BTC) is holding above $100,000 at the time of writing on Wednesday, following a knee-jerk bounce after two consecutive days of declines. BTC corrected below $99,000 on Tuesday as risk-off sentiment continued to spread across the cryptocurrency market.
Recovery has become elusive, especially as investors remain on the sidelines due to macroeconomic uncertainty and a lack of significant price catalysts.
Altcoins, including Ethereum (ETH) and Ripple (XRP), have deepened losses this week, following Bitcoin's lead. ETH holds above $3,300, while XRP trades around $2.23.
BTC, ETH, XRP bounce back as China suspends retaliatory tariffs on US goods
China has moved to suspend tariffs that it had imposed on a range of United States (US) agricultural goods. According to Bloomberg, the move follows the decision by the US to reduce its fentanyl-related levies on Chinese imports.
In a notice issued on Wednesday, China's Ministry of Finance stated that it will remove tariffs on soybeans and other US agricultural products, including wheat, corn, and chicken, from November 11.
China's decision follows US President Donald Trump's signing of two executive orders to formalize the reduction of fentanyl-related tariffs. China brought down the reciprocal US tariff rate to 10% from 34%.
The tariff developments are building on a broader agreement struck between US President Trump and China's President Xi Jinping in South Korea last week, which is expected to last one year and is subject to renewal.
The crypto market is responding positively to the news, with Bitcoin stabilizing above $100,000 on Wednesday. A daily close above the $102,000 resistance could reinforce the bullish grip in the short term.
Chart of the day: Can Bitcoin sustain recovery?
Bitcoin is approaching the support-turned resistance at $102,000 at the time of writing on Wednesday, bolstered by positive sentiment following China's decision to suspend a 24% tariff on some US agricultural products.
The Relative Strength Index (RSI) on the daily chart, bouncing to 33 from near oversold conditions, is signaling stability ahead of a potential reversal as bearish momentum decreases. Higher RSI readings would encourage investors to increase their risk exposure, anticipating a steady price increase.
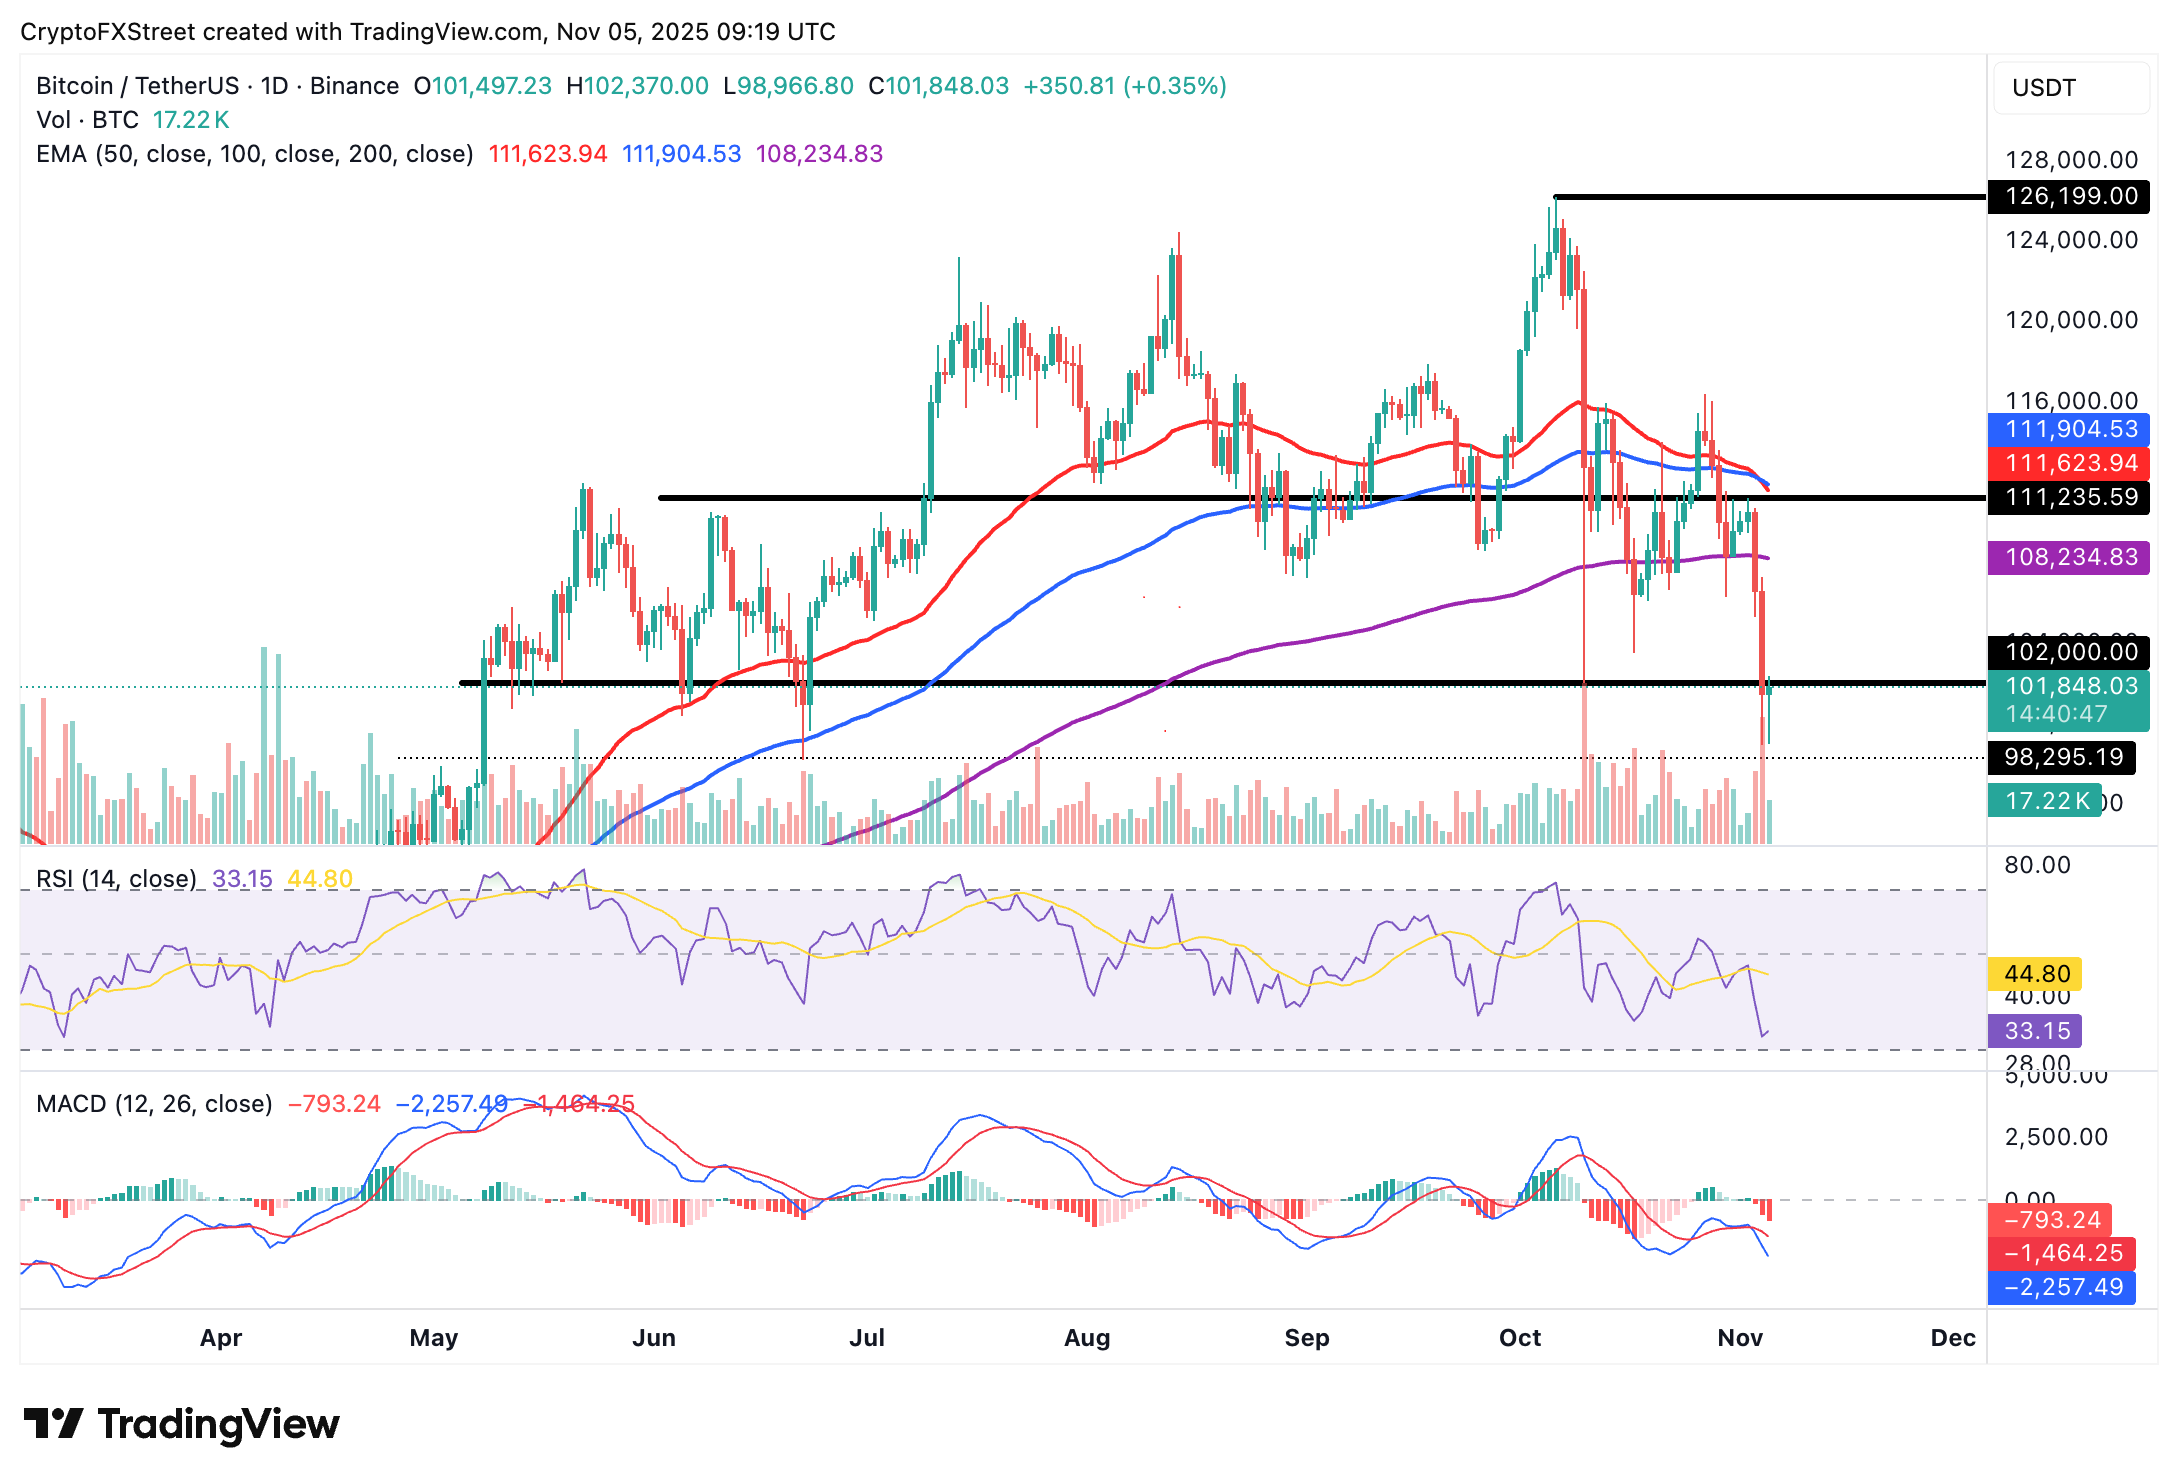
BTC/USDT daily chart
Still, traders should temper their bullish expectations, citing a sell signal from the Moving Average Convergence Divergence (MACD) indicator, which has been in place since Monday. This signal manifests when the blue line crosses below the red signal line, highlighting risk-off sentiment and encouraging investors to reduce their risk exposure. Another drop below the $100,000 critical level could drive Bitcoin to the next level at $98,295, last tested in June.
Altcoins update: Ethereum, XRP trade near key support
Ethereum is trading slightly above $3,300 at the time of writing on Wednesday, after bears deepened the correction on Monday, testing support at $3,060. The RSI at 29 on the daily chart signals oversold conditions, with a potential stability likely to be followed by a knee-jerk upswing toward the next resistance highlighted by the 200-day Exponential Moving Average (EMA) at $3,601
Conversely, the MACD indicator has maintained a sell signal since Monday, suggesting the technical structure remains bearish. If investors keep deleveraging and reducing their risk exposure, the downfall could resume, targeting lows below $3,000.
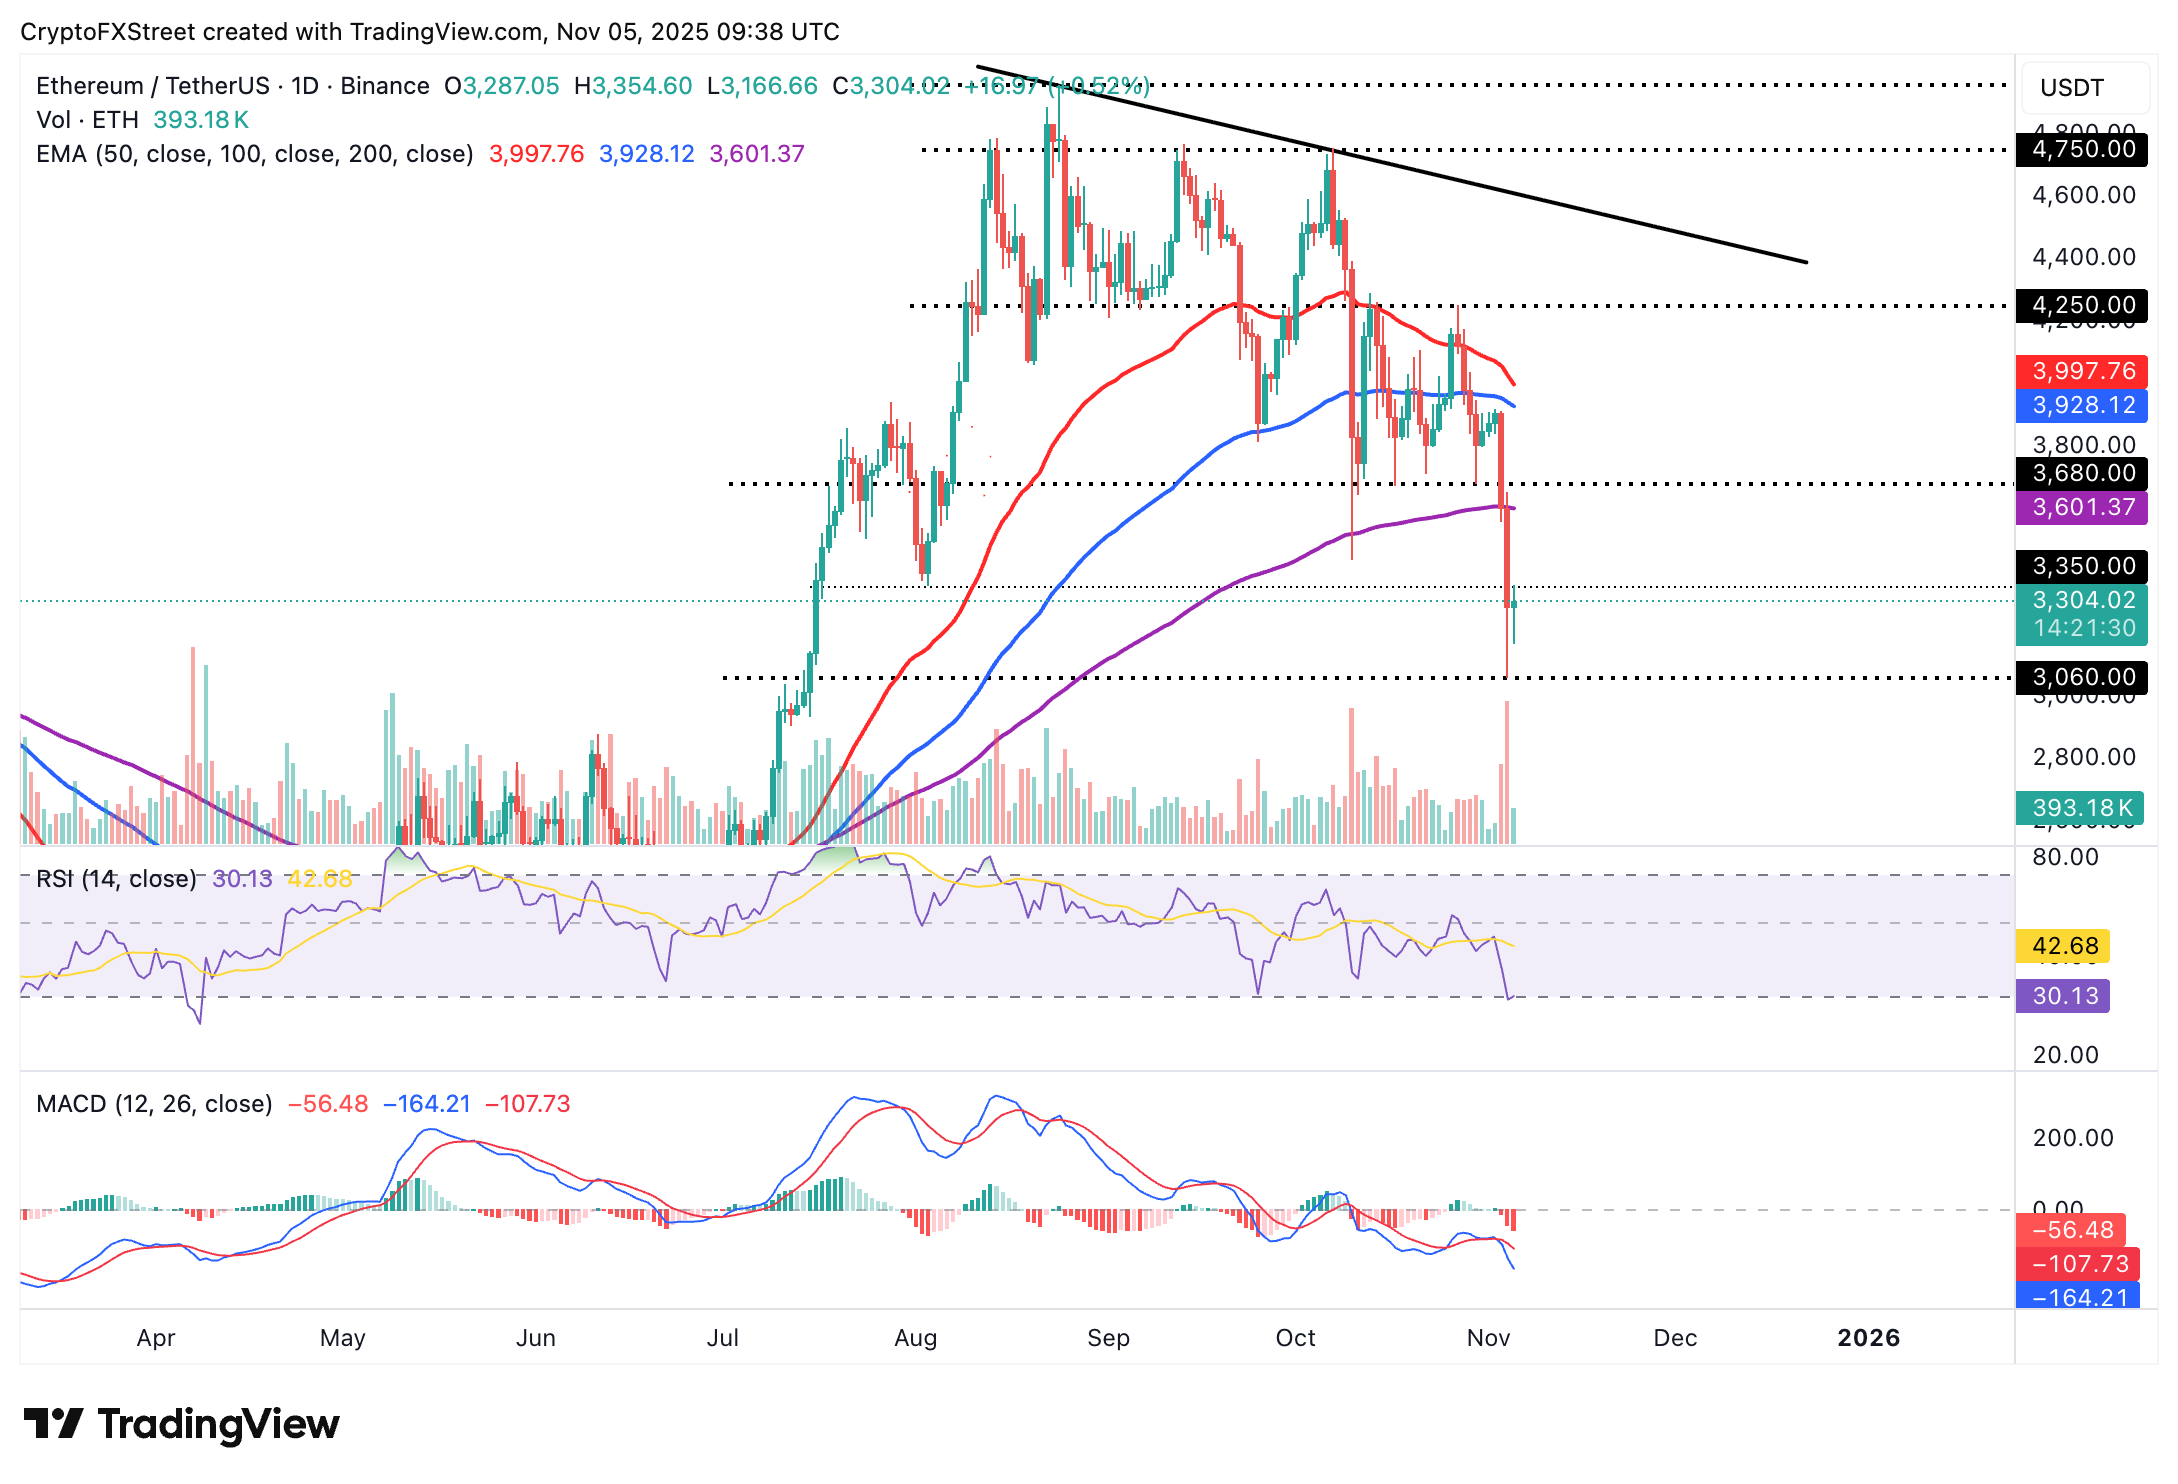
ETH/USD daily chart
Institutional investors' interest in Ethereum-related financial products, such as spot Exchange Traded Funds (ETFs), continues on a seemingly unrecoverable bearish streak. According to SoSoValue data, US-listed ETH ETFs experienced approximately $219 million in outflows on Tuesday. This marked five consecutive days of outflows, bringing the total inflow volume to $14.01 billion and net assets to $21.12 billion.
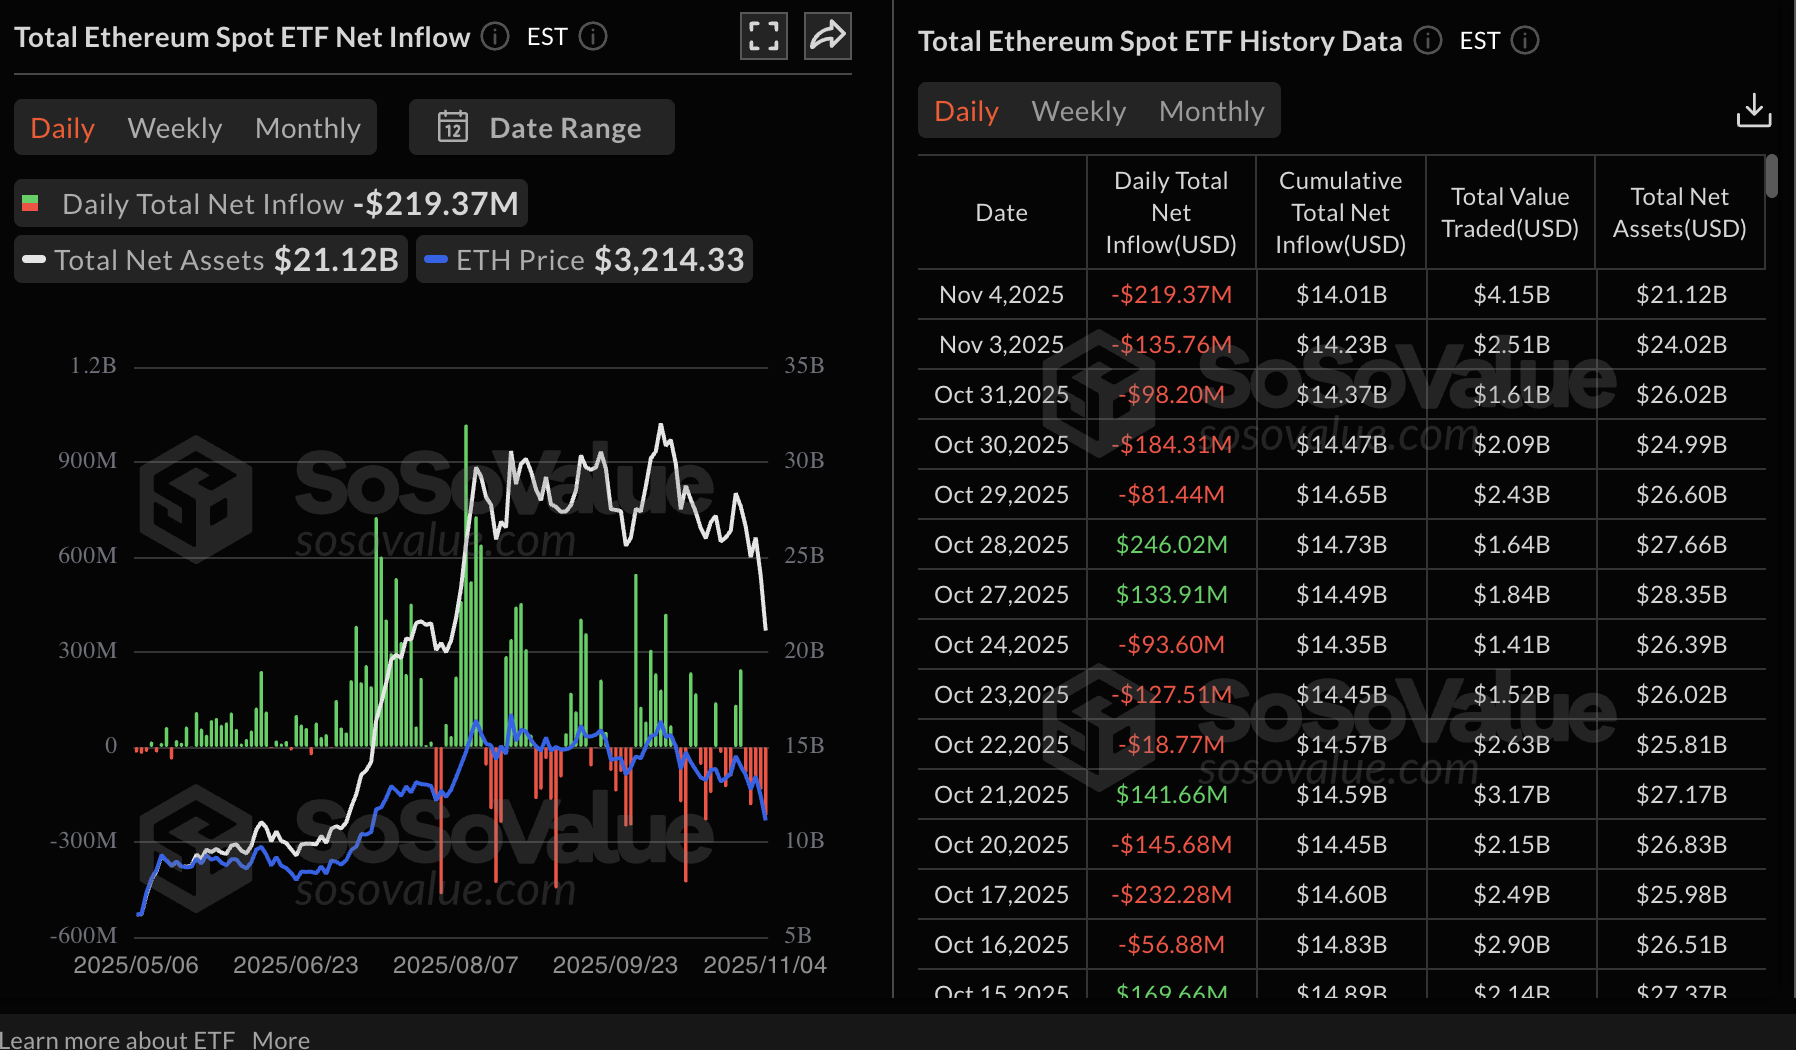
Ethereum ETF stats | Source: SoSoValue
As for XRP, bulls are attempting to take control after Tuesday's sell-off to $2.07. The RSI at 35 is facing upward, indicating easing bearish momentum. Higher RSI readings toward the midline would affirm the bullish momentum, increasing the odds of a reversal above $2.50.
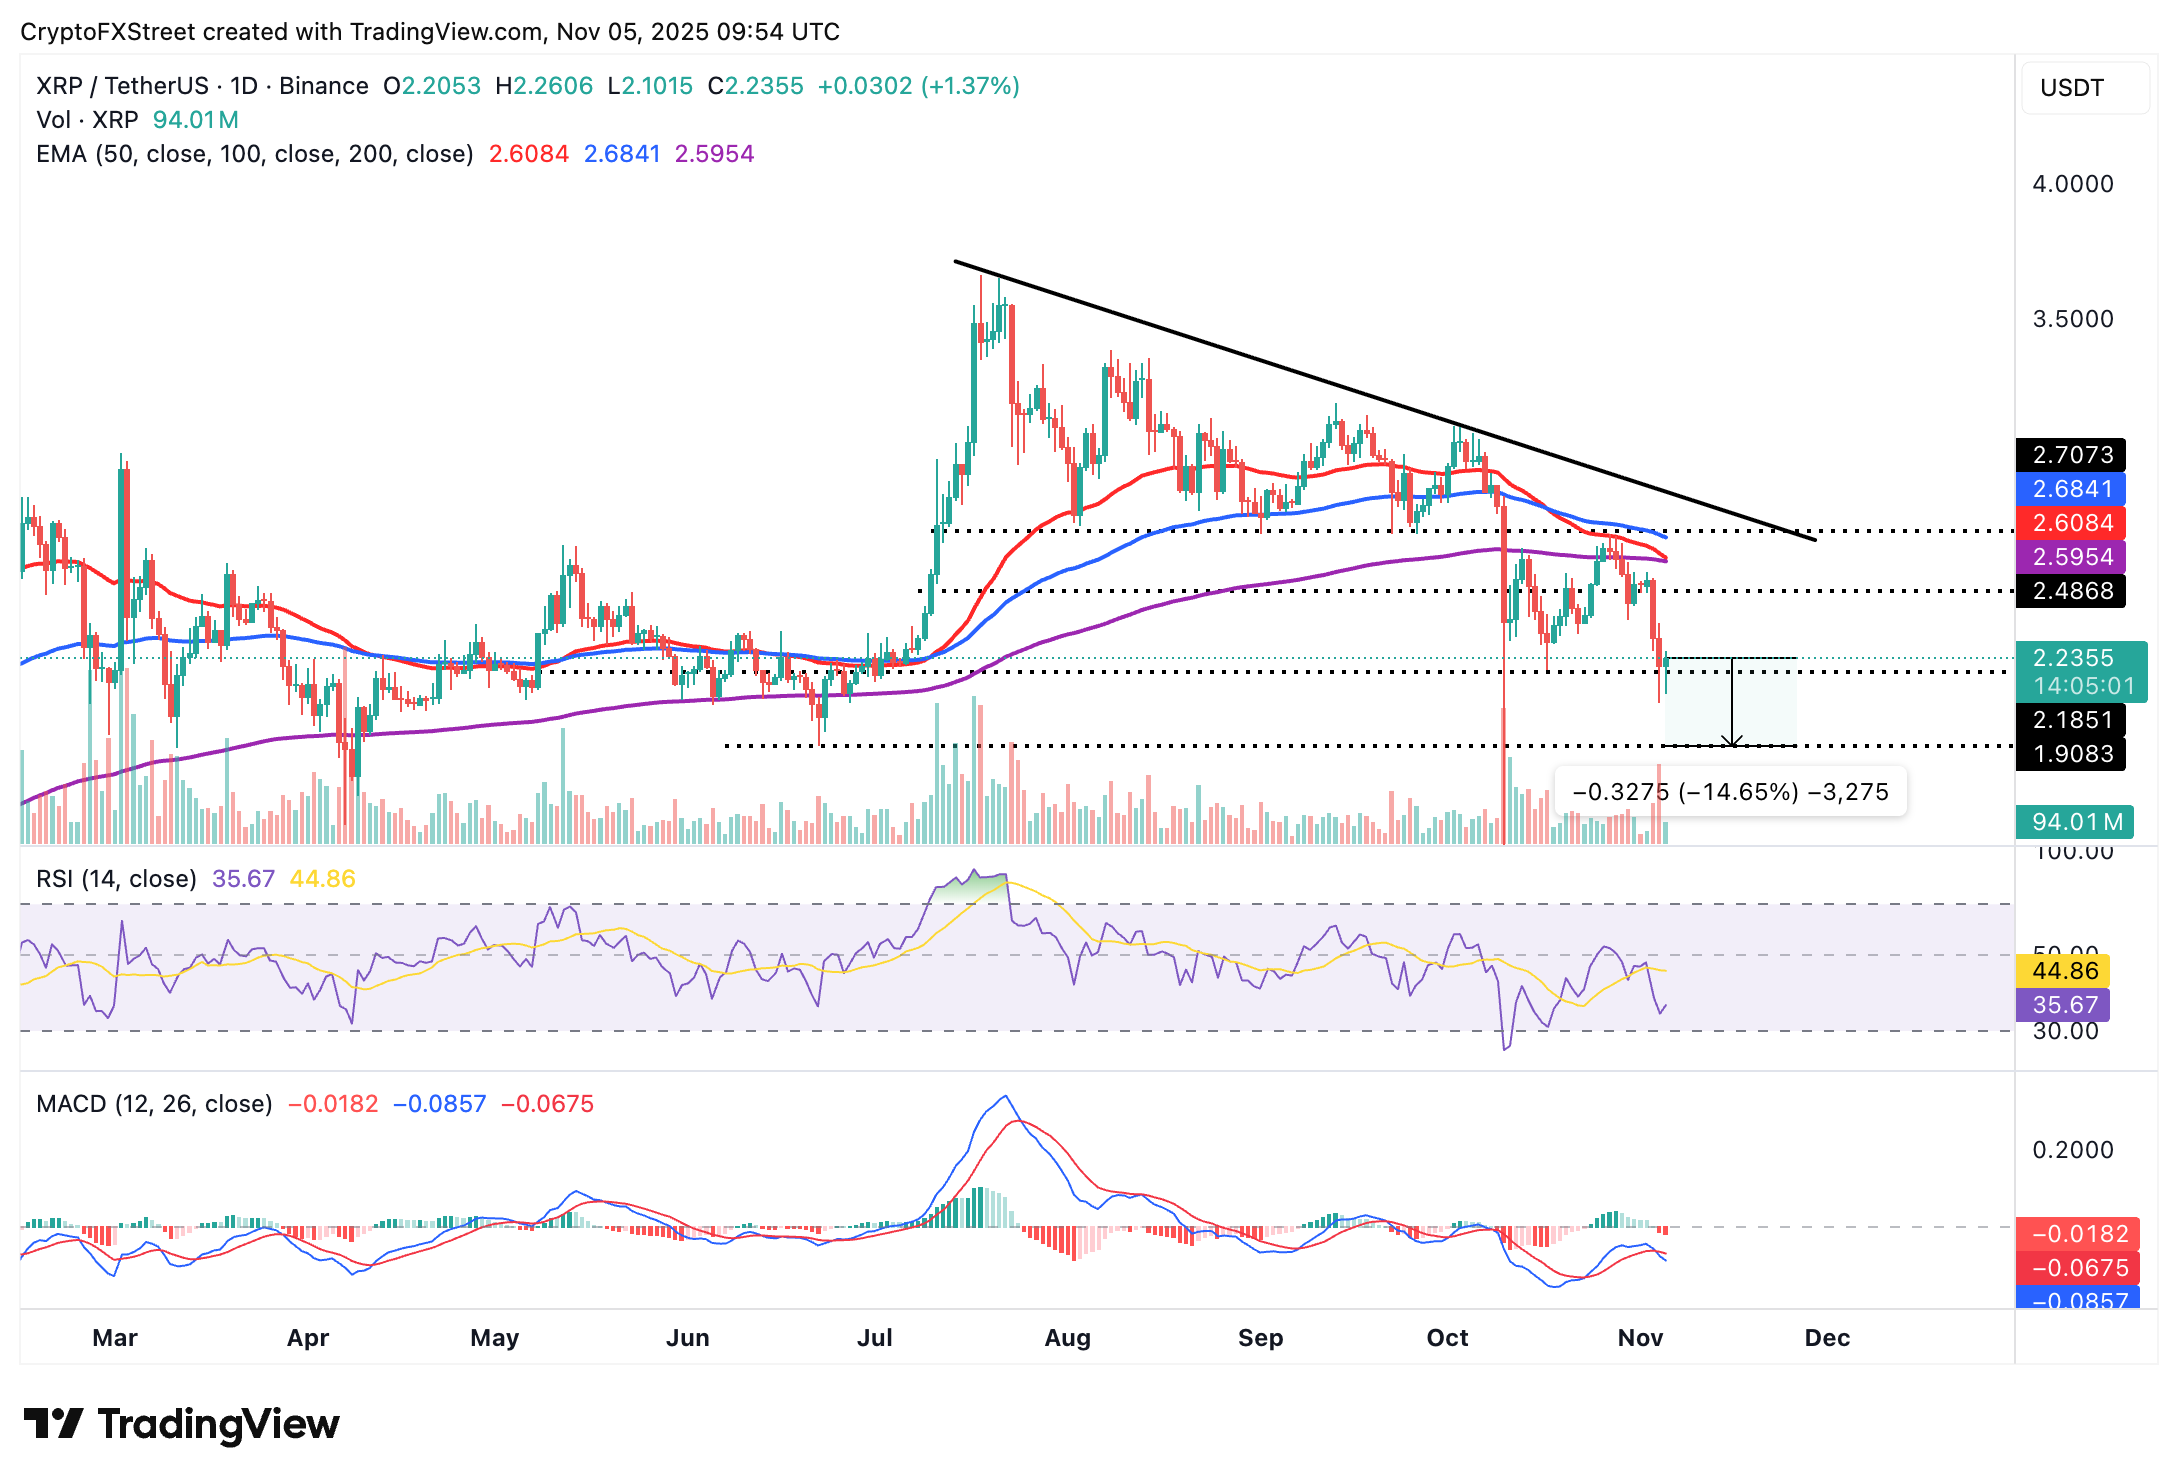
XRP/USDT daily chart
Still, traders should be cautiously optimistic, keeping in mind that the MACD has upheld a sell signal since Tuesday. If the blue line remains below the red signal line as the indicator generally declines, XRP could extend the pullback by nearly 15% to $1.90, previously tested in June.
Bitcoin, altcoins, stablecoins FAQs
Bitcoin is the largest cryptocurrency by market capitalization, a virtual currency designed to serve as money. This form of payment cannot be controlled by any one person, group, or entity, which eliminates the need for third-party participation during financial transactions.
Altcoins are any cryptocurrency apart from Bitcoin, but some also regard Ethereum as a non-altcoin because it is from these two cryptocurrencies that forking happens. If this is true, then Litecoin is the first altcoin, forked from the Bitcoin protocol and, therefore, an “improved” version of it.
Stablecoins are cryptocurrencies designed to have a stable price, with their value backed by a reserve of the asset it represents. To achieve this, the value of any one stablecoin is pegged to a commodity or financial instrument, such as the US Dollar (USD), with its supply regulated by an algorithm or demand. The main goal of stablecoins is to provide an on/off-ramp for investors willing to trade and invest in cryptocurrencies. Stablecoins also allow investors to store value since cryptocurrencies, in general, are subject to volatility.
Bitcoin dominance is the ratio of Bitcoin's market capitalization to the total market capitalization of all cryptocurrencies combined. It provides a clear picture of Bitcoin’s interest among investors. A high BTC dominance typically happens before and during a bull run, in which investors resort to investing in relatively stable and high market capitalization cryptocurrency like Bitcoin. A drop in BTC dominance usually means that investors are moving their capital and/or profits to altcoins in a quest for higher returns, which usually triggers an explosion of altcoin rallies.
Bài viết đề xuất


