
Tron Price Forecast: How rising on-chain activity, stablecoin adoption could spark TRX rally
- Tron consolidates in a narrow range between short-term support at $0.2704 and resistance at $0.2751.
- Tron blockchain makes a strong comeback, with the number of transactions nearing nine million.
- The increase in transactions drives gas fees and volume, with TRX standing out as the go-to blockchain for stablecoin USDT transfers.
Tron (TRX) appears to be on the verge of a bullish move on Friday as it consolidates between support at $0.2704 and resistance at $0.2751. A technical buy signal on the 4-hour chart reflects rising activity on the Tron blockchain, whose transactions have almost doubled since 2023.
Tron flaunts robust blockchain, backed by USDT stablecoin growth
The number of transactions on the Tron blockchain is approaching the nine million mark, almost double the five million recorded in September 2023. According to the Tron transaction count metric on a 30-day moving average (MA), the steady increase in transactions has continued to have a positive impact on the TRX price, which hovered at around $0.07 in September 2023.
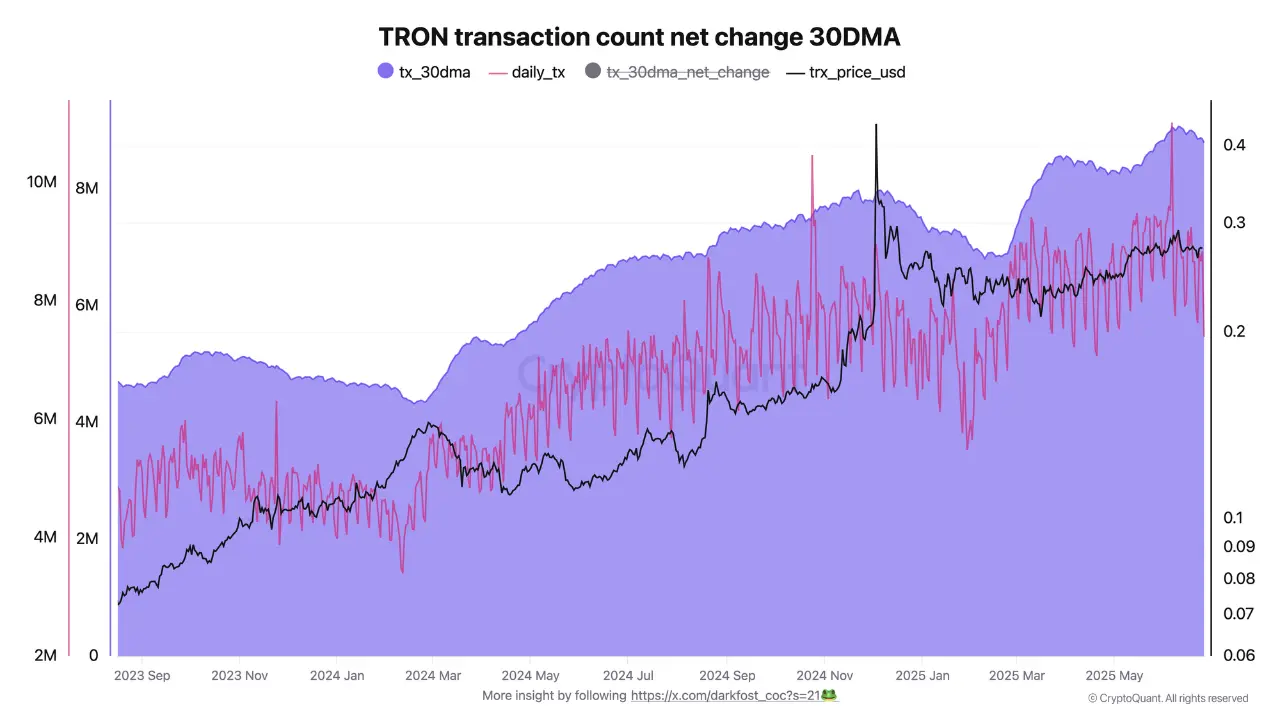
Tron transaction count data | Source | CryptoQuant
The average gas fees on the Tron blockchain have consistently decreased from around 2.72 TRX in September 2023 to approximately 0.79 TRX in June, according to IntoTheBlock’s data.
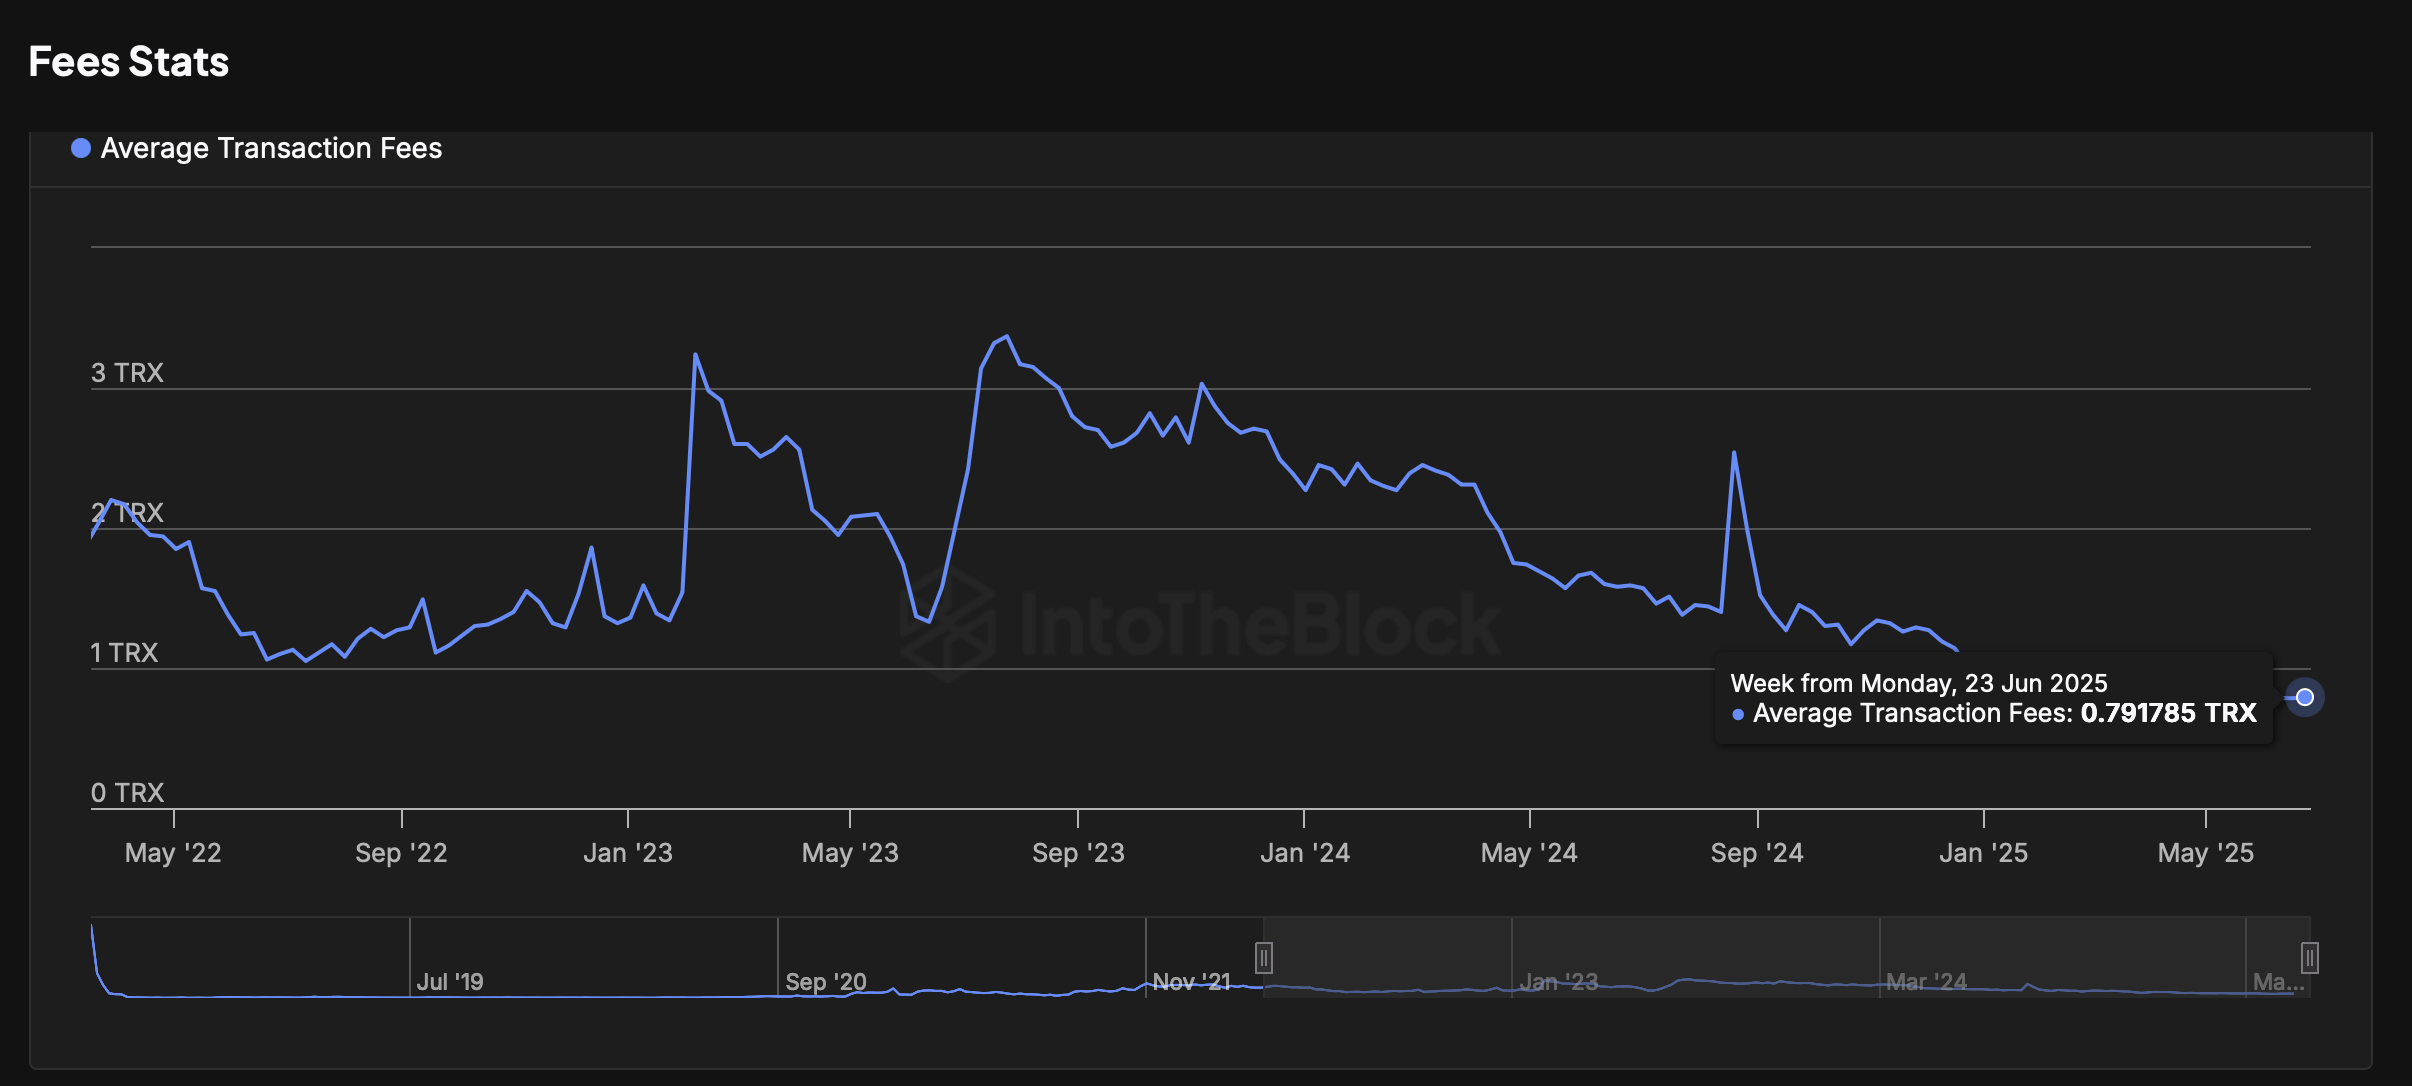
Tron average transaction fees | Source| IntoTheBlock
“Since gas fees are paid in TRX, the steady growth in transaction volume, combined with the slightly higher fees now being paid in TRX, is creating a positive impact on TRX’s price action, driven by functional demand,” an analyst said via CryptoQuant.
Low transaction fees, combined with higher transaction throughput, speed, and network security, have enabled the Tron protocol to take the lead as the preferred USDT stablecoin platform.
The USDT supply on the Tron blockchain reached a new all-time high, surpassing $80 billion on June 23. Since January, USDT on Tron has added over $20 billion in new supply, underscoring the protocol’s role in stablecoin transfers and adoption.
Technical outlook: Tron flaunts key buy signals
Tron’s TRX is attempting a breakout above the short-term 100-period Exponential Moving Average (EMA), currently at $0.2730 on the 4-hour chart. Traders appear to have adopted a risk-on sentiment heading into the weekend, underpinned by a buy signal triggered by the SuperTrend indicator.
This signal has been active since Tuesday, prompting traders to seek exposure to TRX, which in turn increases demand and creates a tail force that could potentially boost the price above the upper consolidation limit at $0.2751.
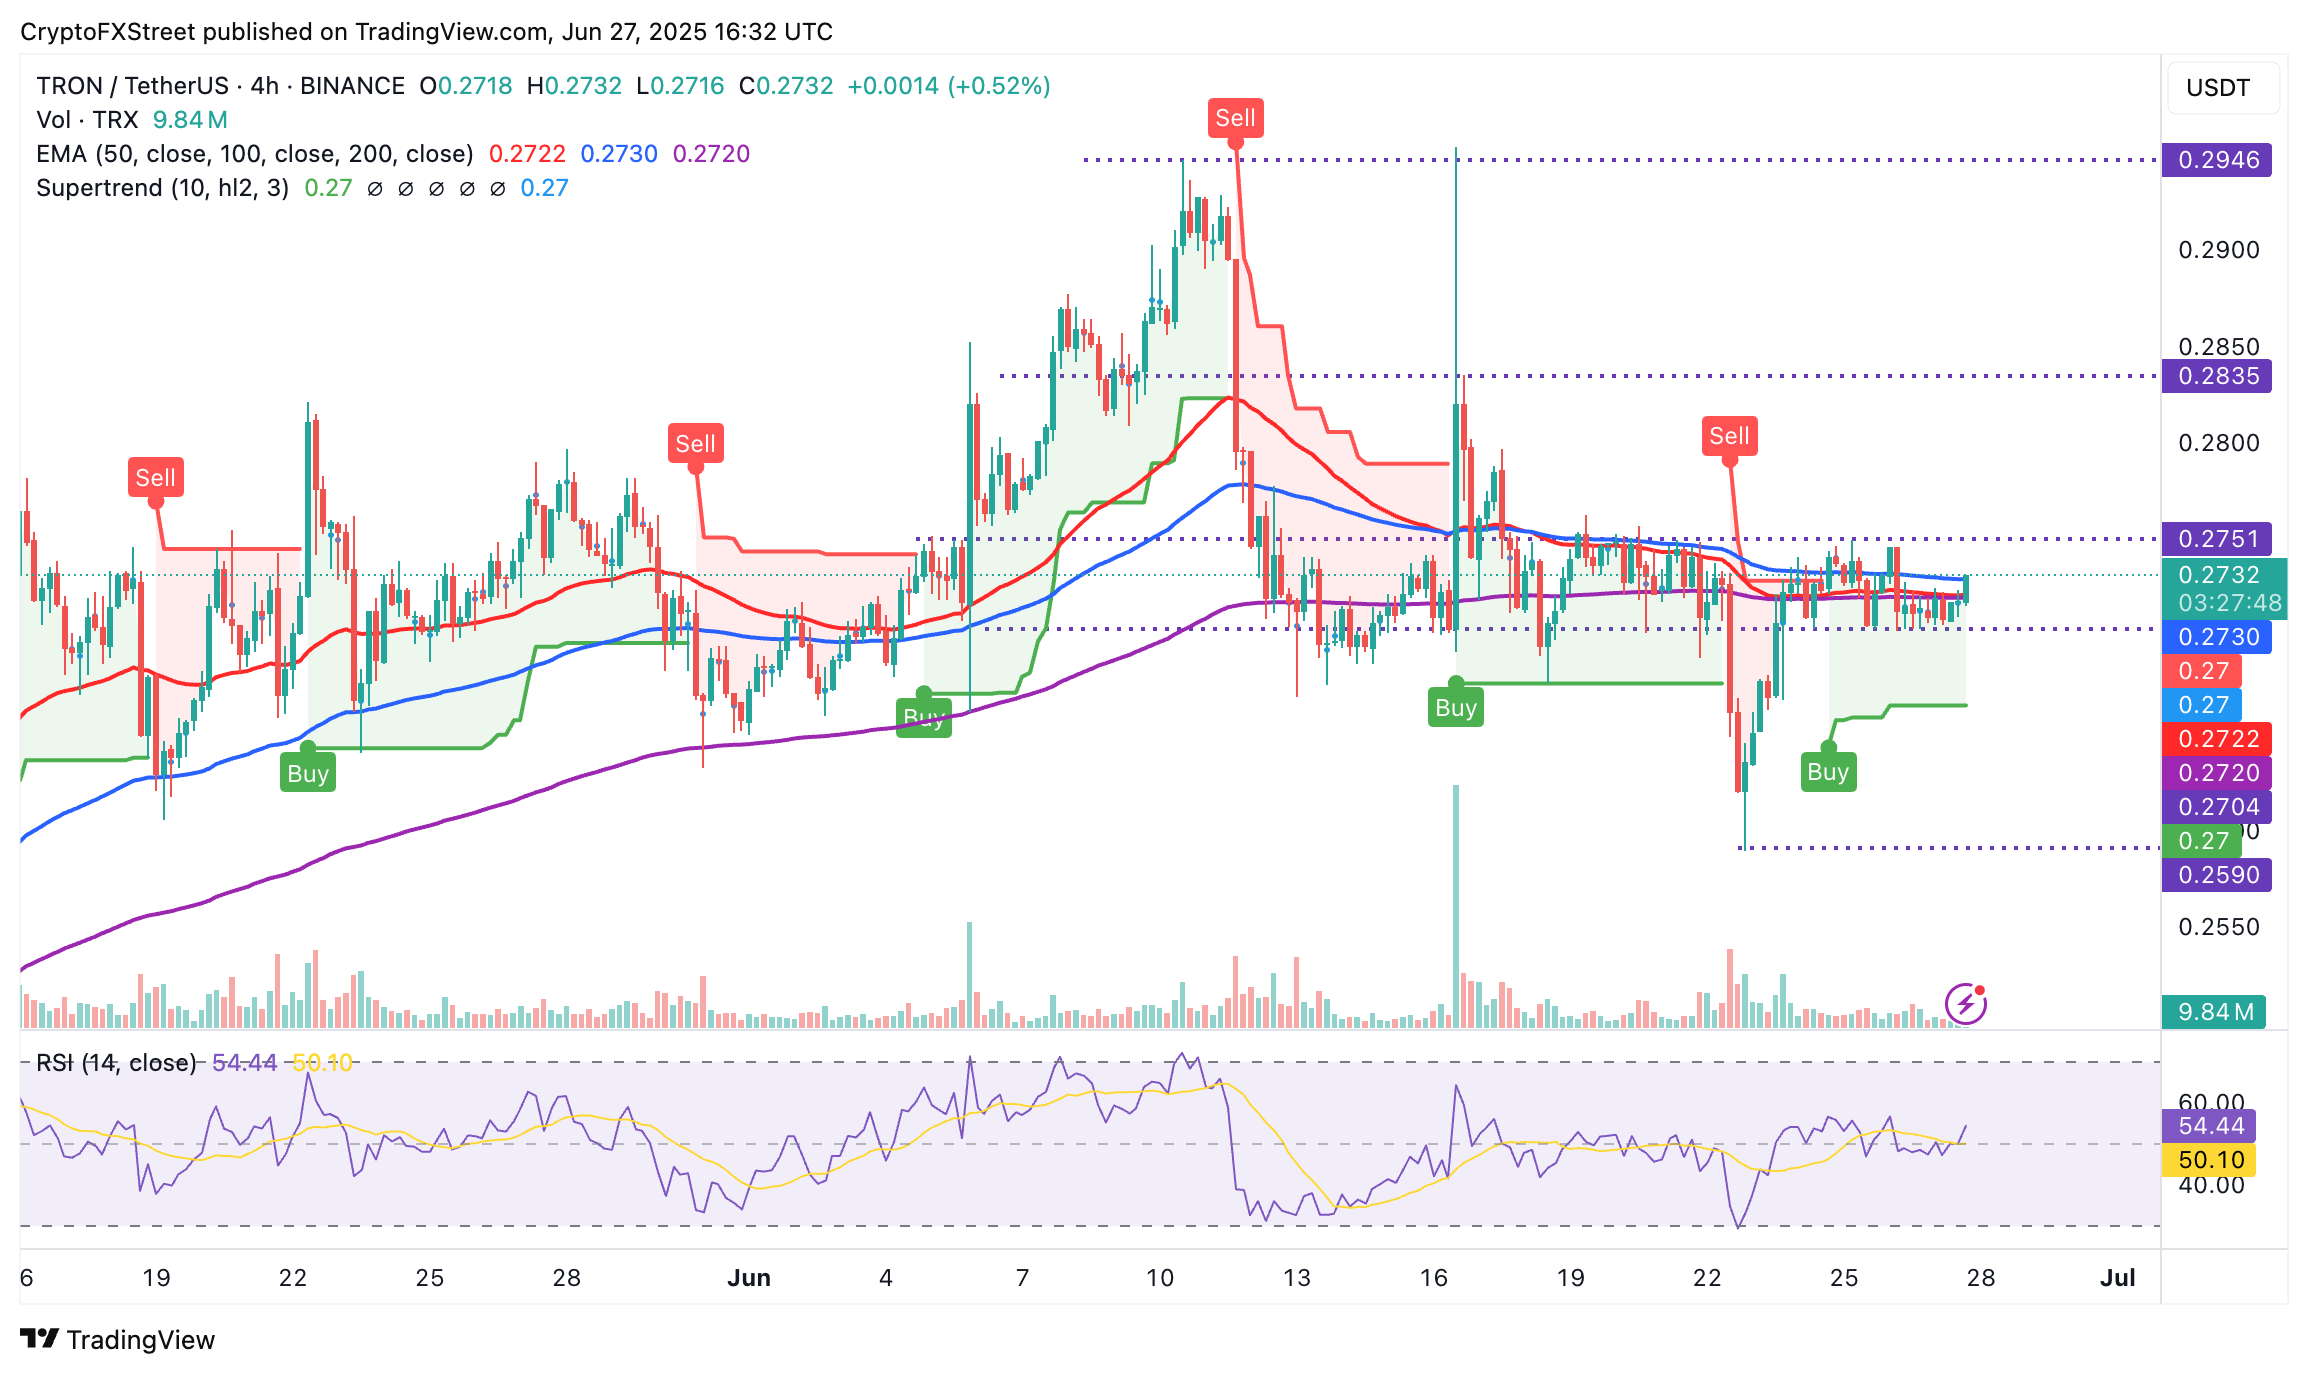
TRX/USDT 4-hour chart
The Relative Strength Index (RSI), currently slightly above the midline, suggests a mild bullish momentum. Its continued movement toward overbought territory could cement the bulls’ positive influence on the price, potentially propelling TRX above the range limit resistance at $0.2751.
Other key levels of interest to traders lie at $0.2835, which was last tested on June 16, and $0.2946, last probed on June 10. A 5% drop to the most recent low of $0.2590 still cannot be ruled out and will likely depend on sentiment and market dynamics in the broader cryptocurrency industry.
Cryptocurrency metrics FAQs
The developer or creator of each cryptocurrency decides on the total number of tokens that can be minted or issued. Only a certain number of these assets can be minted by mining, staking or other mechanisms. This is defined by the algorithm of the underlying blockchain technology. On the other hand, circulating supply can also be decreased via actions such as burning tokens, or mistakenly sending assets to addresses of other incompatible blockchains.
Market capitalization is the result of multiplying the circulating supply of a certain asset by the asset’s current market value.
Trading volume refers to the total number of tokens for a specific asset that has been transacted or exchanged between buyers and sellers within set trading hours, for example, 24 hours. It is used to gauge market sentiment, this metric combines all volumes on centralized exchanges and decentralized exchanges. Increasing trading volume often denotes the demand for a certain asset as more people are buying and selling the cryptocurrency.
Funding rates are a concept designed to encourage traders to take positions and ensure perpetual contract prices match spot markets. It defines a mechanism by exchanges to ensure that future prices and index prices periodic payments regularly converge. When the funding rate is positive, the price of the perpetual contract is higher than the mark price. This means traders who are bullish and have opened long positions pay traders who are in short positions. On the other hand, a negative funding rate means perpetual prices are below the mark price, and hence traders with short positions pay traders who have opened long positions.
Bài viết đề xuất


