
Cardano Price Forecast: ADA eyes further losses as the MVRV ratio flips negative, long liquidations surge
- Cardano edges higher from a short-term support at $0.55, following a 5.65% decline over the last two days.
- The on-chain data display a negative MVRV ratio, labelling Cardano as undervalued.
- Derivatives traders hit a low level of confidence as Open Interest dips, while long liquidations surpass $1 million.
Cardano (ADA) is up 1% at press time on Friday, reversing after two consecutive bearish days. Still, the price action points to a declining trend within a falling channel, as bearish momentum remains intact.
Losing steam, intense profit booking by Cardano investors flips the MVRV ratio negative while the ADA Open Interest dips amid a significant shakeout of bullish positions. A bearish tilt in the technical outlook suggests a steeper correction if the momentum holds.
On-chain data point to Cardano as undervalued
Santiment’s data displays the weekly Market Value to Realized Value (MVRV) ratio turning negative to -12.27%. Typically, the ratio helps analyse the average profit or loss of investors. A negative ratio implies that if all ADA tokens were sold, an average investor would be at a loss of roughly 12%.
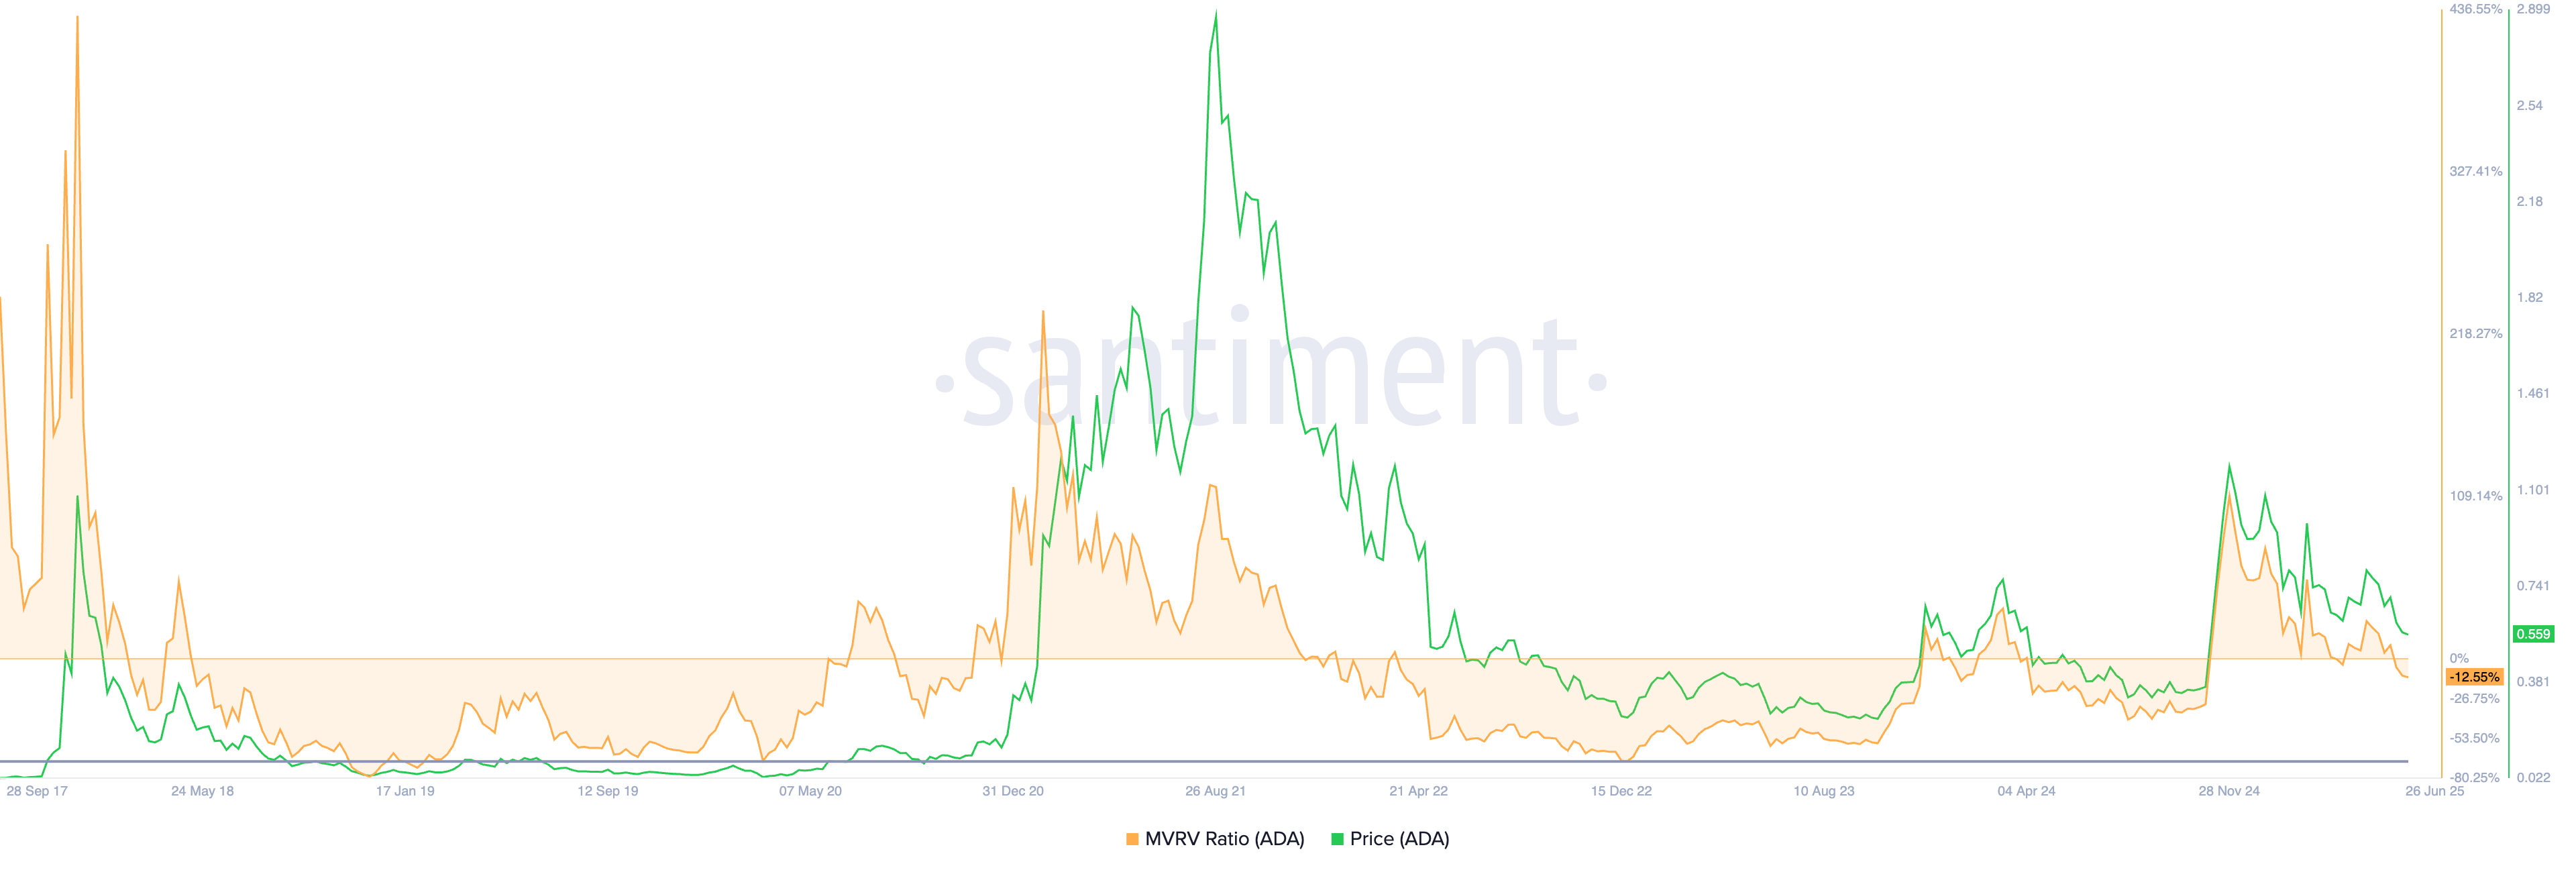
Cardano MVRV. Source: Santiment
It is worth noting that as the market value falls below the realized value, Cardano becomes undervalued, as seen before in 2024 and the period of 2022-23.
Bullish ADA positions worth over $1 million wiped out
CoinGlass’ data shows the ADA Open Interest (OI) at $712.27 million, marking a 2.15% decrease in the last 24 hours. The plunge in OI relates to a halt in capital inflow due to the closing of positions.
Amid declining trading activity, the OI-weighted funding rate has dropped to 0.0029%, from a peak of 0.0075% on Thursday. The funding rates are imposed to balance swap and spot prices, and when the positive rate declines, it indicates a cooled-down buying activity.
The 24-hour liquidations reflect a massive wipeout of bullish-aligned traders. To put this in perspective, the $1 million in long liquidations far exceeds the $180K in short liquidations. Notably, the long/short ratio dips to 0.9429, indicating a significant increase in short positions.
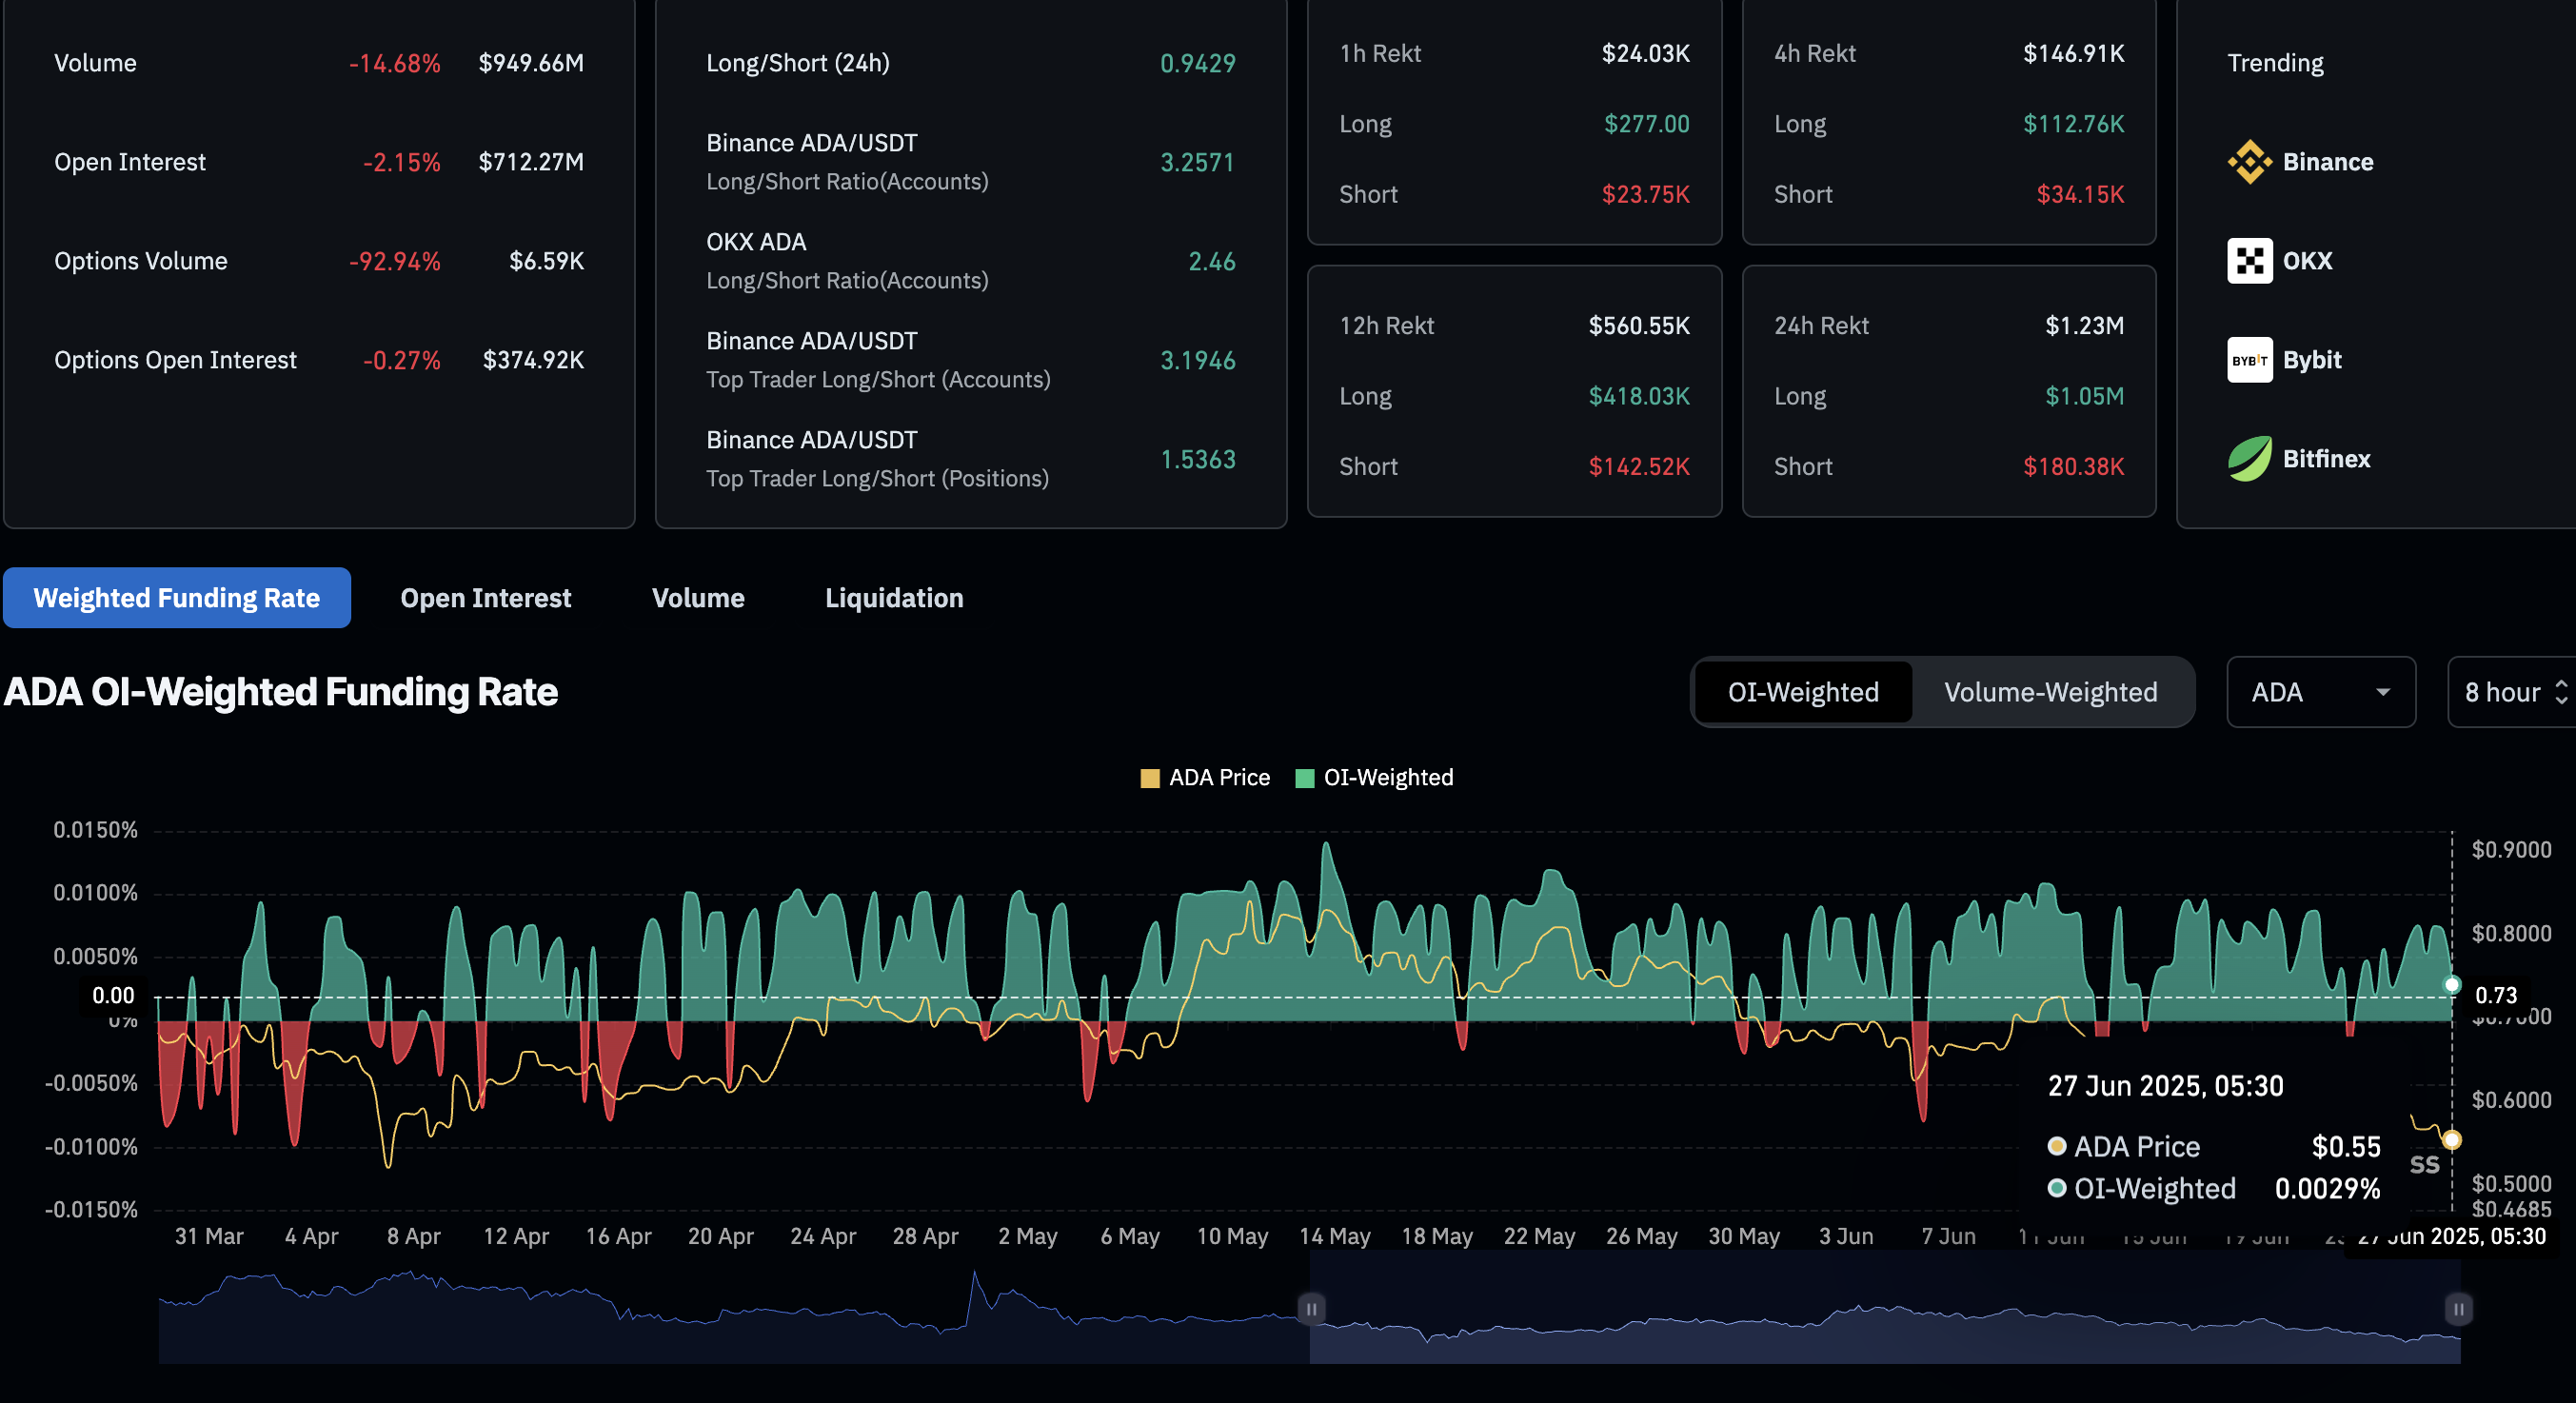
Cardano derivatives data. Source: Coinglass
Cardano struggles to surpass a dynamic resistance within a falling channel
Cardano fails to surpass the 50-period Exponential Moving Average (EMA) on the 4-hour chart, resulting in a pullback to $0.55. With multiple lower shadow candles, ADA edges higher by 1% within four hours, as of press time.
The broader price action forms a falling channel, a bearish trend continuation pattern. A resistance trendline is formed by connecting the swing highs at May 23 and June 11, while the support trendline is connected by bottomed-out downswings on May 19, June 5, and June 19.
A closing below the $0.55 level could extend the correction towards the weekly low of $0.52, followed by the psychological support of $0.50.
The Moving Average Convergence/Divergence (MACD) indicator displays a sell signal as the MACD line crosses below its signal line.
Still, the Relative Strength Index (RSI) at 44 takes an uptick as Cardano edges higher from a newly formed base.
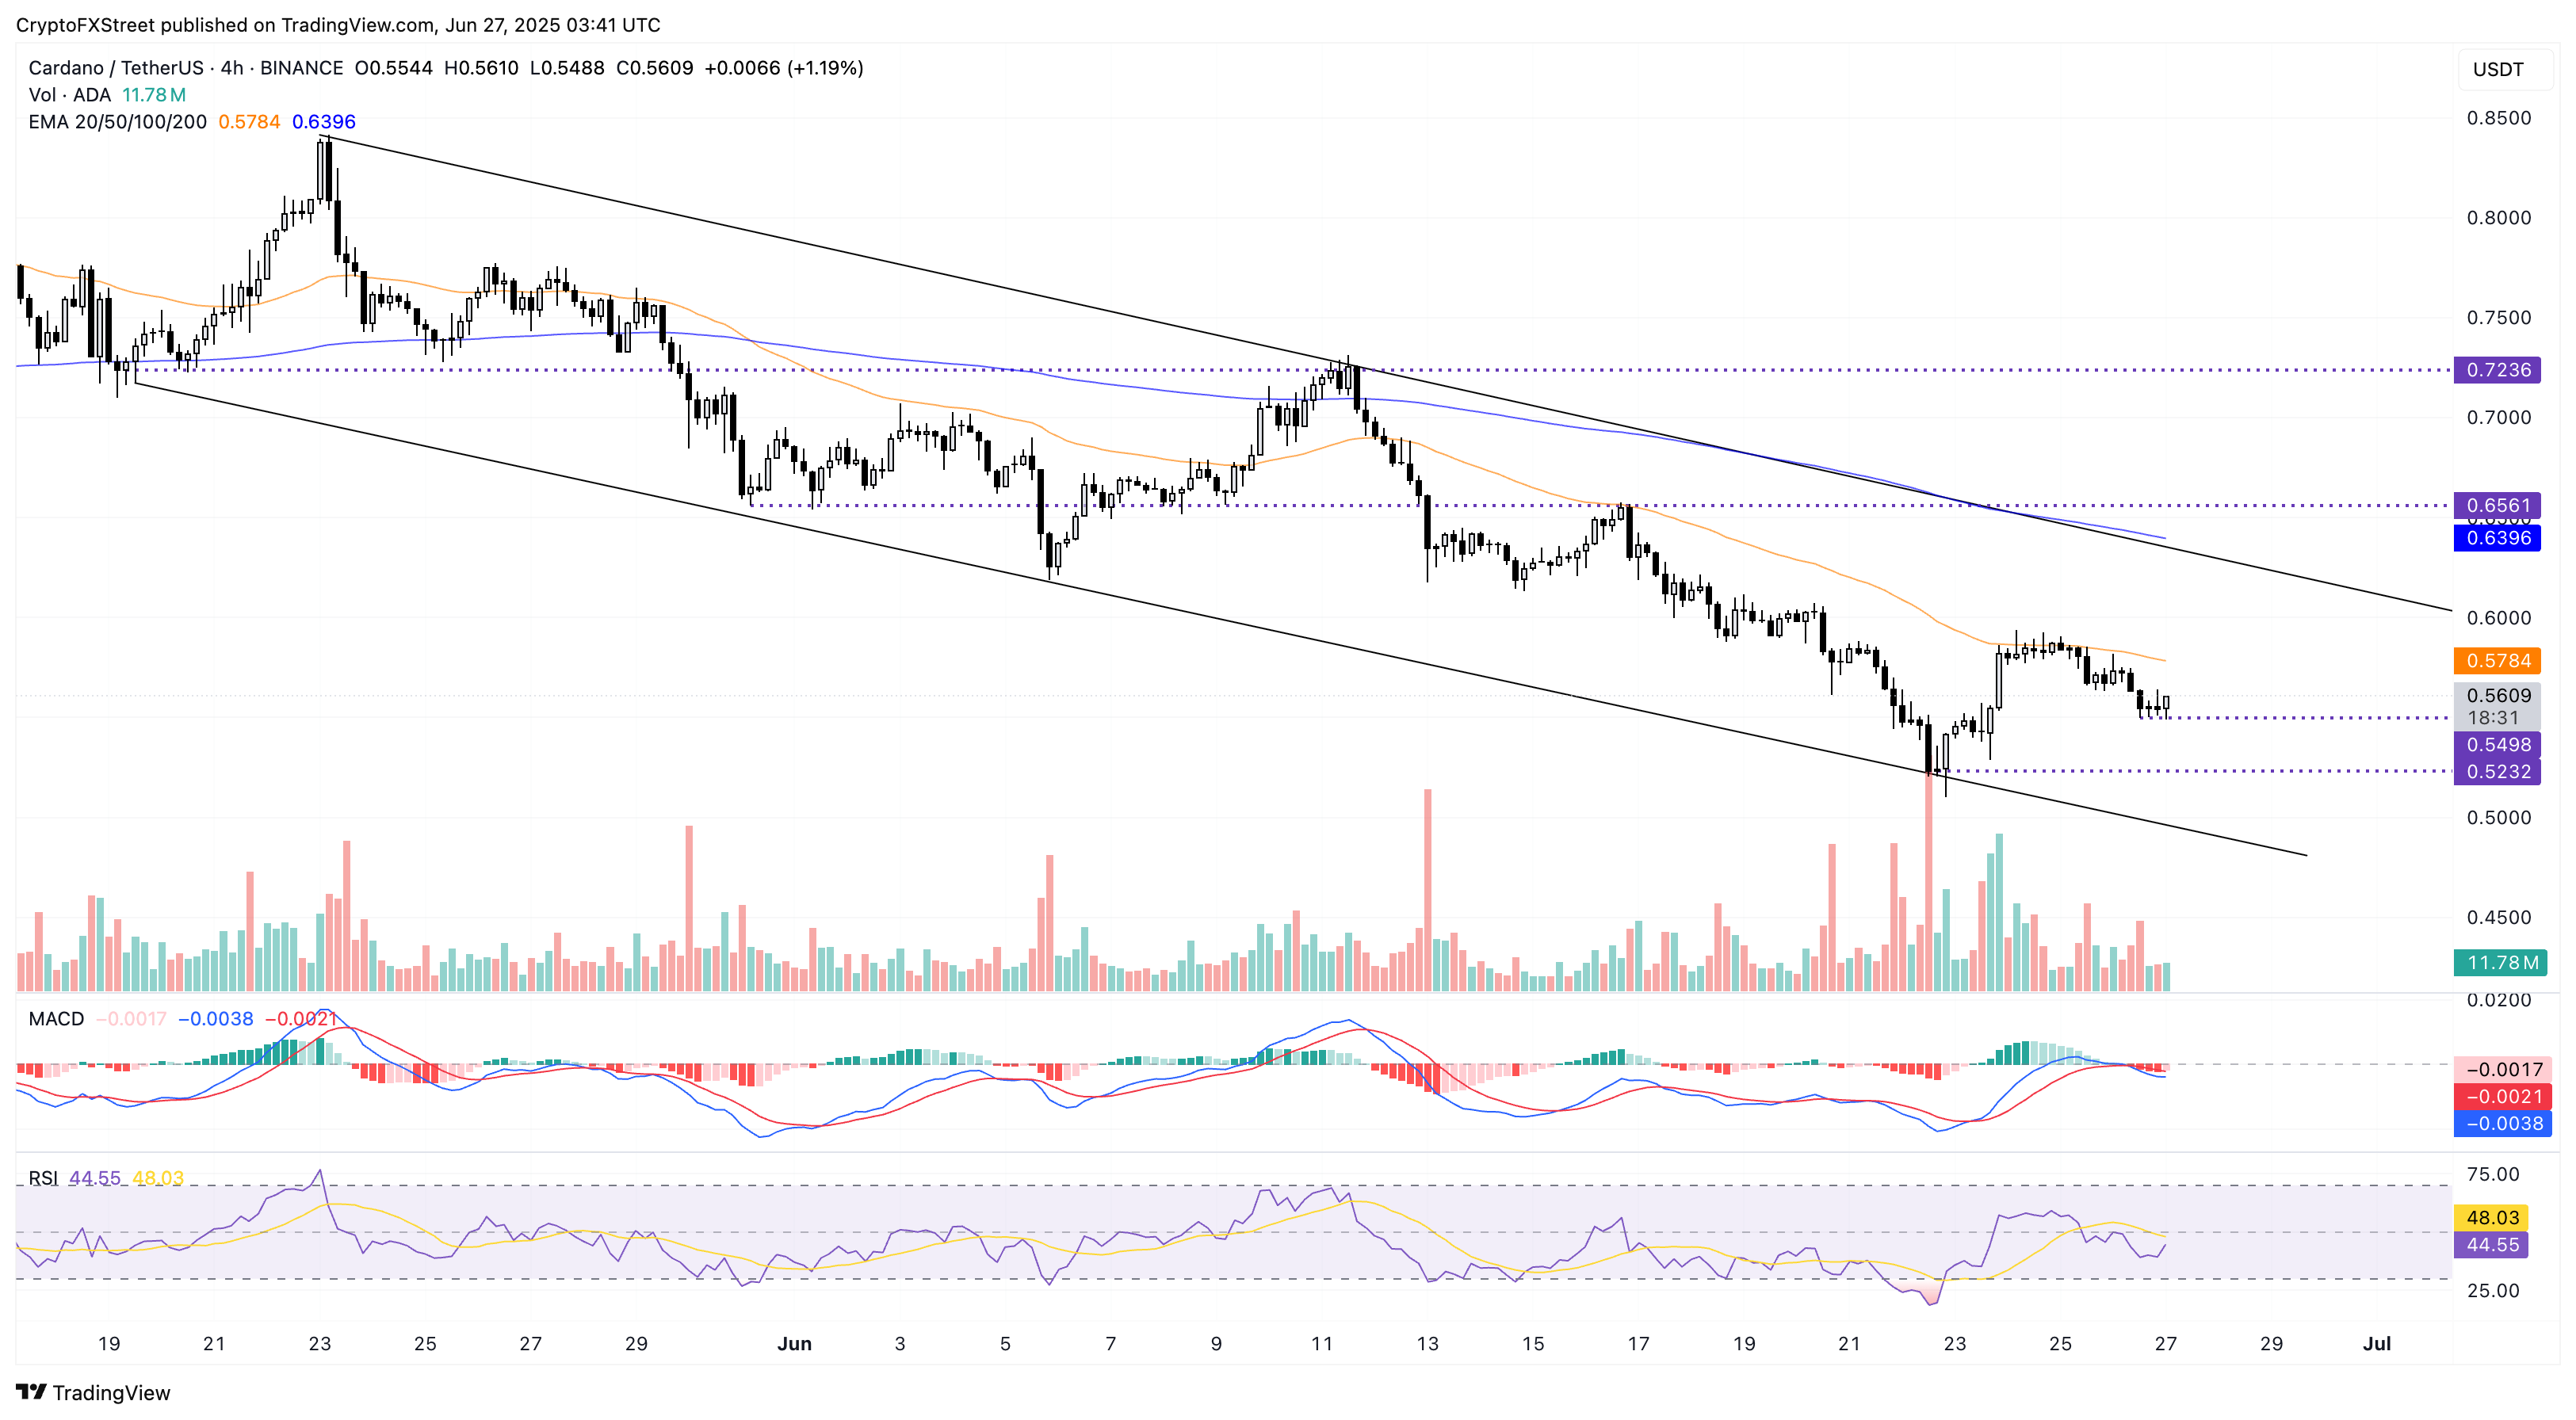
ADA/USDT daily price chart.
A closing above the 50-day EMA could propel Cardano towards the channel’s upper boundary, moving along the 200-day EMA at $0.63.
Bài viết đề xuất


