


Ethereum Price Forecast: ETH falters as returning retail demand fails to offset ETF outflows
- Ethereum slides below $1,750 on Friday, weighed down by extreme fear in market sentiment.
- Ethereum derivatives post mild increases in futures Open Interest, but persistent ETF outflows overwhelm the bulls.
- Ethereum marks three consecutive days of declines, defined by downtrending major moving averages and weak momentum indicators.
Ethereum (ETH) continues to face intense headwinds, trading below $1,750 on Friday. Broadly, the smart contract token is down about 6% since Monday and 23% from November 1.
This persistent pullback can largely be attributed to risk-off sentiment following the Binance hack, macroeconomic pressures including sticky US inflation, and a lack of catalysts to sustain higher crypto prices.
Ethereum ETF outflows offset growing retail demand
Ethereum spot Exchange-Traded Funds (ETFs) recorded $131 million in outflows on Thursday, increasing from roughly $40 million the day before. Outflows have dominated this week, totaling $217 million through Thursday. Meanwhile, cumulative inflows continue their persistent decline to $11.3 billion, with net assets under management averaging $9.6 billion, according to SoSoValue.
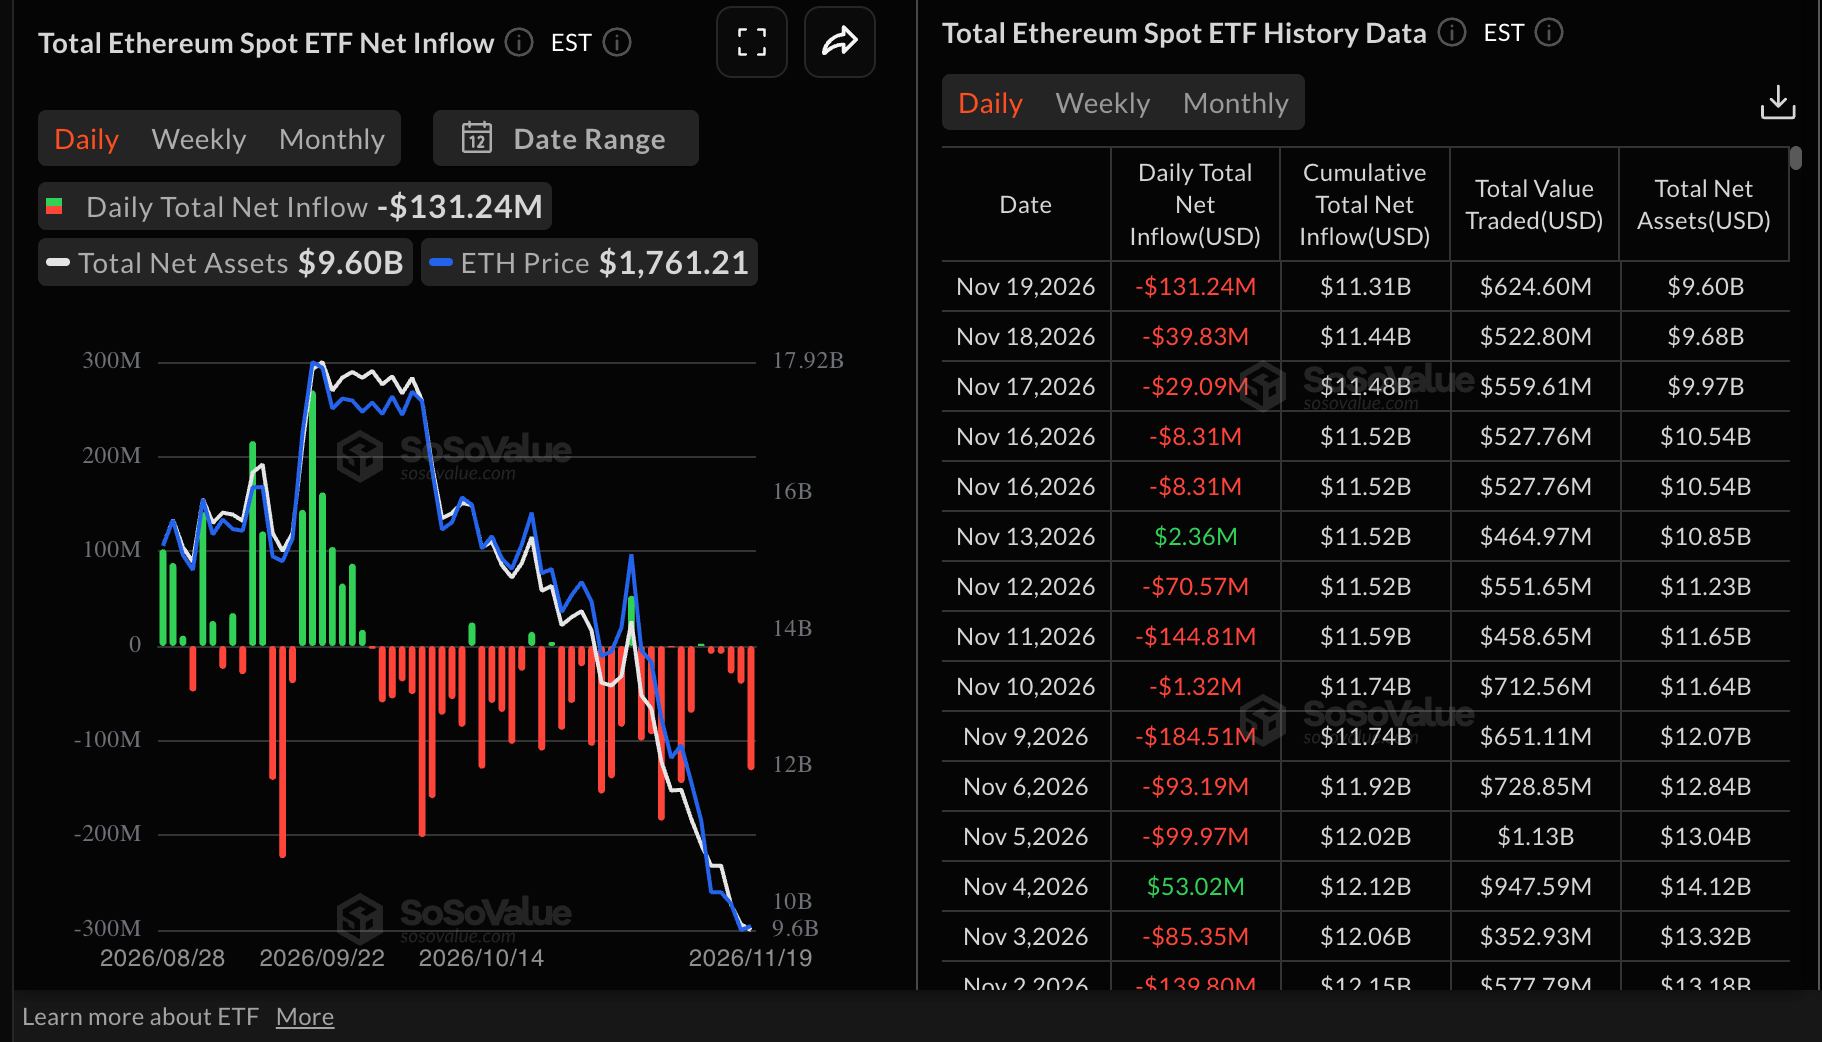
“More concerning than the price action itself is the persistent withdrawal of institutional capital,” CryptoQuant said in an emailed report, adding, “US spot Bitcoin ETFs recorded $582 million in net outflows on Thursday alone, bringing weekly withdrawals through Thursday to approximately $1.12 billion, while Ethereum ETFs shed approximately $209 million over the same four trading sessions.”
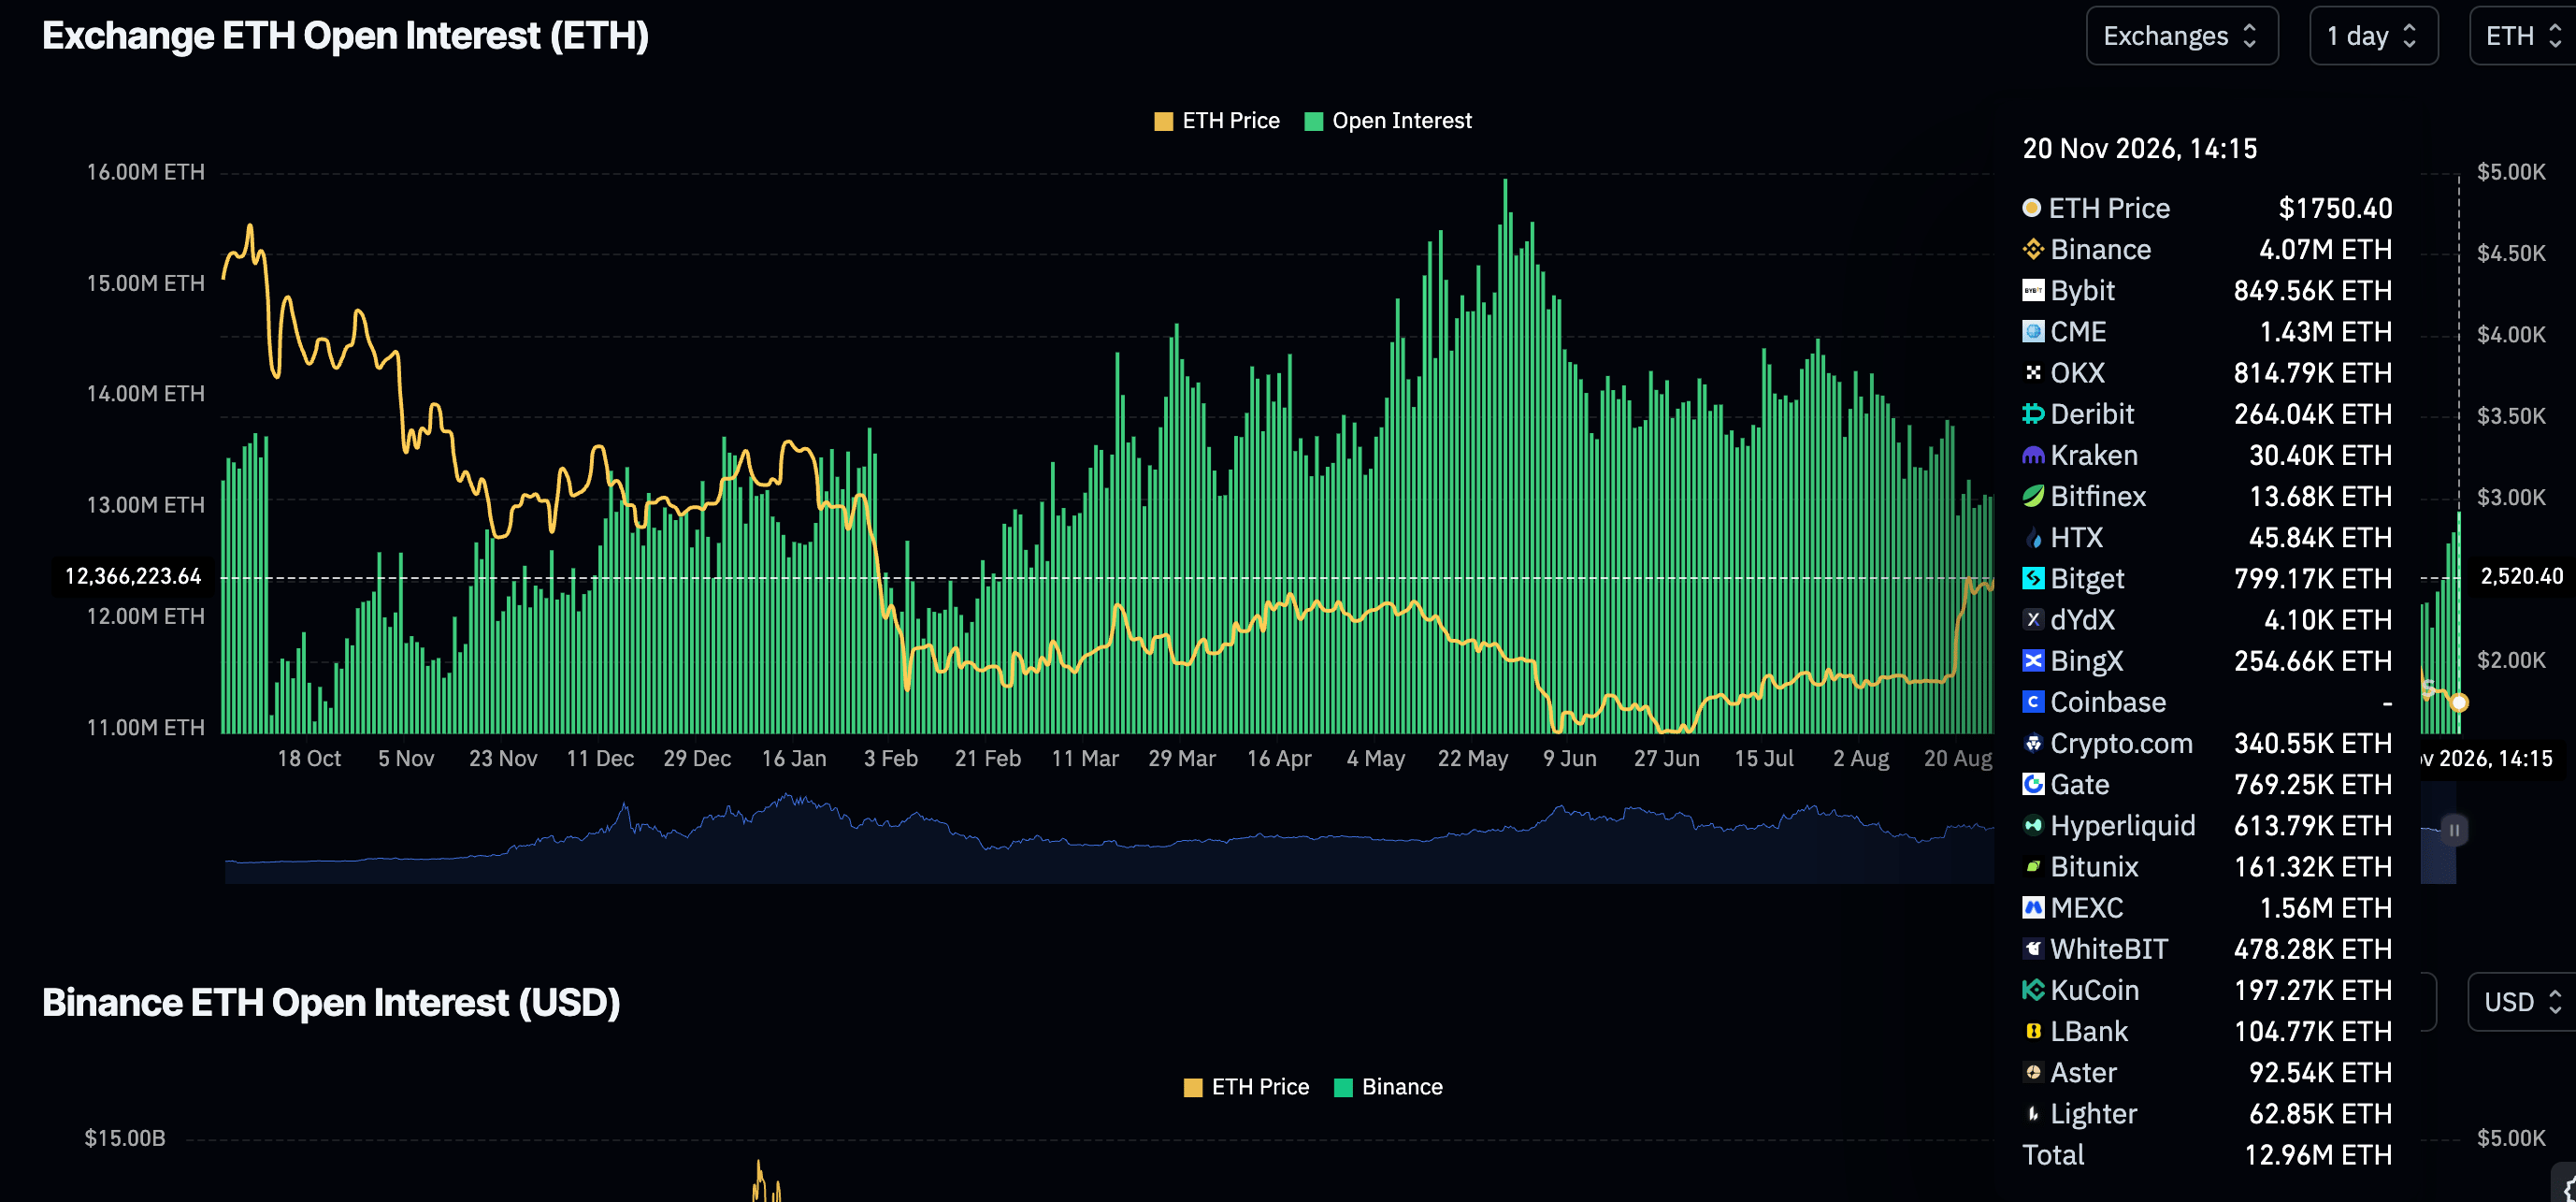
Meanwhile, retail demand is gradually returning, as evidenced by the increase in perpetual futures Open Interest (OI) to 12.96 million ETH on Friday, from 12.67 million ETH the previous day. This represents a 2.3% increase in less than two days, not to mention Monday’s OI level of 11.91 million ETH. If sustained, rising OI could support a short-term recovery outlook and encourage more traders to take on risk.
Technical analysis: Ethereum sellers retain control
Ethereum trades at $1,754, extending a bearish phase as price holds well below the 50-day, 100-day and 200-day Exponential Moving Averages (EMAs) at $2,189, $2,244 and $2,293, respectively. This stacked EMA configuration above spot suggests persistent downside pressure despite an already stretched sell-off, while the SuperTrend support line lags far below at $2,038.
Momentum remains weak, with the Moving Average Convergence Divergence (MACD) indicator deeply negative and the Relative Strength Index (RSI) slipping into oversold territory near 23, suggesting that while the trend remains biased lower, scope for an oversold bounce is building.
On the topside, initial resistance lies at the 50-day EMA around $2,189, followed by the 100-day EMA at $2,244 and the 200-day EMA near $2,293, which together form a broad cap that would need to be cleared to ease the bearish technical tone. On the downside, structural support from the SuperTrend indicator does not emerge until around $2,038, leaving the pair vulnerable to further declines while it trades beneath the clustered moving averages, even if oversold conditions later trigger corrective recovery attempts.
(The technical analysis of this story was written with the help of an AI tool. Know more.)
Open Interest, funding rate FAQs
Higher Open Interest is associated with higher liquidity and new capital inflow to the market. This is considered the equivalent of increase in efficiency and the ongoing trend continues. When Open Interest decreases, it is considered a sign of liquidation in the market, investors are leaving and the overall demand for an asset is on a decline, fueling a bearish sentiment among investors.
Funding fees bridge the difference between spot prices and prices of futures contracts of an asset by increasing liquidation risks faced by traders. A consistently high and positive funding rate implies there is a bullish sentiment among market participants and there is an expectation of a price hike. A consistently negative funding rate for an asset implies a bearish sentiment, indicating that traders expect the cryptocurrency’s price to fall and a bearish trend reversal is likely to occur.
Bài viết đề xuất


