
Solana Price Forecast: SOL risks a steeper decline below $70 despite steady ETF inflows

Nguồn Fxstreet
  • Solana edges lower on Monday, facing downside pressure with the price capped below its 50-day EMA at $75.68.
  • Institutional demand shows resilience with five consecutive weekly inflows totaling $14.62 million in July.
  • Retail demand eases as trading volume declines and the funding rate turns negative. 

Solana (SOL) is trading in the red on Monday, losing bullish momentum and remaining capped below its 50-day Exponential Moving Average (EMA) at $75.68. SOL-focused Exchange Traded Funds (ETFs) show resilience with a monthly inflow of $14.62 million in July, while the near-term retail support wanes with the funding rate turning negative. The technical outlook for SOL is mildly bearish as downside momentum gains traction. 

Solana loses retail strength despite resilient ETF inflows

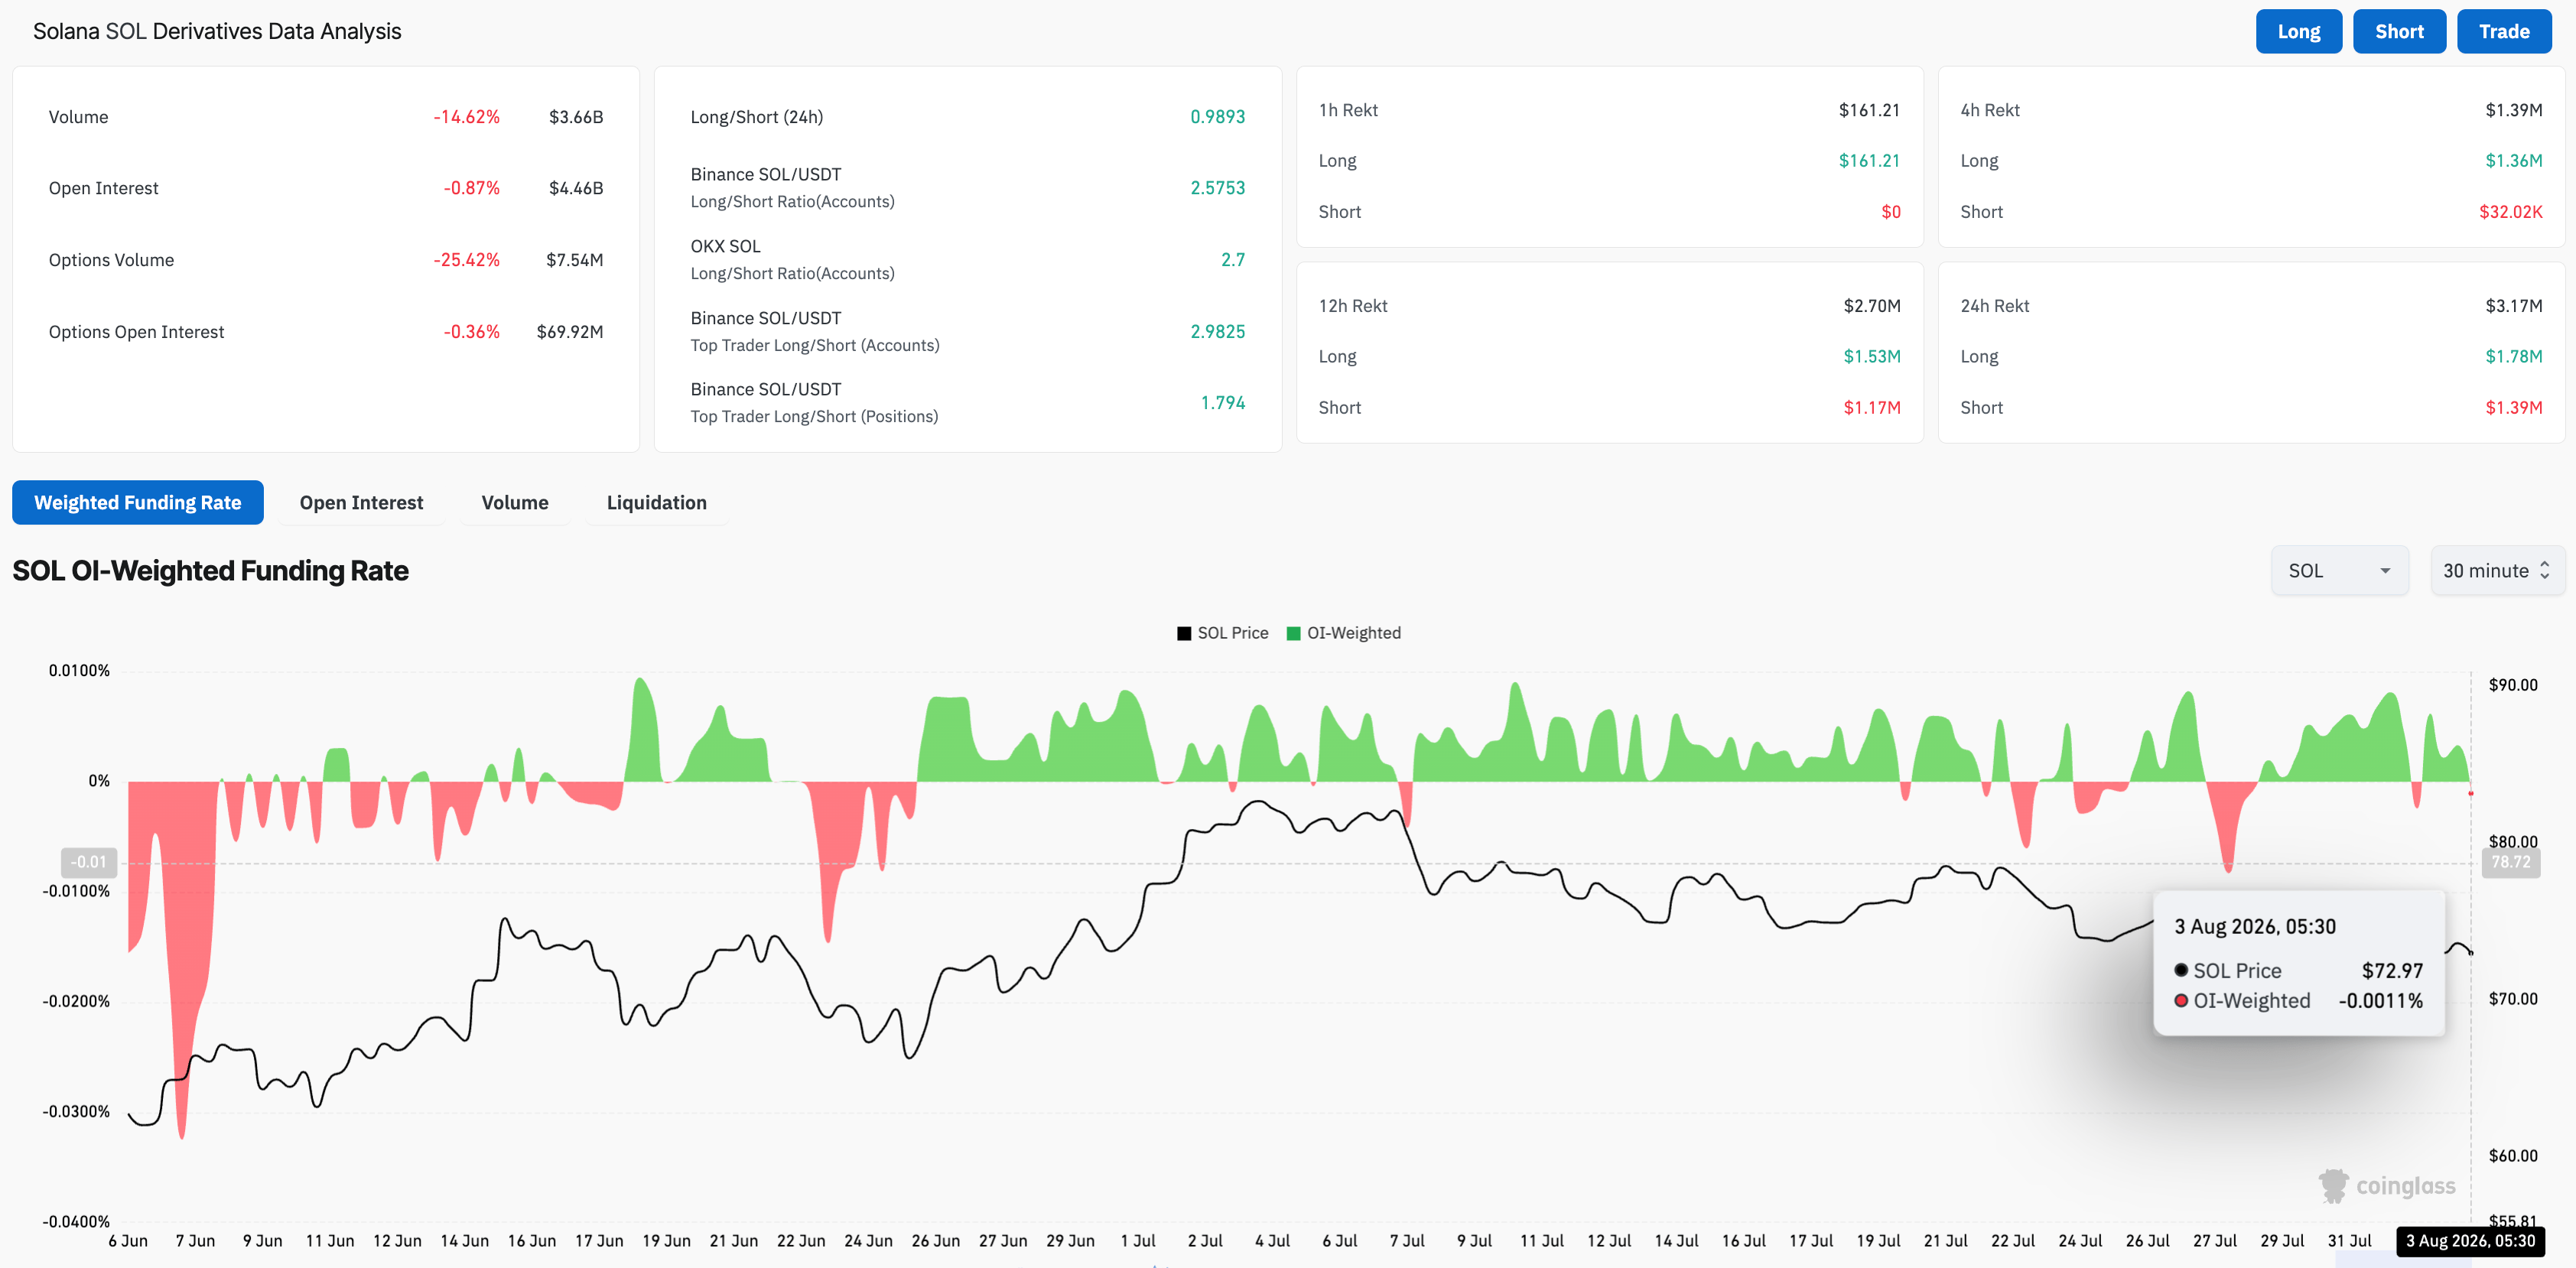
Solana is facing reduced speculative demand as broader crypto market sentiment weakens, while institutional investors remain resilient. CoinGlass data shows that SOL futures trading volume fell 14% over the last 24 hours to $3.66 billion, indicating reduced retail activity. Meanwhile, the funding rate – the premium traders are willing to pay to hold a position – has flipped negative to -0.0011% from a peak of 0.0062% on Sunday, pointing to a bearish bias. 

On the other hand, SOL ETFs recorded $2.82 million in inflows last week, extending a streak of five consecutive weekly inflows and bringing July inflows to $14.62 million. This marks the lowest monthly positive flow, up from $786,580 in outflows in May, which could be an early sign of renewed institutional demand. 
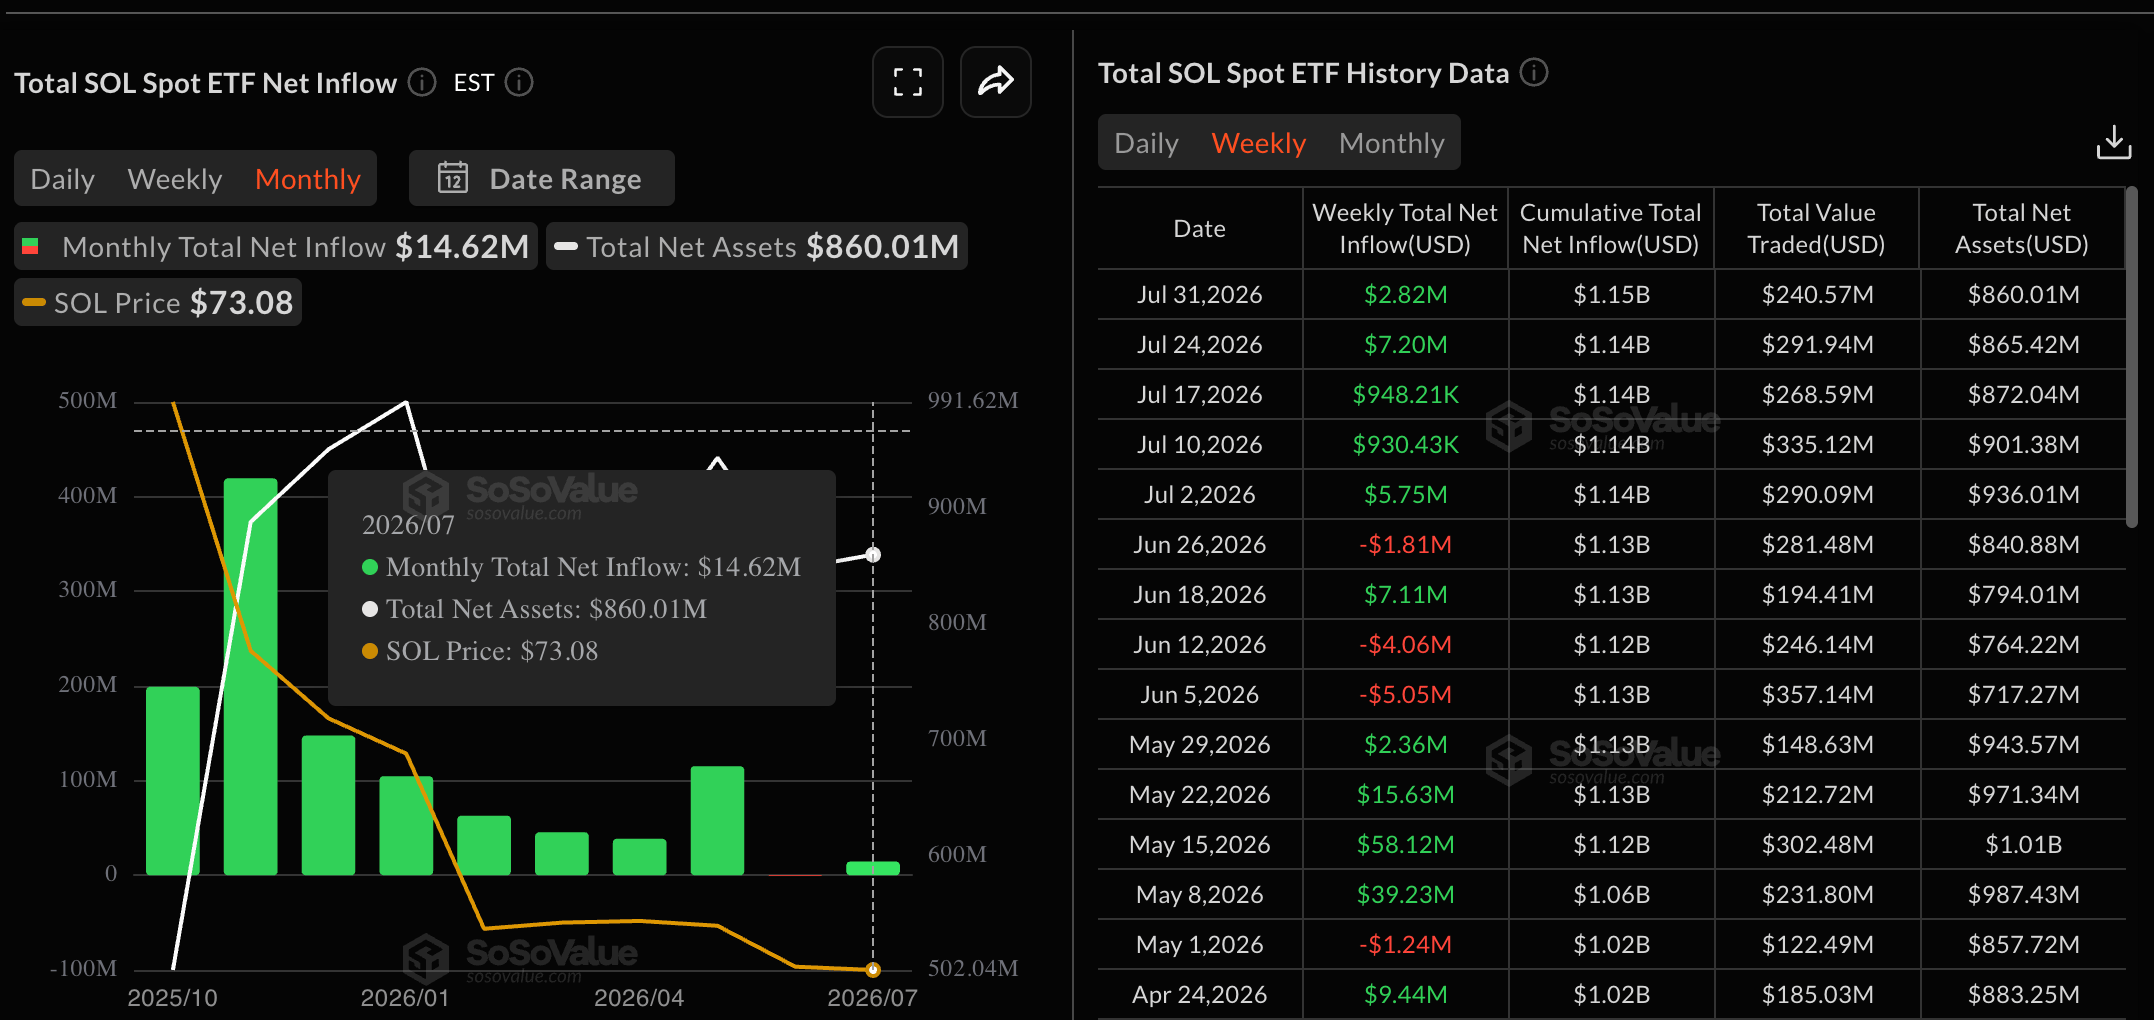
SOL ETFs data. Source: Sosovalue
SOL derivatives data. Source: CoinGlass

Technical outlook: Will Solana price drop below $70?

Solana maintains a bearish near-term tone, capped below its 50-day EMA at $75.68 and well under the 200-day EMA at $92.69. From a technical perspective, SOL trades below a descending trendline near $76.06 and is heading toward the support trendline near $71.30.

A decisive close below this zone could extend the decline toward the 78.6% Fibonacci retracement of the downswing from the $98.41 high to the $60.13 low, at $66.81

Momentum aligns with this capped structure, as the Relative Strength Index (RSI) at 43 hovers below the midline and the Moving Average Convergence Divergence (MACD) remains negative below the signal line, suggesting firm downside pressure.

Chart Analysis SOL/USDT (Binance)
SOL/USDT daily price chart.

On the topside, immediate resistance is clustered between the 50-day EMA at $75.68 and the trendline break level at $76.06. Further up, the 50% retracement at $79.27 defines a key barrier before the 23.6% retracement at $87.60 and the 200-day EMA at $92.69.

(The technical analysis of this story was written with the help of an AI tool. Know more.)

Tuyên bố miễn trừ trách nhiệm: Chỉ dành cho mục đích thông tin. Hiệu suất trong quá khứ không đảm bảo cho kết quả trong tương lai.
placeholder
Thặng dư ADR của SK Hynix thu hẹp mạnh, Chuyển đổi hai chiều cận kề, Cửa sổ kinh doanh chênh lệch giá thử thách việc định giáSau khi trải qua một đợt tăng vọt mạnh mẽ sau khi niêm yết lần đầu, mức thặng dư ADR của SK Hynix ( SKHY) đang nhanh chóng thu hẹp. Trong phiên giao dịch tại Mỹ vào thứ Tư ngày 15 tháng 7
Tác giả  TradingKey
7 tháng 16 ngày Thứ Năm
Sau khi trải qua một đợt tăng vọt mạnh mẽ sau khi niêm yết lần đầu, mức thặng dư ADR của SK Hynix ( SKHY) đang nhanh chóng thu hẹp. Trong phiên giao dịch tại Mỹ vào thứ Tư ngày 15 tháng 7
placeholder
Ethereum tăng vọt hướng tới mốc 2.000 USD, chạm mức cao nhất trong hai thángGiá Ethereum tăng mạnh áp sát mốc 2.000 USD, các mức tăng tiếp theo vượt qua ngưỡng này sẽ phụ thuộc vào cuộc họp quyết định lãi suất sắp tới của Fed.Vào ngày 27/7, Ethereum ( ETH) đã tăn
Tác giả  TradingKey
7 tháng 27 ngày Thứ Hai
Giá Ethereum tăng mạnh áp sát mốc 2.000 USD, các mức tăng tiếp theo vượt qua ngưỡng này sẽ phụ thuộc vào cuộc họp quyết định lãi suất sắp tới của Fed.Vào ngày 27/7, Ethereum ( ETH) đã tăn
placeholder
WTI giảm xuống dưới 83,00$ bất chấp các cuộc giao tranh ở Trung ĐôngWest Texas Intermediate (WTI), chuẩn dầu thô của Mỹ, đang giao dịch quanh mức 82,80$ trong đầu phiên giao dịch châu Á vào thứ Năm. WTI giảm trong bối cảnh một số hoạt động chốt lời bất chấp xung đột leo thang ở Trung Đông.
Tác giả  FXStreet
7 tháng 30 ngày Thứ Năm
West Texas Intermediate (WTI), chuẩn dầu thô của Mỹ, đang giao dịch quanh mức 82,80$ trong đầu phiên giao dịch châu Á vào thứ Năm. WTI giảm trong bối cảnh một số hoạt động chốt lời bất chấp xung đột leo thang ở Trung Đông.
placeholder
Forex Today: Đồng yên Nhật lùi bước sau khi tăng mạnh nhờ nghi ngờ can thiệp, BoJ giữ nguyên chính sáchĐây là những gì bạn cần biết vào thứ Sáu, ngày 31 tháng 7:
Tác giả  FXStreet
7 tháng 31 ngày Thứ Sáu
Đây là những gì bạn cần biết vào thứ Sáu, ngày 31 tháng 7:
placeholder
Tổng thống Mỹ Donald Trump cho biết các cuộc đàm phán với Iran sẽ bắt đầu vào thứ Hai sau khi hủy bỏ cuộc tấn côngTổng thống Mỹ Donald Trump cho biết một vòng đàm phán mới với Iran sẽ bắt đầu vào thứ Hai sau khi ông hủy bỏ một cuộc tấn công đã lên kế hoạch nhằm vào Iran, một phần là để đáp lại những lời kêu gọi từ các đồng minh của Mỹ ở Trung Đông, bao gồm cả Saudi Arabia, Bloomberg đưa tin hôm thứ Hai
Tác giả  FXStreet
4 giờ trước
Tổng thống Mỹ Donald Trump cho biết một vòng đàm phán mới với Iran sẽ bắt đầu vào thứ Hai sau khi ông hủy bỏ một cuộc tấn công đã lên kế hoạch nhằm vào Iran, một phần là để đáp lại những lời kêu gọi từ các đồng minh của Mỹ ở Trung Đông, bao gồm cả Saudi Arabia, Bloomberg đưa tin hôm thứ Hai
sản phẩm liên quan
goTop
quote