


Ripple and Stellar outlook: XRP slips, XLM climbs on DTCC deal
- XRP extends its decline on Thursday, edging below the crucial support level near $1.30.
- XLM continues to gain momentum following the announcement of the DTCC partnership earlier this week.
- Derivatives data for both altcoins show mixed signals, suggesting caution.
Ripple (XRP) remains under pressure, extending its correction and trading below the $1.30 support on Thursday. Meanwhile, Stellar (XLM) continues its upside move after a bullish narrative following Wednesday's announcement of a partnership with the Depository Trust & Clearing Corporation (DTCC) and the Stellar Development Foundation. However, the derivatives metrics for both altcoins remain mixed, signaling caution and divided trader sentiment.
Stellar partnership with DTCC boosts token price
DTCC and the Stellar Development Foundation announced on Wednesday plans to enable the tokenization of DTC‑custodied assets on the Stellar network.
“This collaboration advances DTCC’s multi-chain strategy and expands how traditional assets move across digital ecosystems,” said DTCC’s X post.
The DTC‑tokenized assets are expected to be made available on the Stellar network in the first half of 2027, supporting the evolution of a more open, interoperable, and efficient financial ecosystem.
This announcement boosted the price of Stellar’s native token, XLM, which surged over 11% on Wednesday. XLM continues to trade higher on Thursday, up over 5%.
Derivatives metrics for XRP and XLM remain mixed
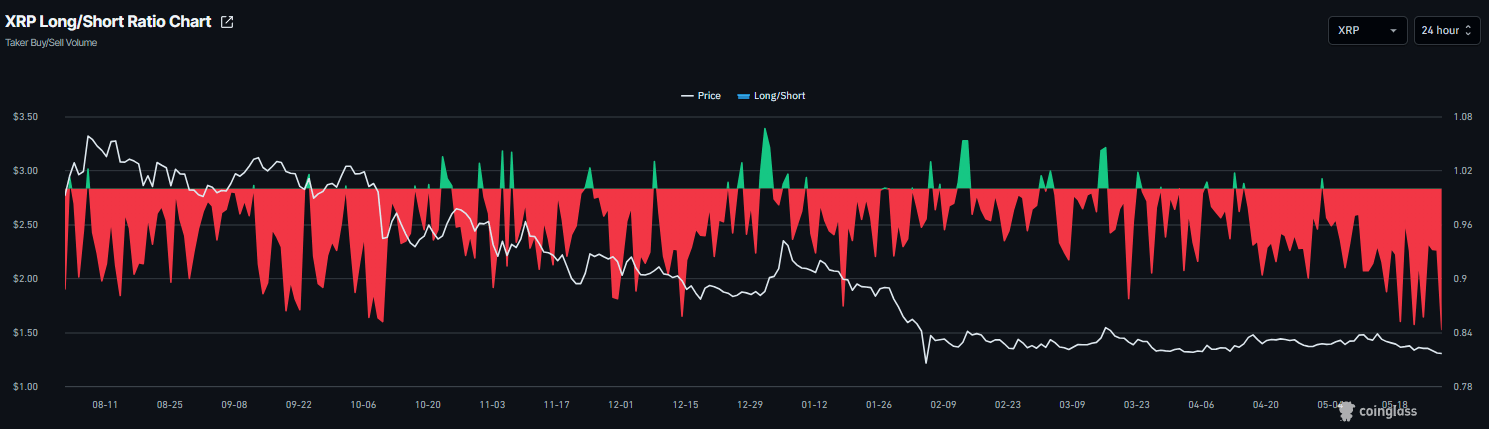
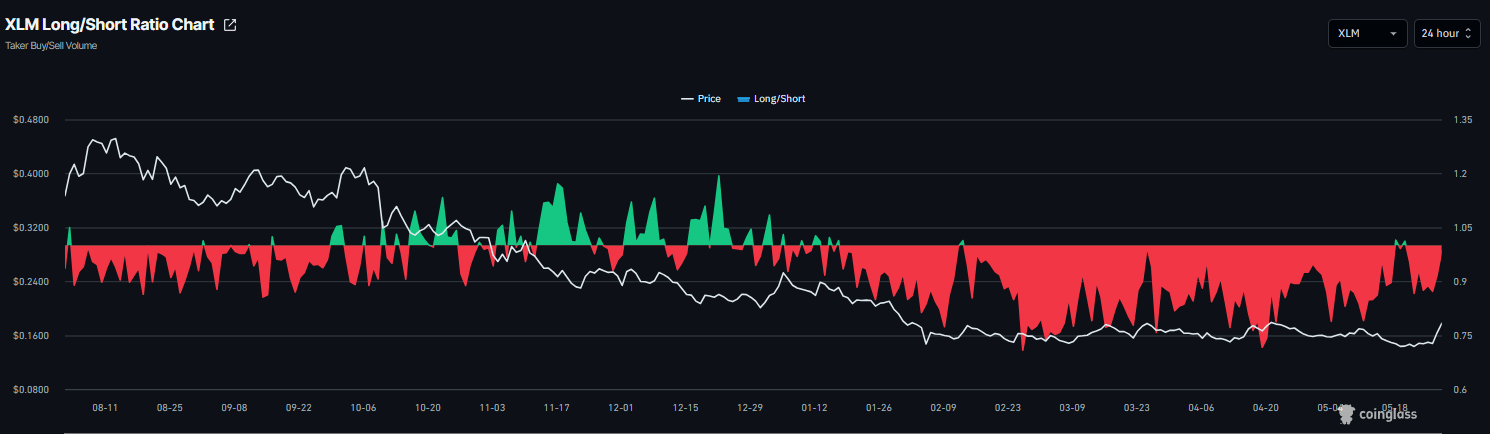
Derivatives data shows mixed sentiment with a slight bearish tilt. CoinGlass’ long-to-short ratio for both XRP and XLM reads 0.84 and 0.98, respectively, on Thursday. The ratio being below one, indicates bearish sentiment, as traders are betting the assets' prices will fall.
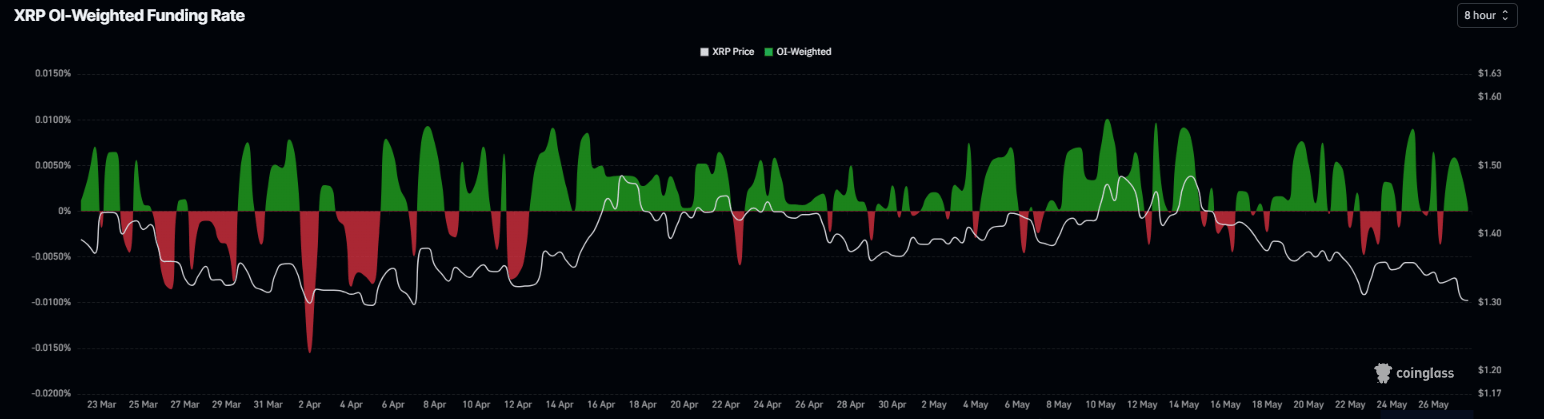
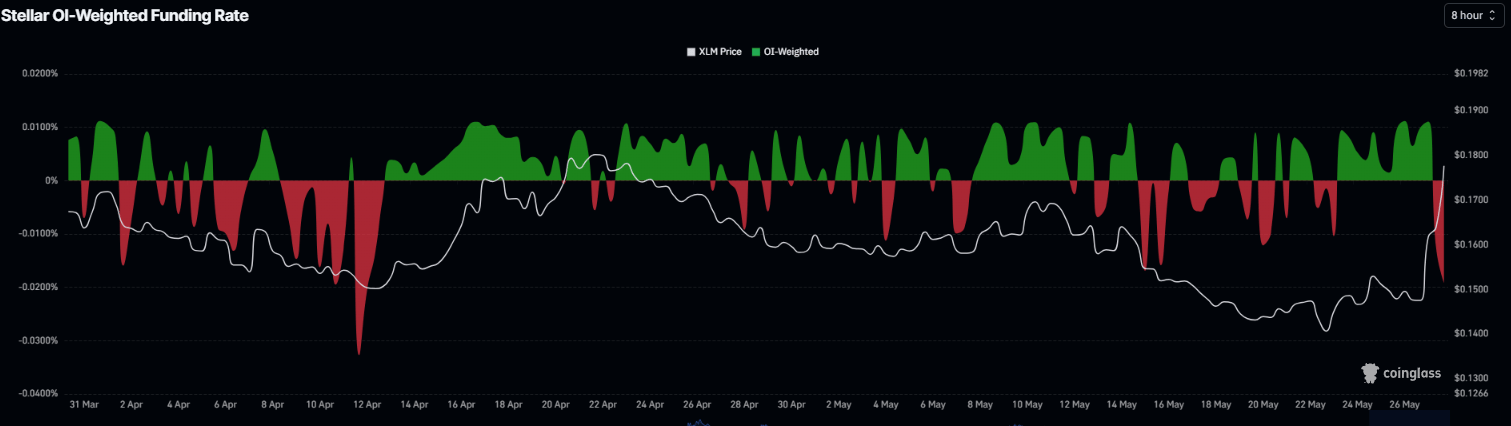
The funding rates also reflect a weakening outlook for both altcoins. XRP funding rates are about to flip to a negative rate on Thursday, while Stellar funding rates are drifting toward negative territory. These negative rates indicate that shorts are paying longs and project bearish sentiment.
XRP technical outlook: Slips below key support
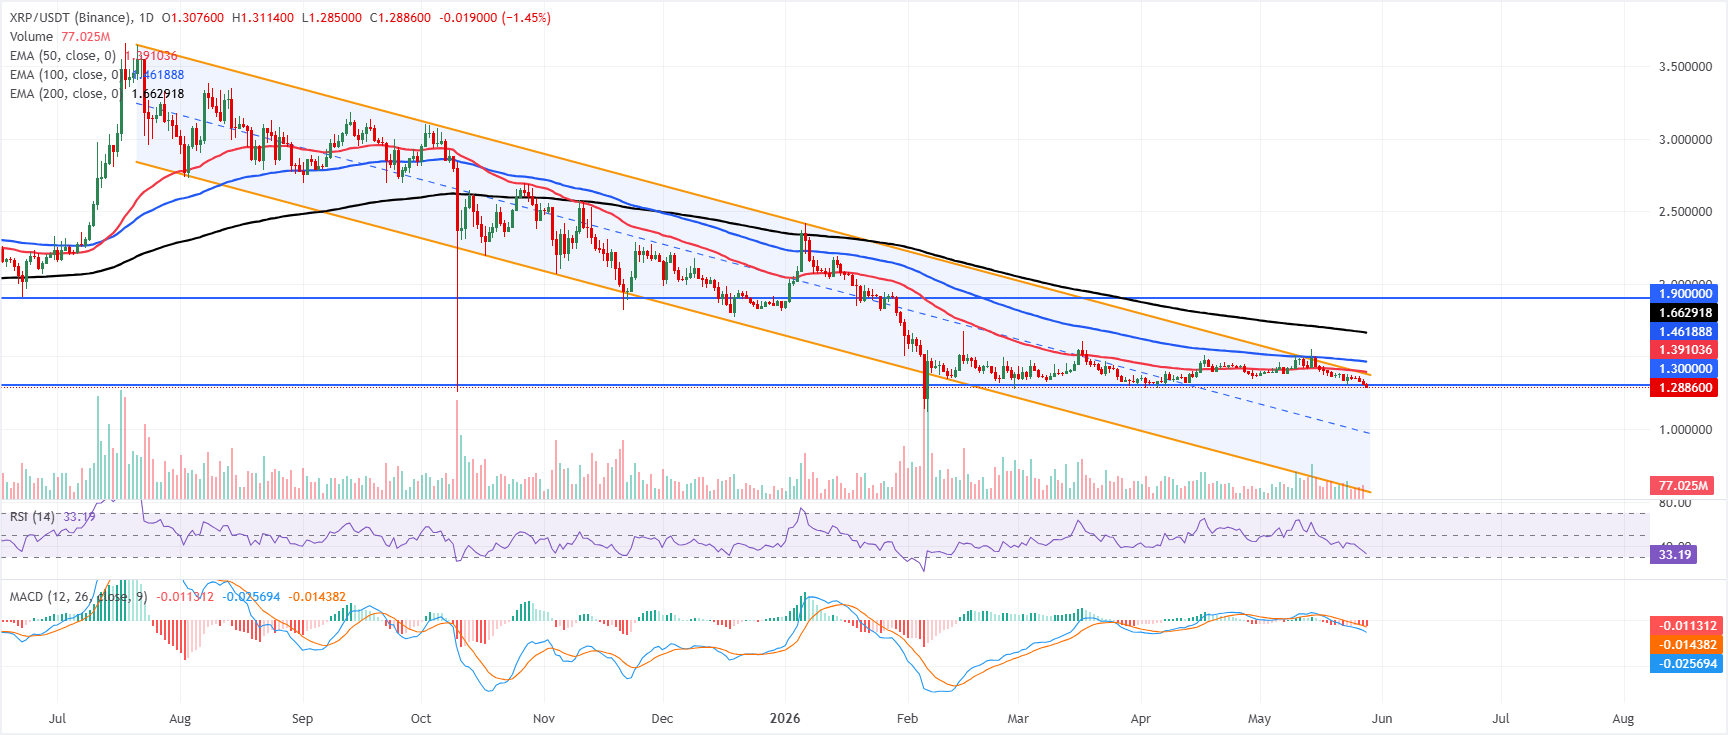
XRP trades at $1.28 on Thursday, slipping below the key horizontal support at $1.30. XRP is maintaining a clear bearish near-term tone as price holds below the 50-, 100-, and 200-day Exponential Moving Averages (EMAs), clustered from roughly $1.39 to $1.66. The altcoin also trades below the downward-sloping parallel channel cap near $1.38.
Meanwhile, the Relative Strength Index (RSI) hovers around 33, hinting at persistent downside pressure as conditions edge toward oversold territory. The Moving Average Convergence Divergence (MACD) indicator remains in negative territory, with the MACD line below its signal line, reinforcing a weak momentum backdrop despite the proximity of nearby resistance.
On the topside, initial resistance emerges at the prior horizontal barrier around $1.30, with the channel boundary near $1.38 and the 50-day EMA at $1.39 forming a broader capping zone if buyers attempt a bounce. Above there, the 100-day EMA at $1.46 and the distant 200-day EMA near $1.66 line up ahead of the longer-term horizontal resistance around $1.90, which together define successive hurdles that XRP would need to reclaim to alleviate the prevailing bearish bias.
XLM technical outlook: Looks promising
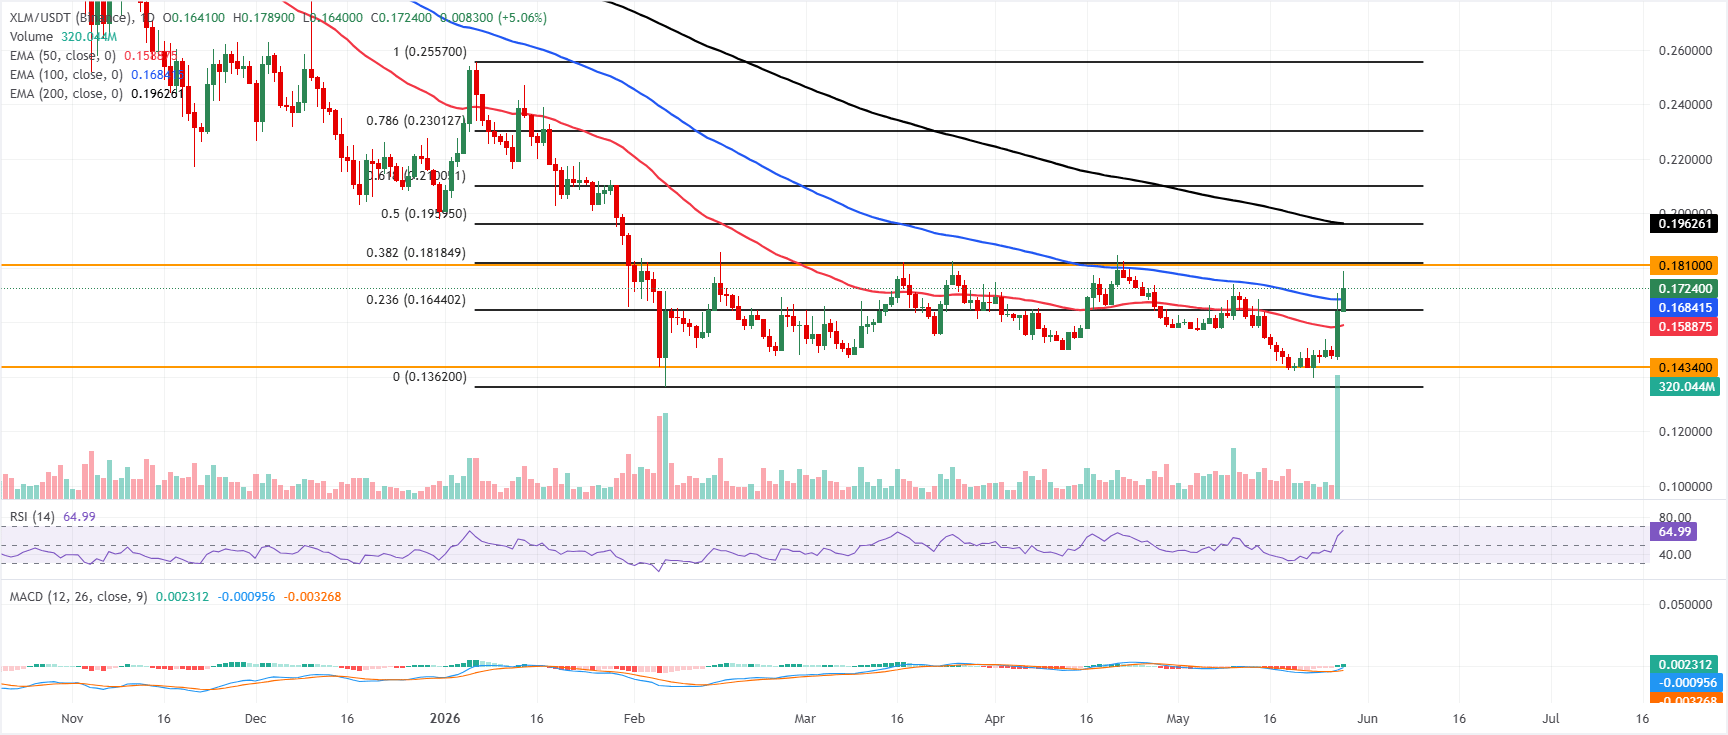
XLM trades at $0.172, attempting to build a constructive tone as it holds above the 100-day EMA near $0.168 and the 50-day EMA around $0.158, while still trading below the 200-day EMA at roughly $0.196, which continues to cap the broader recovery.
Momentum has improved, with the RSI hovering near 65 and the MACD line turning positive, suggesting buyers retain the upper hand in the near term as long as price stays supported by these underlying averages.
On the topside, initial resistance aligns with the horizontal barrier at $0.181, closely followed by the 38.2% Fibonacci retracement at about $0.181, forming a tight supply zone. A clearance of that area would expose the 50% retracement at $0.195 and the 200-day EMA at $0.196, before the higher Fibonacci levels at $0.210 and $0.230 come into play.
On the downside, immediate support is seen at the 100-day EMA around $0.168, reinforced by the 23.6% Fibonacci retracement near $0.164; a break below there would shift focus toward the 50-day EMA at $0.158 and then the broader structural floor between the horizontal support at $0.143 and the Fibonacci anchor low at $0.136.
(The technical analysis of this story was written with the help of an AI tool.)
Bài viết đề xuất


