


Ethereum Weekly Price Forecast: Easing geopolitical pressure pushes ETH above $2,400
Ethereum price today: $2,420
- ETH has climbed above $2,400 after Iran announced the reopening of the Strait of Hormuz.
- The move follows six consecutive days of net inflows into spot ETH ETFs.
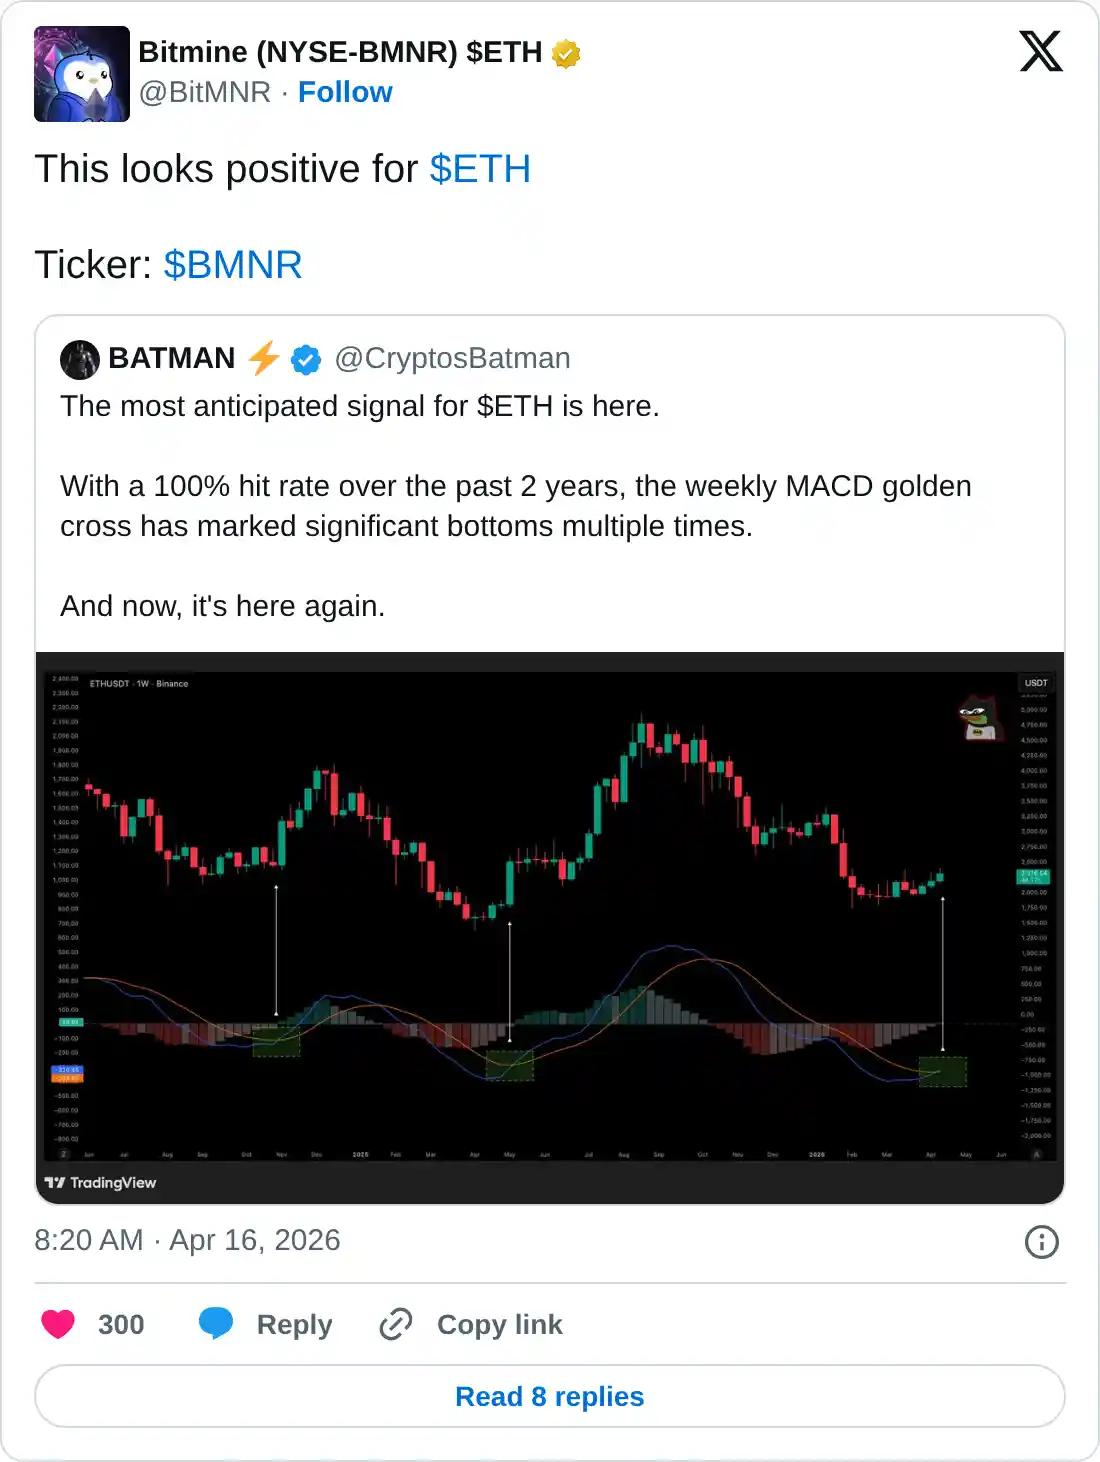
- ETH's weekly MACD crossover hints at a price bottom.
Ethereum (ETH) surged above $2,400 on Friday, driven by positive developments in the US-Iran ceasefire negotiations. Iran announced that it has opened the Strait of Hormuz after President Trump confirmed that the US would prohibit Israel from attacking Lebanon.
"In line with the ceasefire in Lebanon, the passage for all commercial vessels through Strait of Hormuz is declared completely open for the remaining period of ceasefire, on the coordinated route as already announced by Ports and Maritime Organisation of the Islamic Rep. of Iran," the country's Foreign Minister Abbas Araghchi noted in an X post on Friday.
With the latest move, ETH is well above its realized price or onchain average cost basis at $2,308, potentially establishing the level as support even as geopolitical tensions ease.
This also comes at a time when US spot ETH exchange-traded funds (ETFs) have posted six consecutive days of net inflows totaling $298.4 million, per SoSoValue data. While the figure is quite modest compared to inflows observed in strong bullish seasons, it signals a gradual return of institutional interest.
Meanwhile, Ethereum treasury firm BitMine Immersion (BMNR) highlighted a post from an analyst noting that the Moving Average Convergence Divergence (MACD) on the ETH weekly chart has posted a golden cross. The move marked a price bottom for ETH in November 2024 and May 2025.
On the derivatives front, open interest in ETH has also climbed to 14.67 million ETH, but funding rates have plunged deeper, indicating that short traders are rapidly opening positions in anticipation of a pause in the uptrend.
Ethereum Price Forecast: ETH clears 100-day EMA and $2,388 resistance
Ethereum has seen roughly $163.2 million in liquidations over the past 24 hours, driven by $140.9 million in short liquidations, according to Coinglass data.
In the daily chart, ETH has flipped the 100-day Exponential Moving Average (EMA) at $2,378 and the $2,388 resistance, after testing those levels consistently over the past five days.
The level now serves as immediate support, while deeper pullbacks may attract bids around the 20-day EMA at $2,234 and the $2,211–$2,199 area defined by horizontal support and the 50-day EMA.
On the topside, initial resistance emerges at the horizontal barrier near $2,746, ahead of a stronger cap at $3,411, where a break would open the door to an extension of the prevailing uptrend.
Momentum readings back the constructive tone, with the 14-day Relative Strength Index (RSI) hovering in bullish territory near 65 and the Stochastic Oscillator (Stoch) deeply in overbought ground, suggesting buyers remain in control even as the rally risks becoming stretched.
(The technical analysis of this story was written with the help of an AI tool.)
Bài viết đề xuất


