

Top Crypto Gainers: LayerZero surges on Cathie Wood joining, Pippin and Aster steady after rally
- LayerZero gains over 30% on Wednesday as Ark Invest’s CEO Cathie Wood joins the advisory board.
- Pippin edges higher by nearly 5% following Tuesday’s 43% rally, extending its U-shaped reversal.
- Aster approaches a crucial resistance zone after an 8% jump the previous day.
LayerZero (ZRO), Pippin (PIPPIN) and Aster (ASTER) post double-digit gains in the last 24 hours, beating the broader cryptocurrency market trend. LayerZero rallies on Ark Invest’s CEO, Cathie Wood, joining the advisory board, while Aster approaches a crucial resistance zone amid chances of a Golden Cross pattern on the 4-hour timeframe. Technically, ZRO and ASTER are close to their resistance levels, while PIPPIN shows room on the upside as bullish momentum builds among top gainers.
LayerZero rallies on Cathie Wood entering the advisory board
LayerZero is up over 30% at press time on Wednesday, bouncing off the 200-day Exponential Moving Average (EMA) at $1.80 as ARK Invest CEO Cathie Wood joined its advisory board. According to Cathie Wood, LayerZero could be a core innovation platform to support the multi-decade shift of bringing traditional finance on-chain.

ZRO token has surpassed the 78.6% Fibonacci retracement level at $2.28, measured from the October 7 high at $2.59 to the November 21 low at $1.16. A decisive close above $2.28 would likely extend this rally toward $2.59, while the next resistance is at the 1.272 Fibonacci extension at $2.97.
The Relative Strength Index (RSI) on the daily chart is at 68, indicating significant buying pressure and approaching the overbought zone. At the same time, the Moving Average Convergence Divergence (MACD) crosses above its signal line, presenting a bullish crossover. This indicates renewed bullish momentum, increasing the possibility of an extended rally.
On the other hand, the upward slope of the 50-day EMA as it approaches the 200-day EMA increases the likelihood of a golden crossover, which would confirm a bullish trend reversal on the daily time frame.
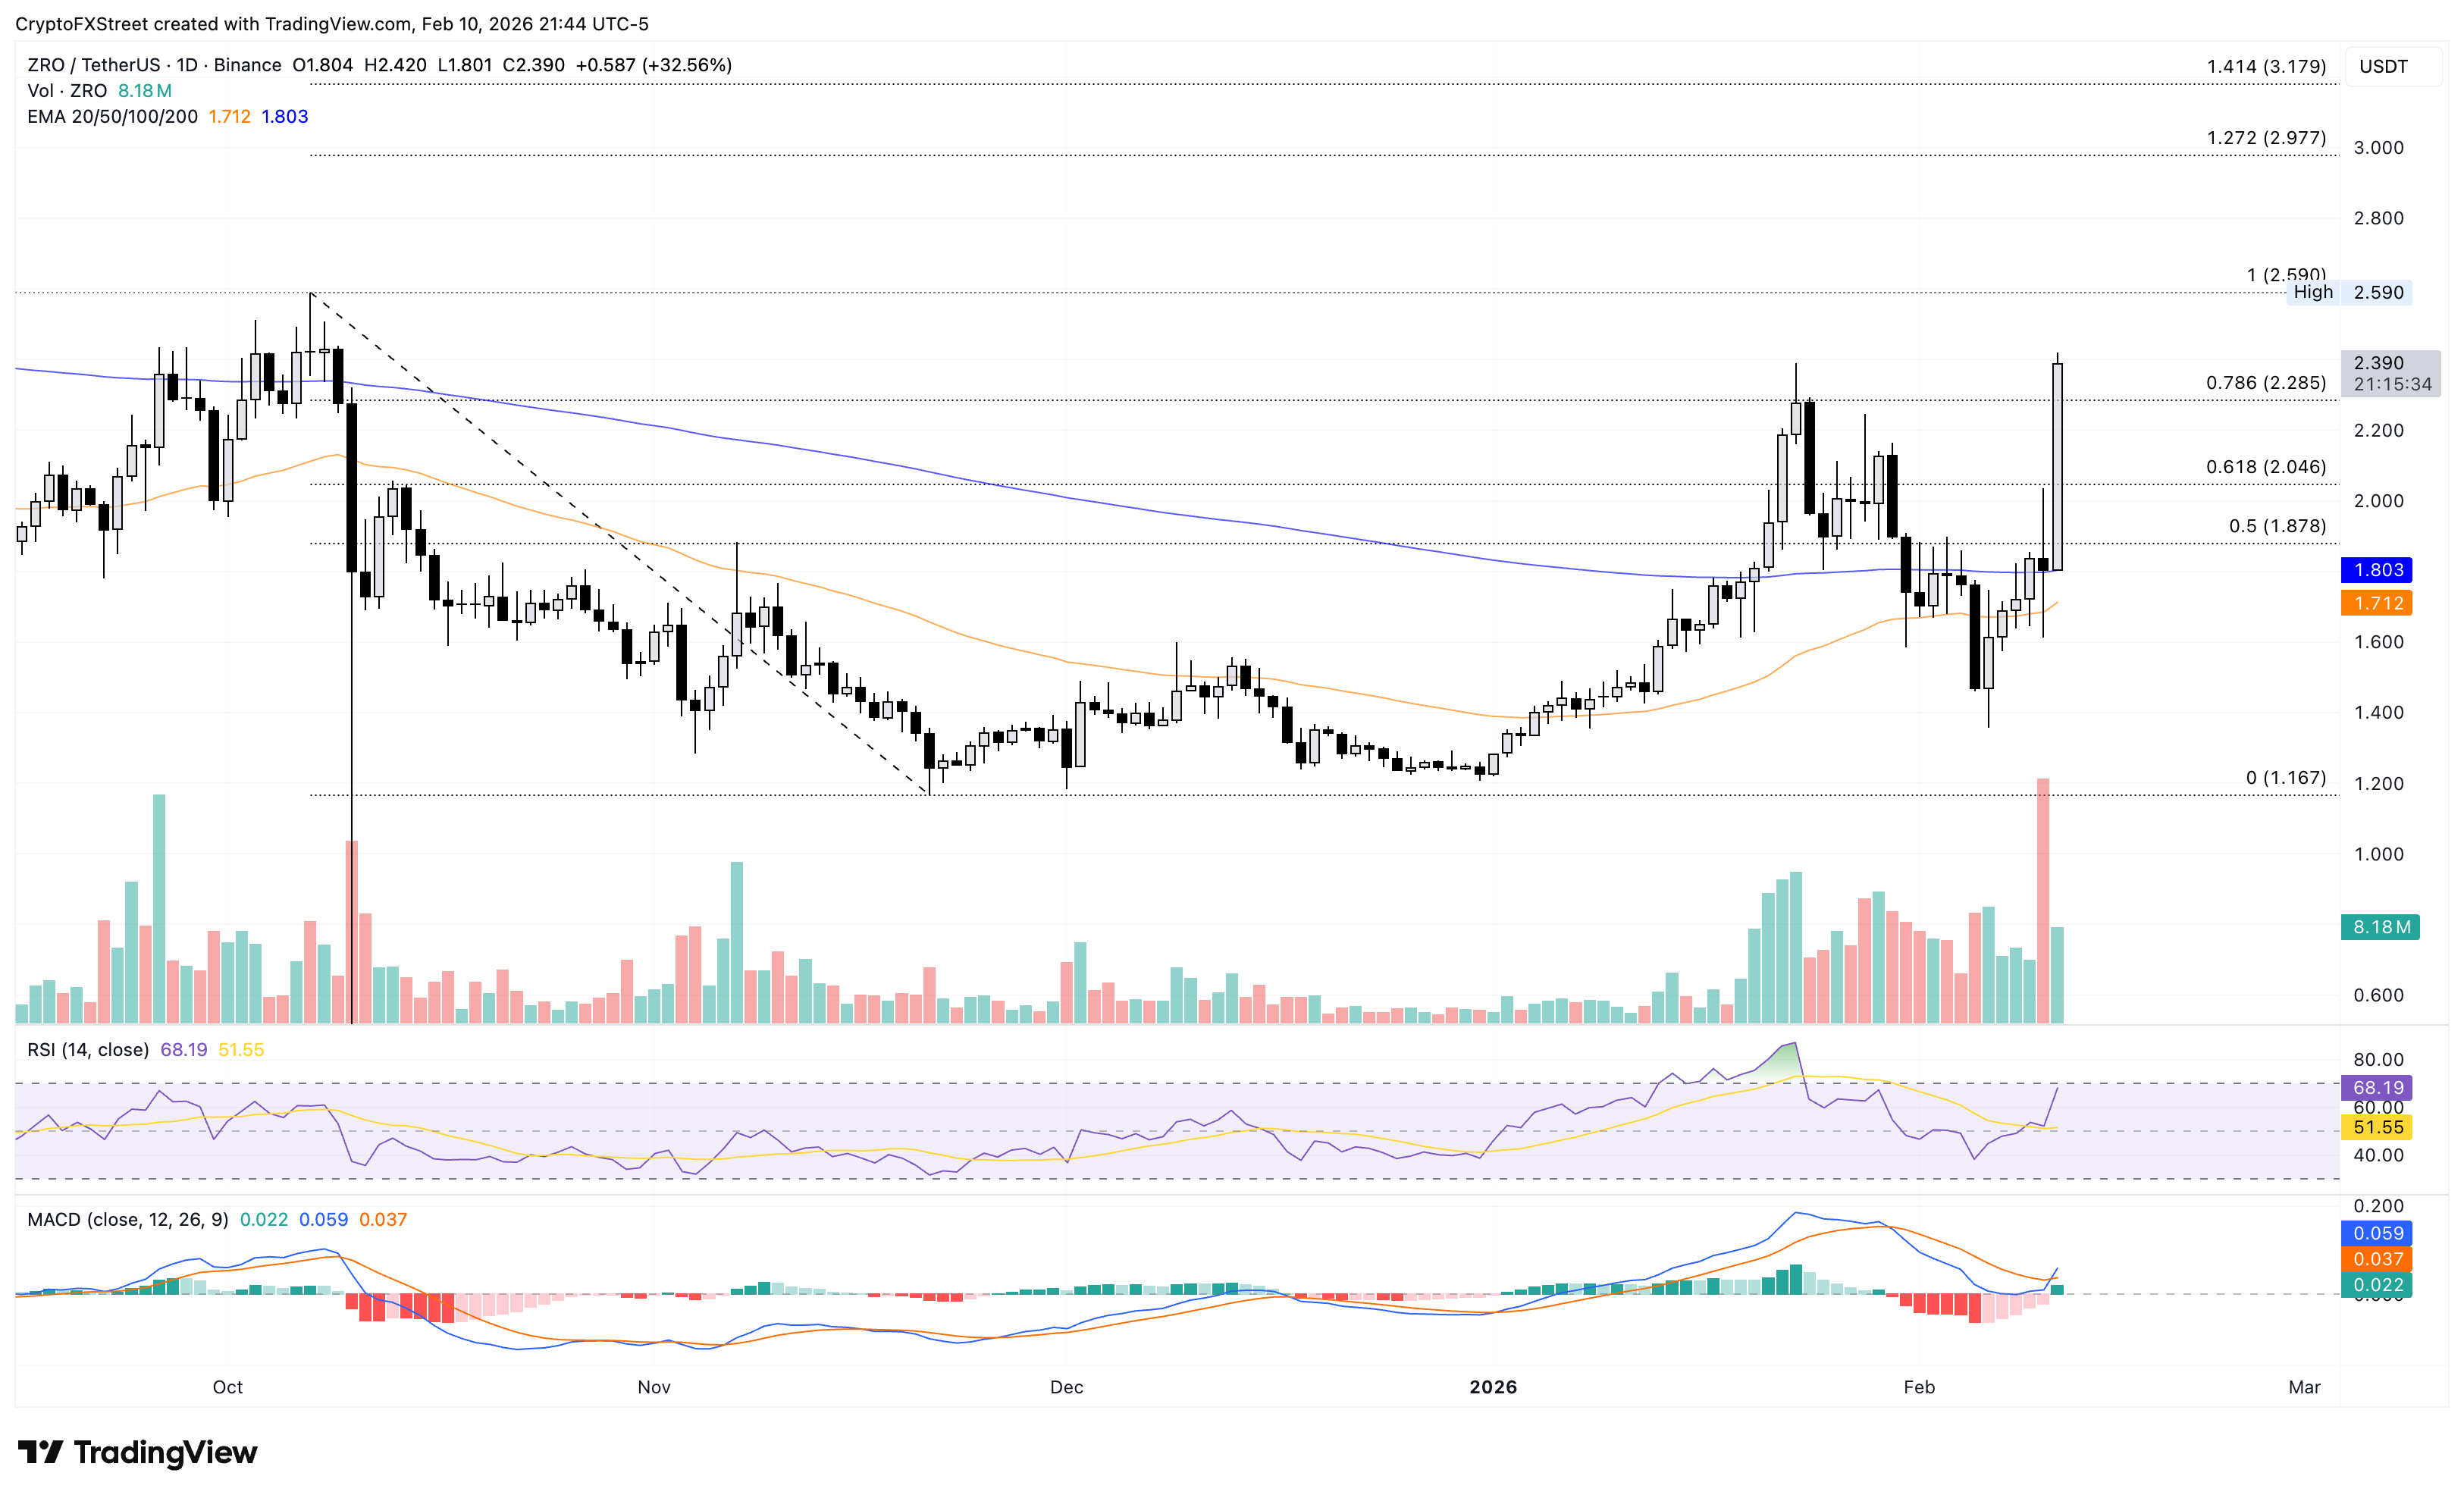
However, if ZRO fails to sustain a daily close above $2.28, it would indicate significant overhead pressure and could push it toward the 61.8% Fibonacci retracement at $2.046.
Pippin extends recovery on renewed bullish momentum
PIPPIN is up roughly 40% so far this week, extending its 55% gains from the previous week. At the time of writing, PIPPIN is up nearly 5% on Wednesday, building gains on its 43% rally from the previous day.
A U-shaped reversal on the daily chart, emerging from the 200-day EMA at $0.1833, approaches a crucial resistance at $0.4558, aligning with the December 18 high. A decisive close above this level could likely test the $0.5630 marked by the December 25 high.
The RSI at 61 rises above the halfway line, signaling increased buying pressure. Additionally, the MACD extends its bullish crossover from Sunday, with the histogram now above the zero line.
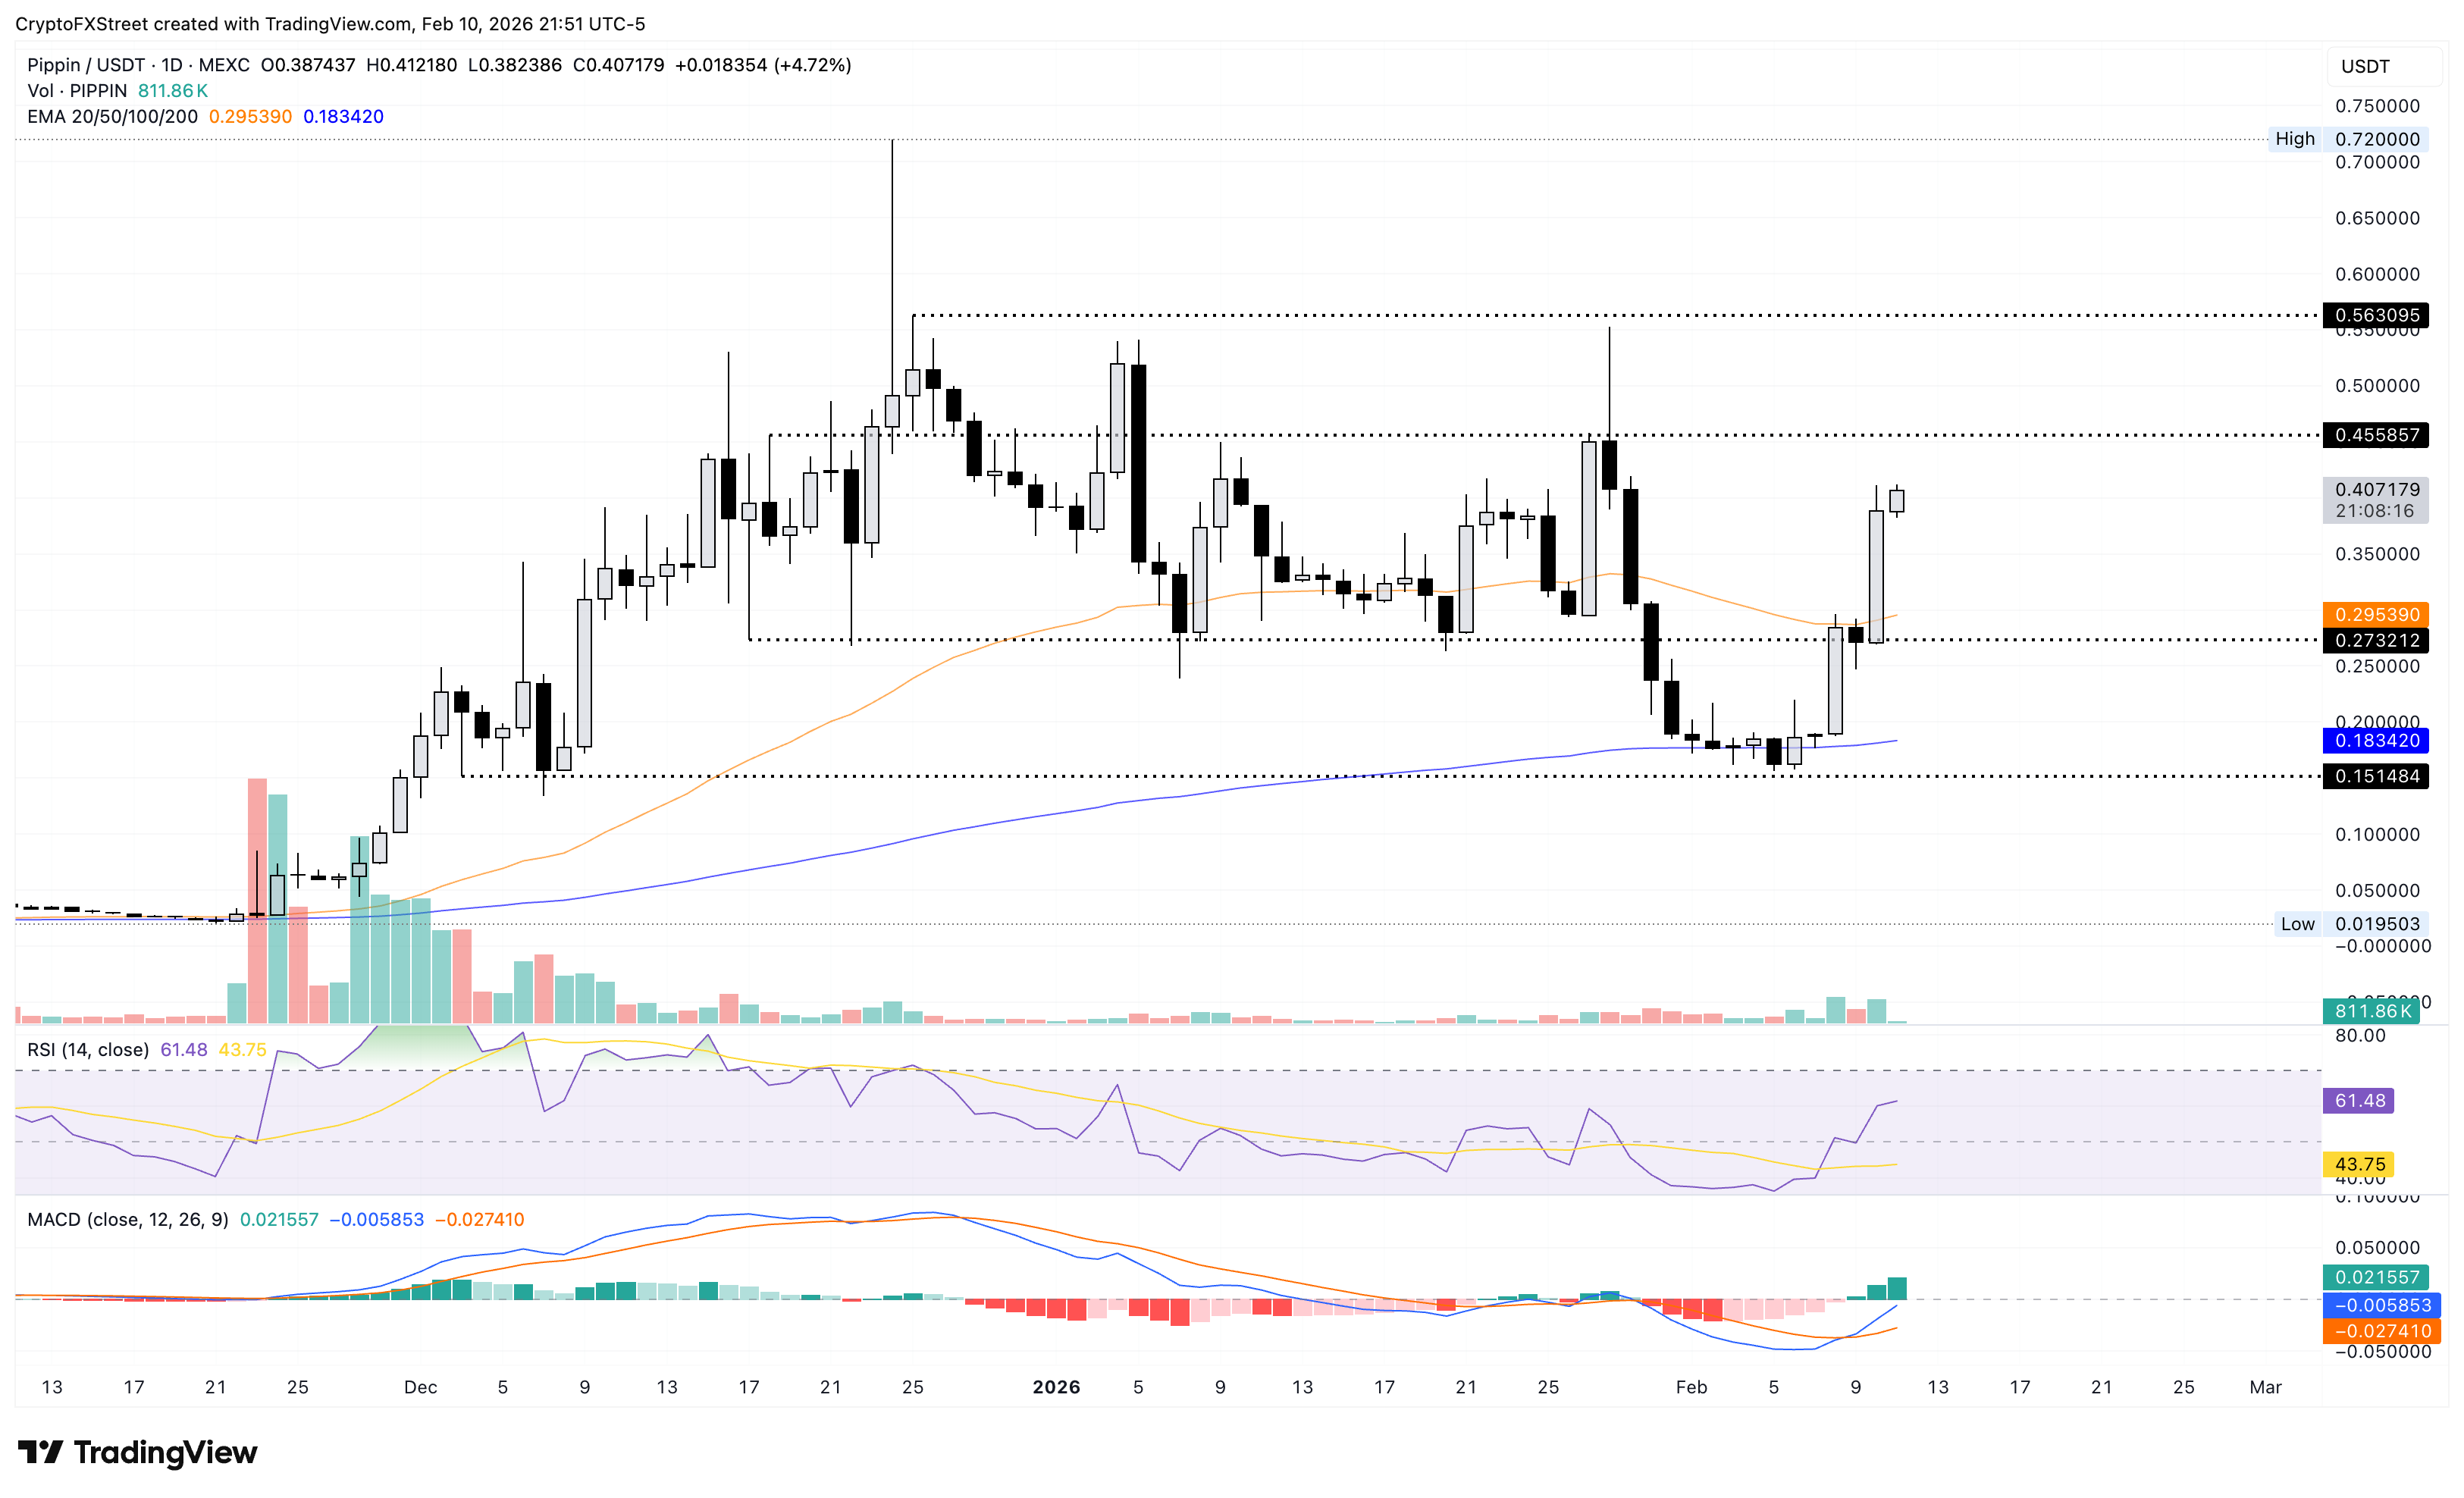
However, a reversal in Pippin could find support at the 50-day EMA at $0.2953.
Aster risks a drop below a crucial moving average
Aster holds steady above its 200-period EMA on the 4-hour chart at $0.638 at press time on Wednesday, following its 8% recovery the previous day. The upward slope and the 50-day EMA approaching the 200-day EMA signal a bullish bias and the possibility of a golden crossover if the uptrend sustains.
The immediate resistance for Aster lies between $0.711 and the R1 pivot point at $0.718. A decisive close above this range could boost the rally to the R2 pivot point at $0.812.
The RSI at 64 indicates intense buying pressure, while the MACD and signal line remain in an upward trend above the zero line. However, the downward-sloping RSI signals a bearish divergence as Aster forms a higher high, while the contracting MACD histogram indicates a risk of a bearish crossover.
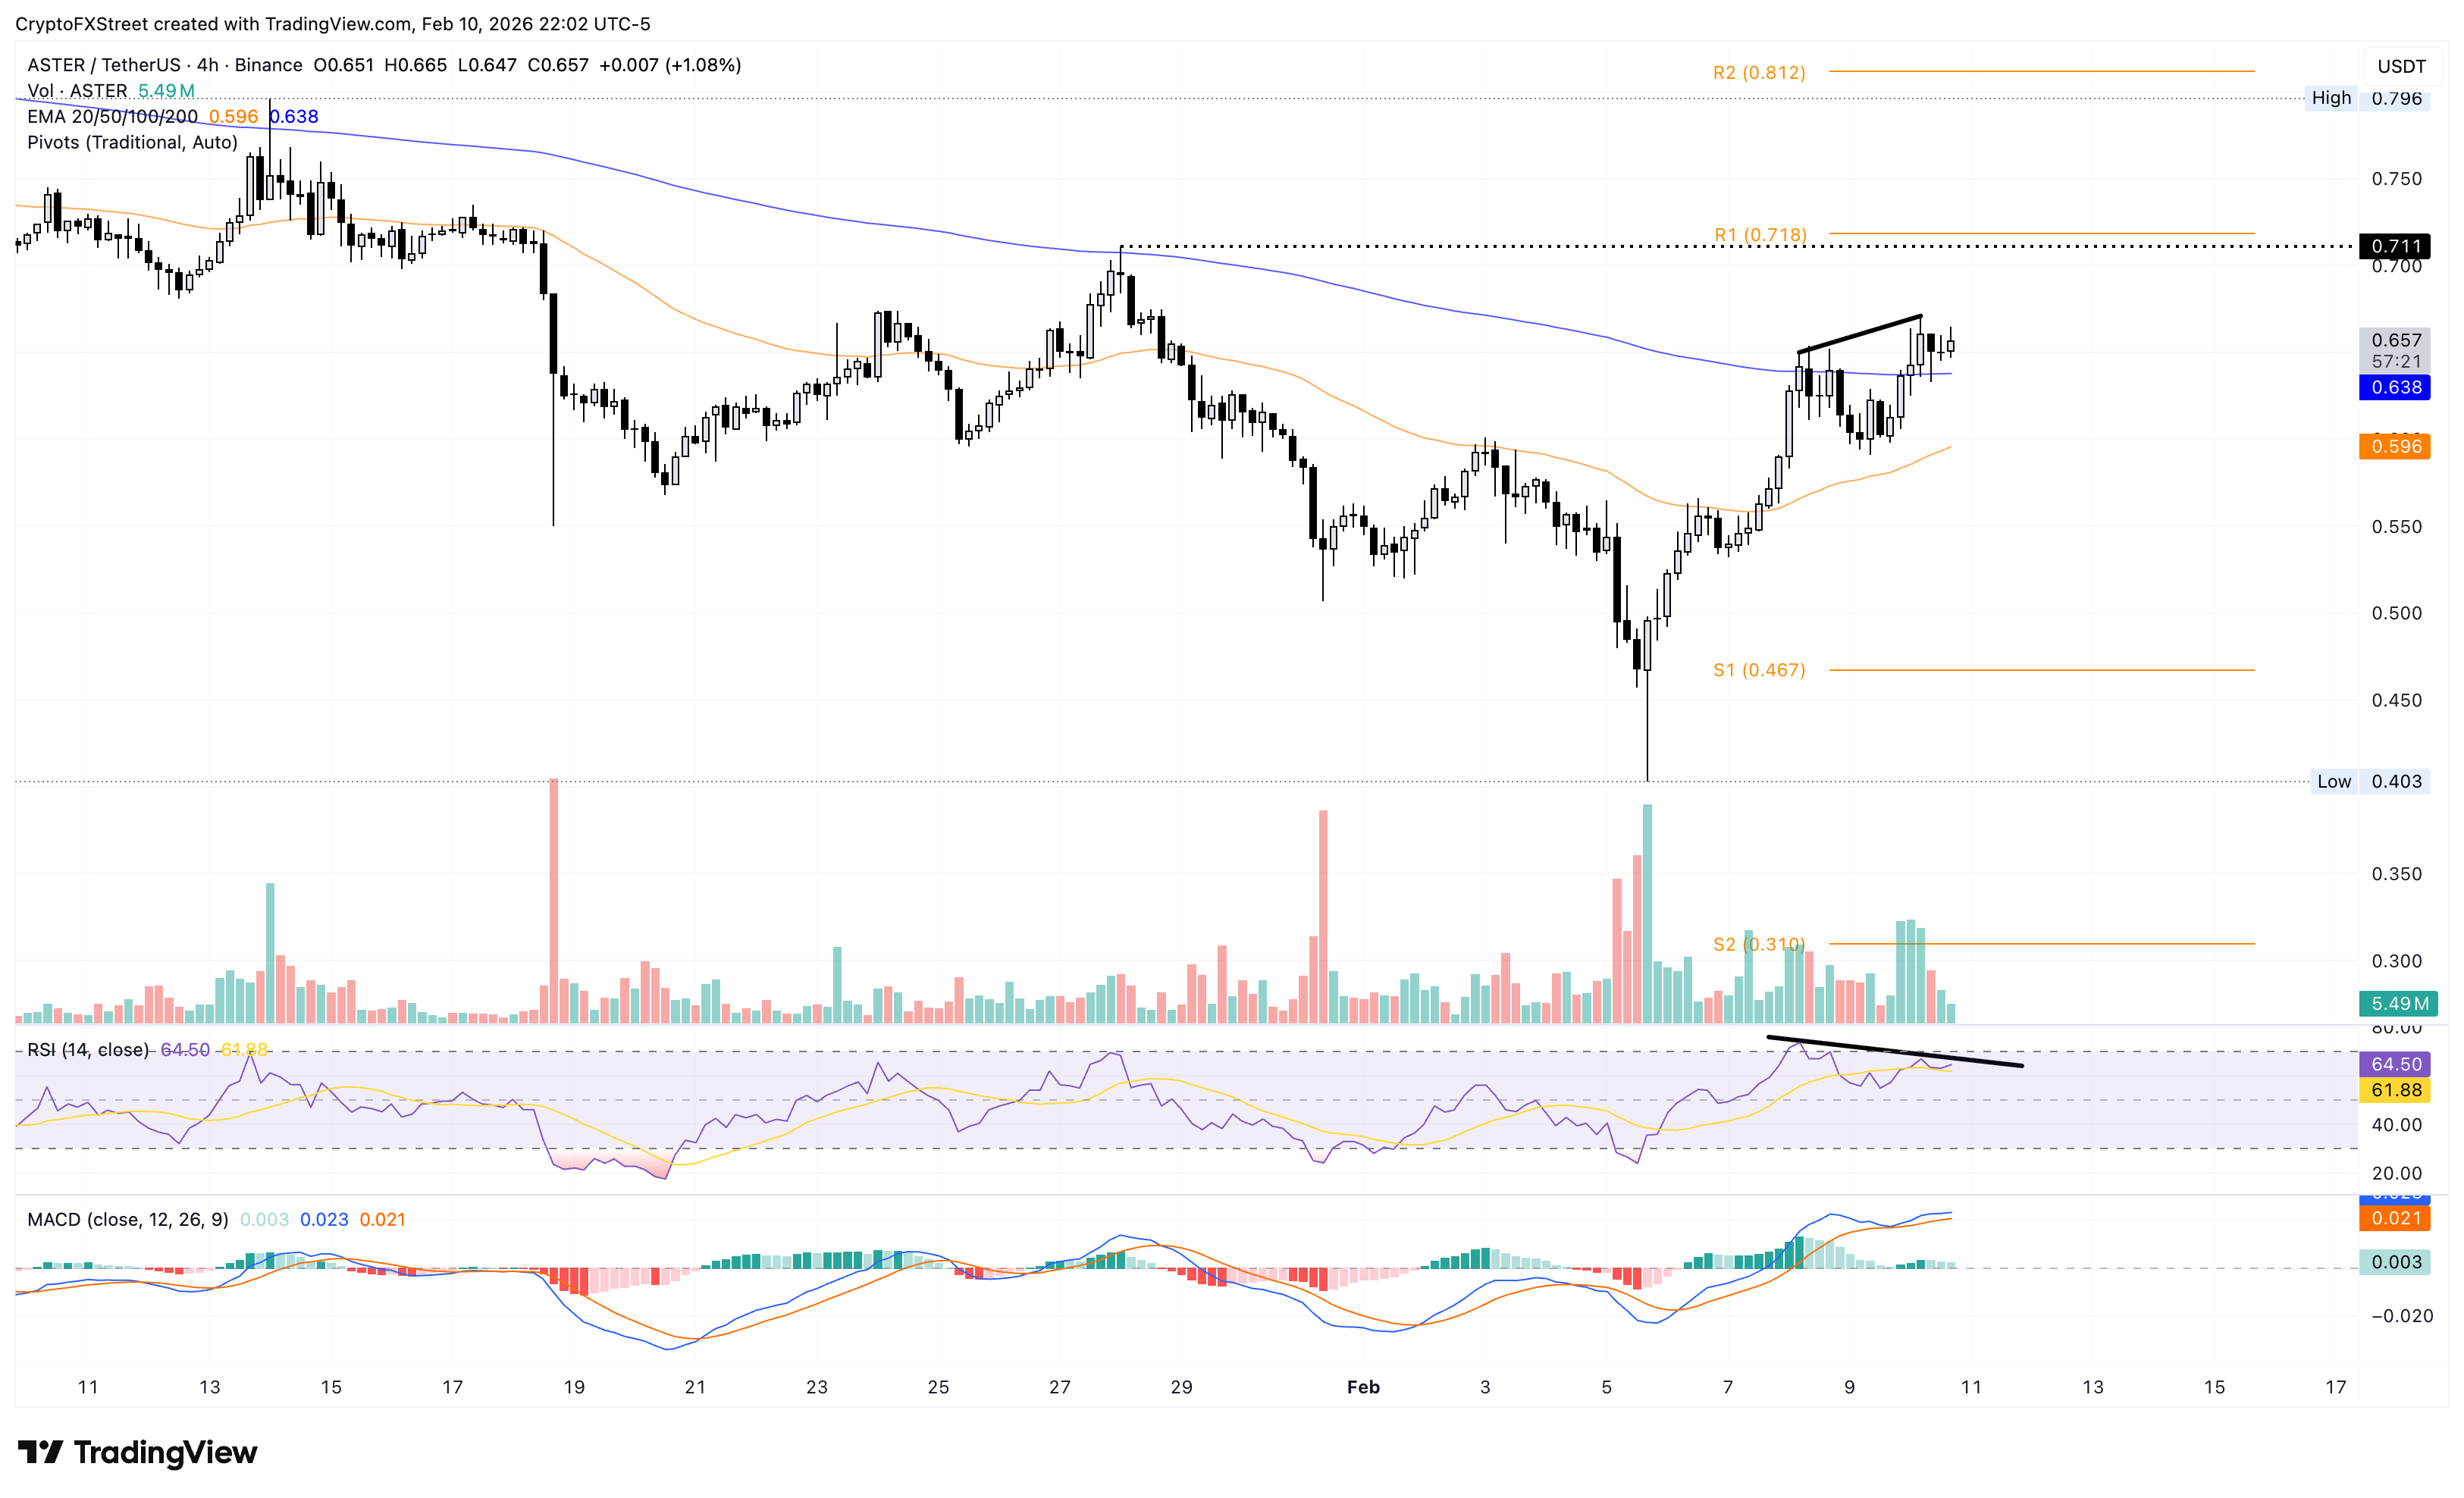
If Aster drops below the 200-day EMA and $0.638, it could test the 50-day EMA at $0.596, followed by a deeper support zone at the S1 pivot point at $0.467.
Bài viết đề xuất


