

Crypto Today: Crypto market holds $2.4 trillion as bearish sentiment persists around Bitcoin, Ethereum, XRP
- The cryptocurrency market cap drops by 10% to $2.4 trillion in February, undermining investor sentiment.
- Bitcoin declines for a second consecutive day, trading around $69,000 despite inflows into spot ETFs.
- Ethereum sellers are tightening their grip, with the price delicately holding $2,000 immediate support.
- XRP remains largely in bearish hands, weighed down by weak technicals, including an extended MACD sell signal.
The cryptocurrency market is trading under pressure at the time of writing on Tuesday, weighed down by risk-off sentiment. The Crypto King, Bitcoin (BTC), is constrained below $70,000, with the price holding around $69,000. Altcoins, including Ethereum (ETH) and Ripple (XRP), exhibit technical weakness but are holding above key support levels at $2,000 and $1.40, respectively.
Crypto sell-off persists as market cap drops 10%
The crypto sector has been in an overall downtrend since Bitcoin hit its record high of $126,199 on October 6, when total market capitalisation rose to $4.38 trillion.
The October 10 crash significantly dampened sentiment, making it difficult to sustain recovery, while the Federal Reserve (Fed) decision to pause its monetary policy easing cycle in late January accelerated the sell-off.
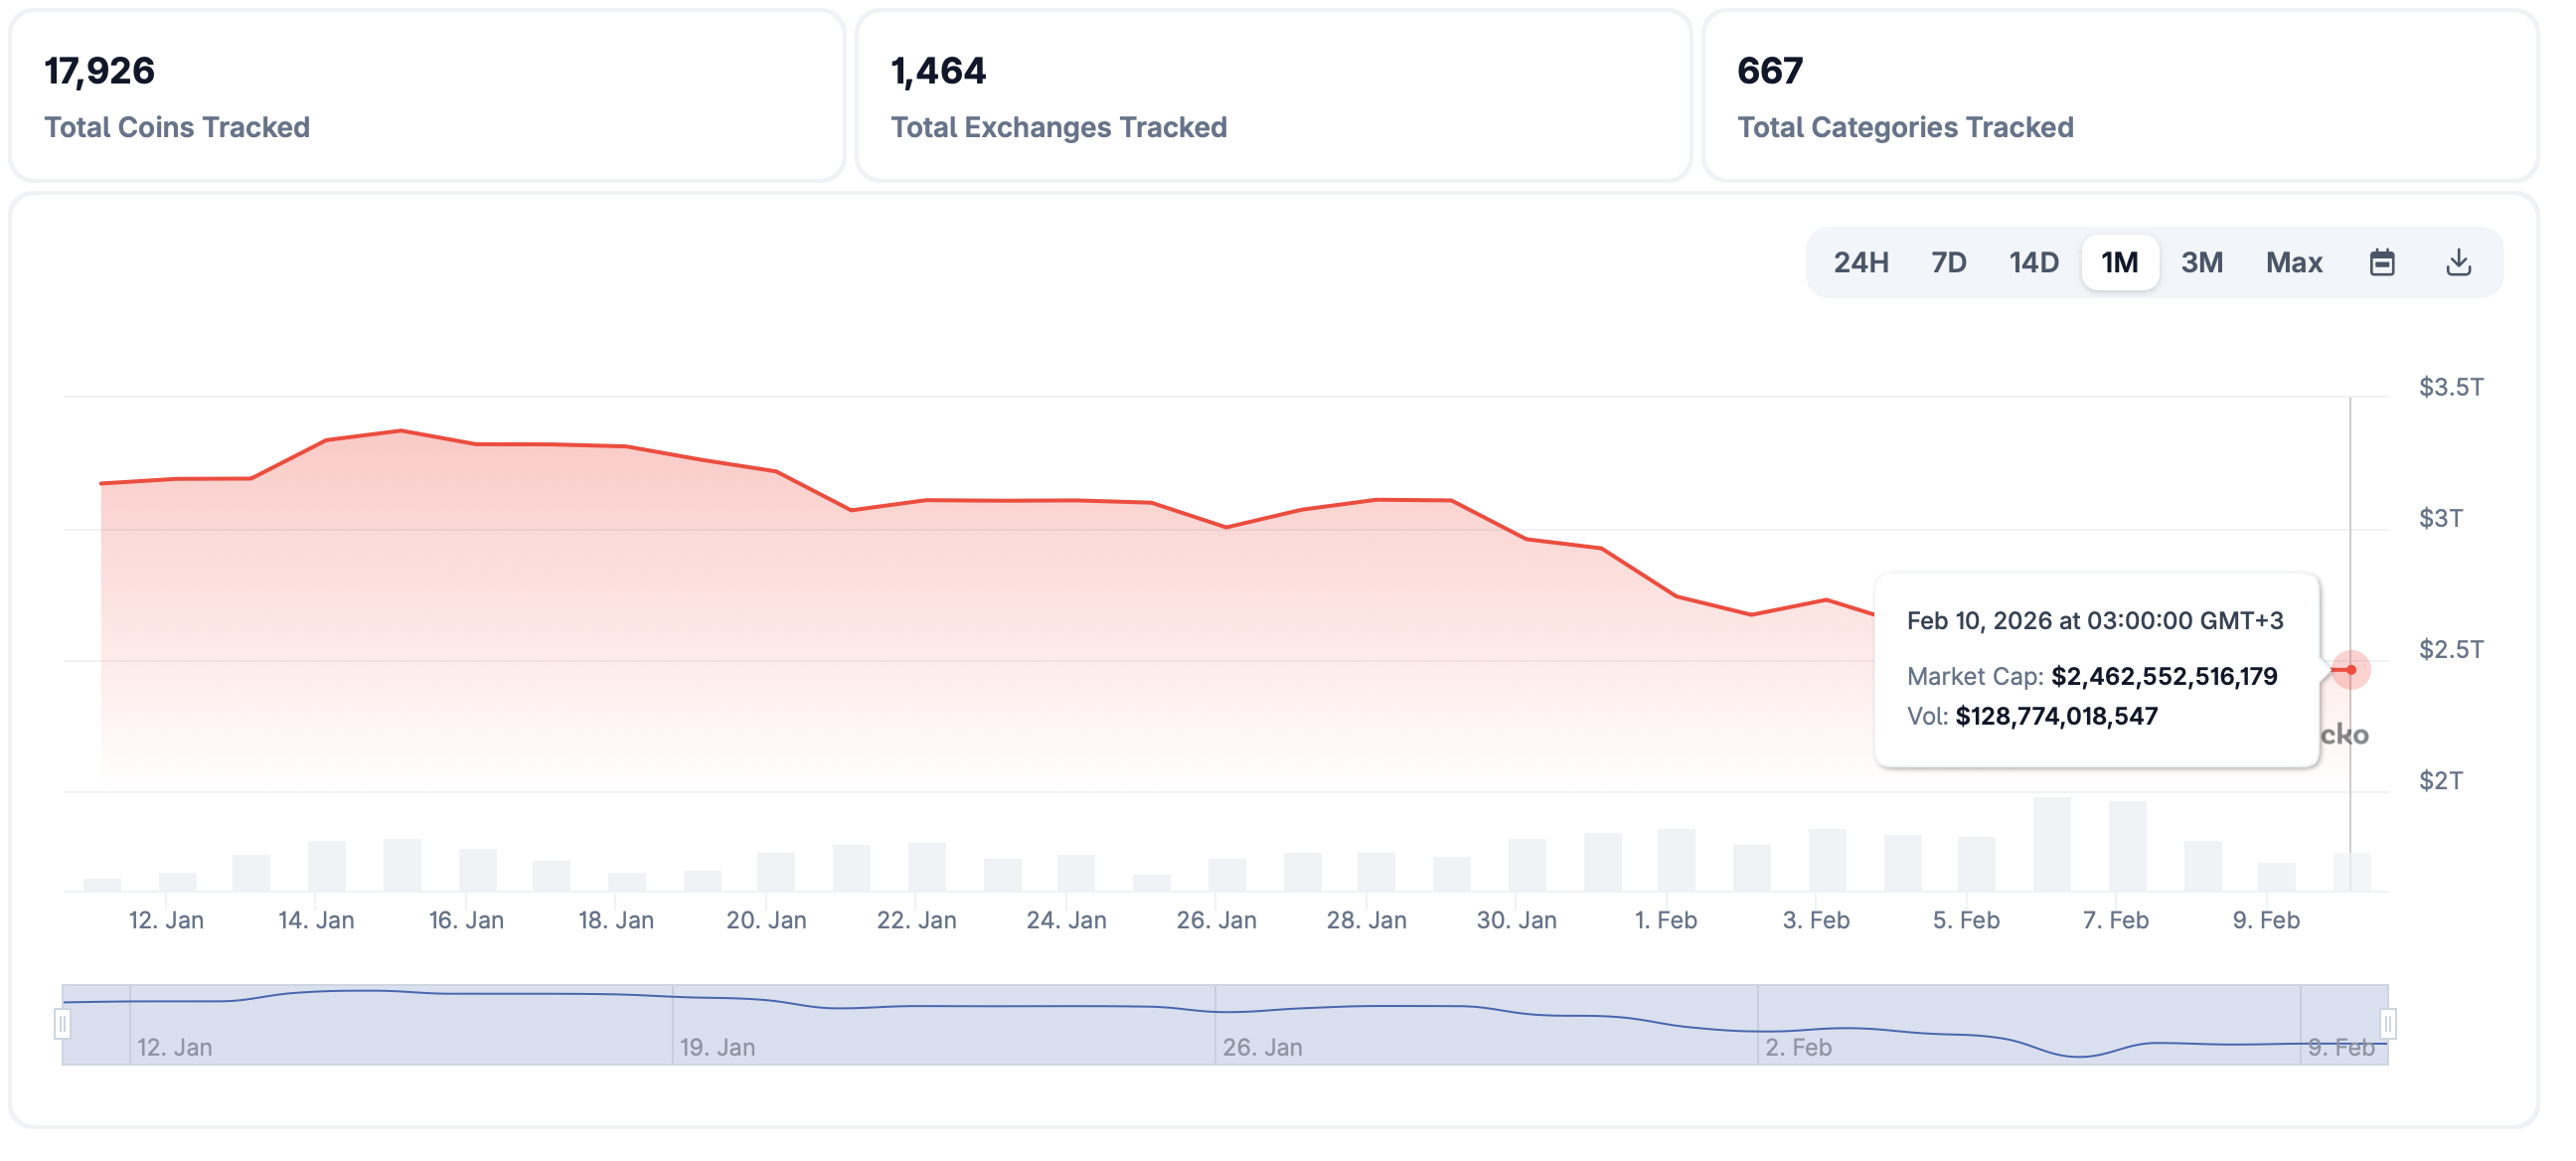
In February alone, the crypto market capitalisation is down approximately 10% to $2.4 trillion from $2.74 trillion, undermining investor sentiment. Meanwhile, Bitcoin plummeted, testing the $60,000 level on Friday before briefly rebounding above $70,000.
Bitcoin, Ethereum and XRP attract institutional interest
Institutional investors continue to show interest in Bitcoin, Ethereum and XRP spot Exchange-Traded Funds (ETFs), as evidenced by inflows recorded on Monday.
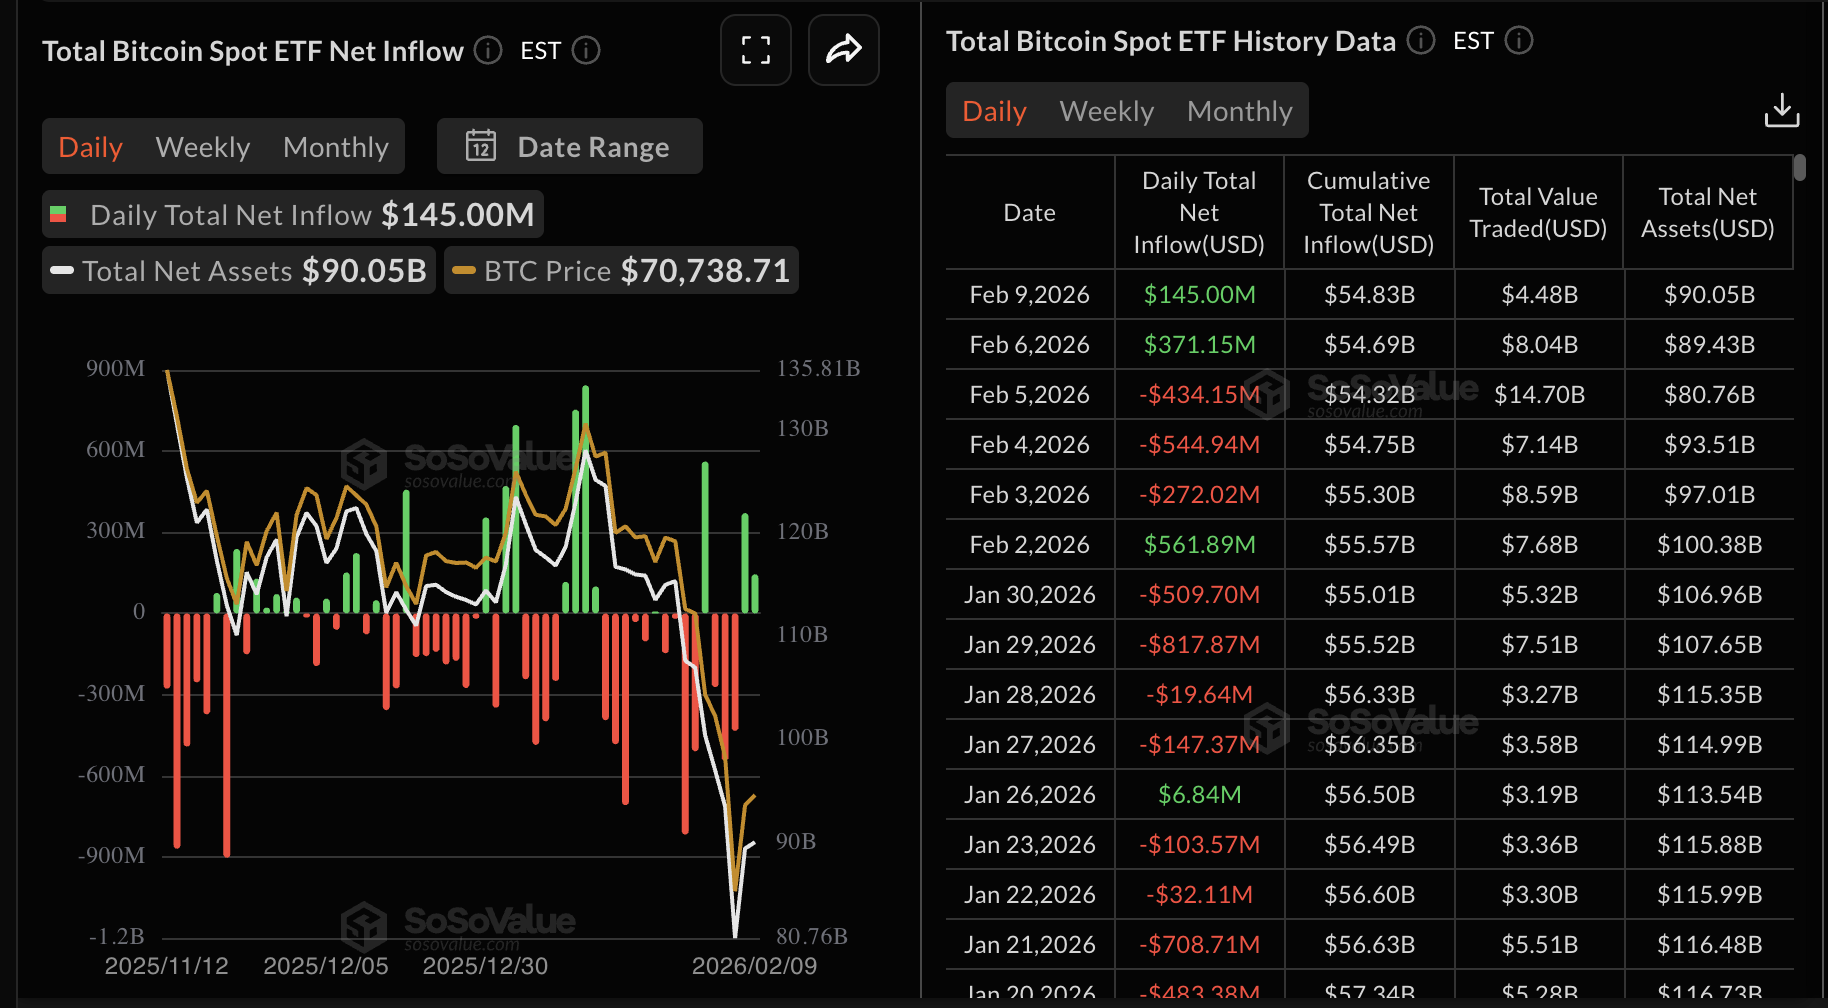
US-listed Bitcoin spot ETFs extended a two-day inflow streak, drawing $145 million from investors on Monday. According to SoSoValue data, $371 million inflows were recorded on Friday.
The cumulative inflow stands at $54.83 billion, with total net assets under management at $90.05 billion. Extending the inflow streak in the coming days would back positive sentiment and increase the odds of Bitcoin rising above $70,000.
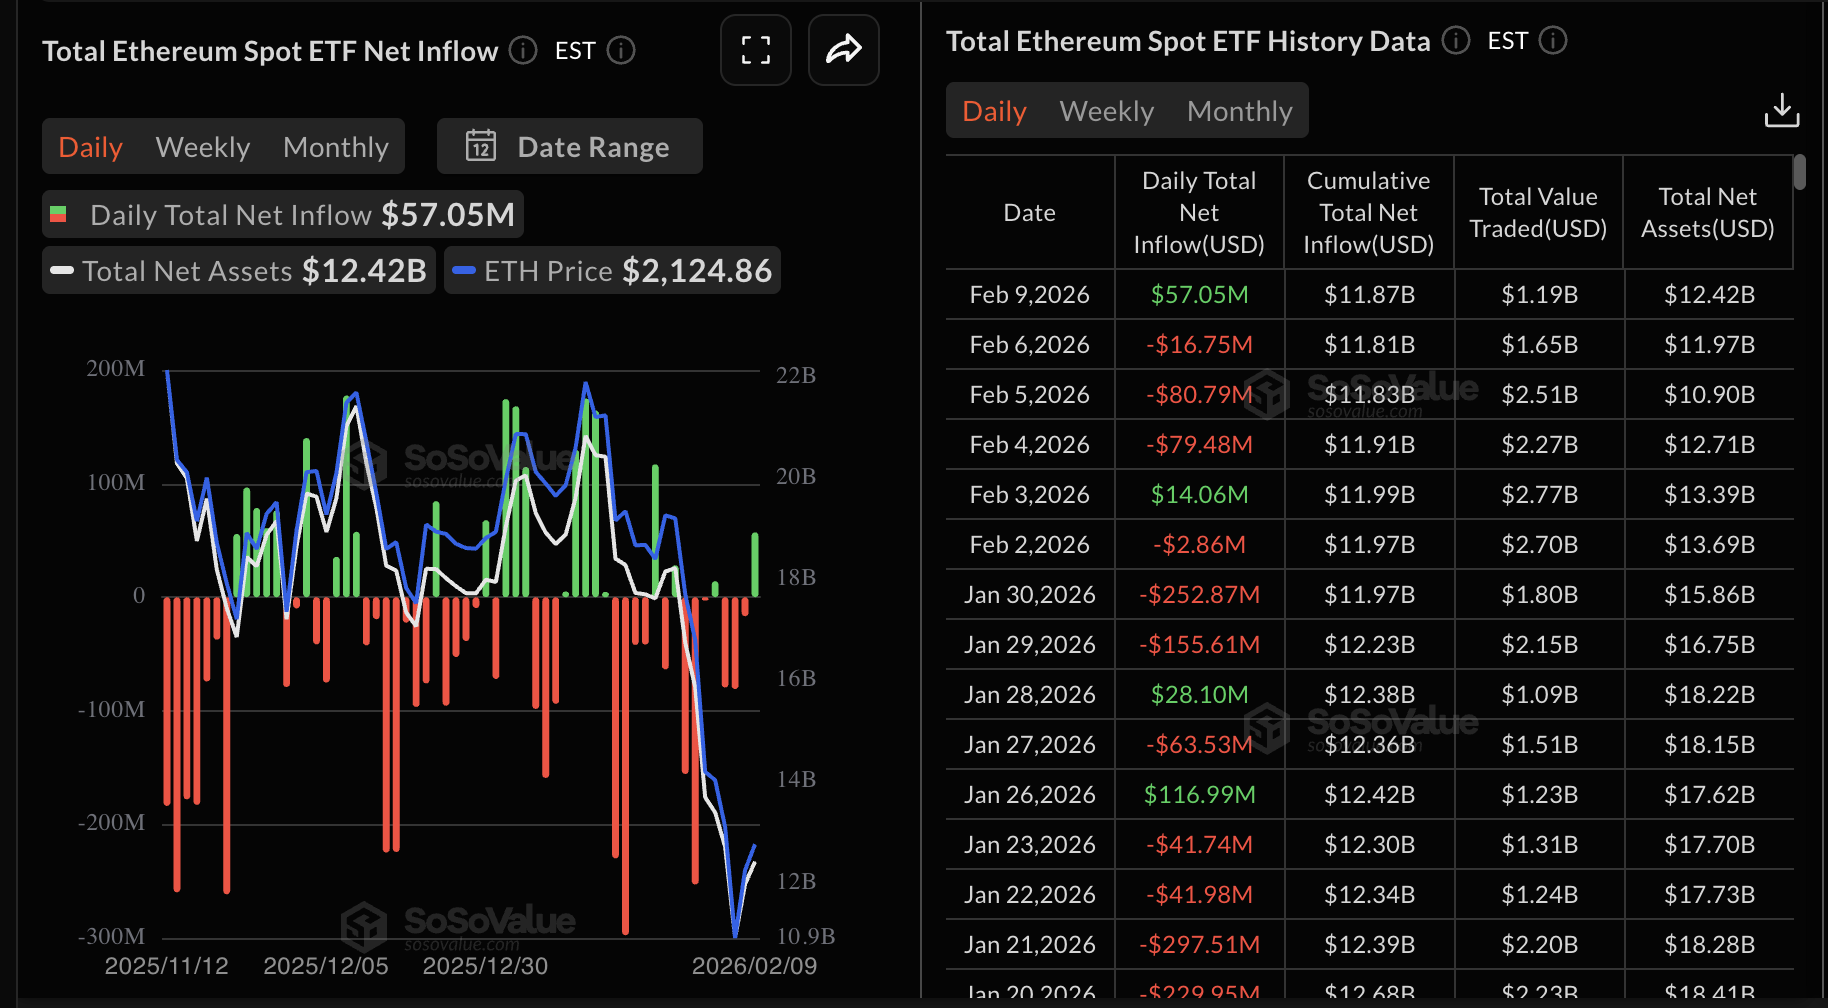
Meanwhile, Ethereum ETFs resumed inflows on Monday, receiving around $57 million. This inflow breaks three consecutive outflows, which have been weighing on the smart contract token. The cumulative inflow stands at $11.87 billion, with total net assets under management at $12.42 billion.
Inflows into US-listed XRP spot ETFs totaled $6.3 million on Monday, bringing the cumulative inflow to $1.23 billion, and net assets under management to $1.04 billion. Institutional investors have continued to lean into XRP ETFs, marking four consecutive days of inflows.
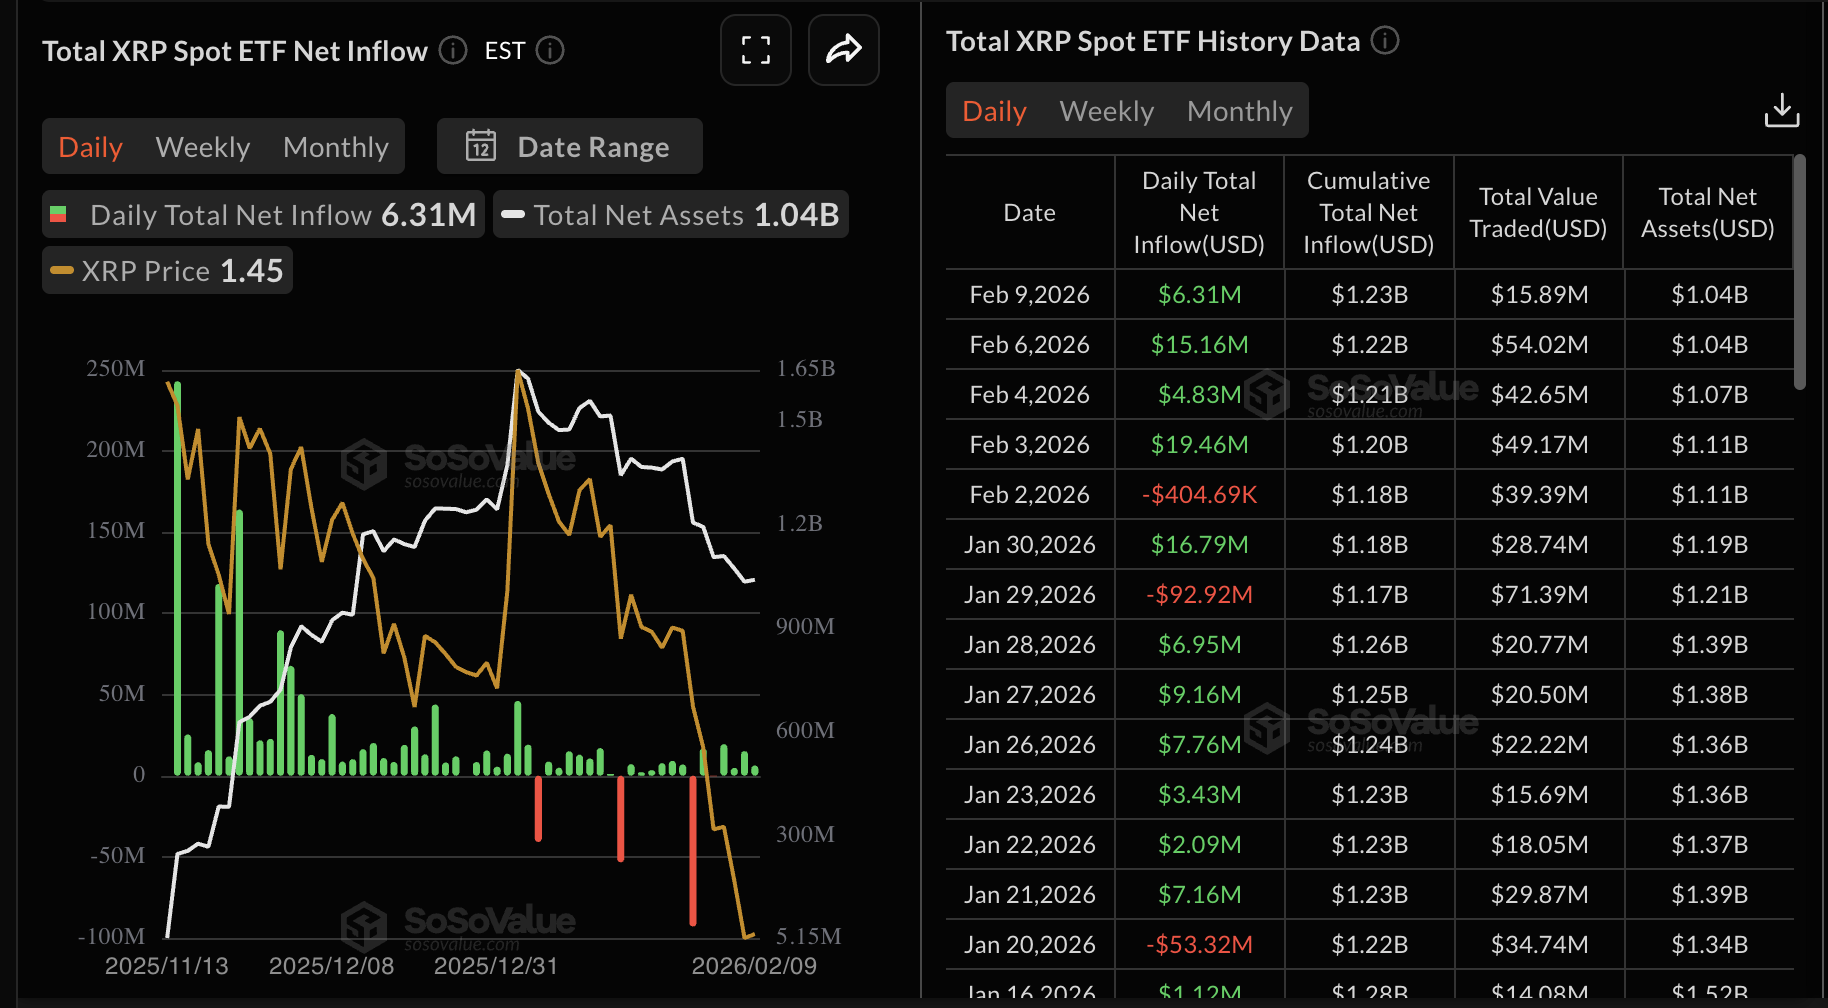
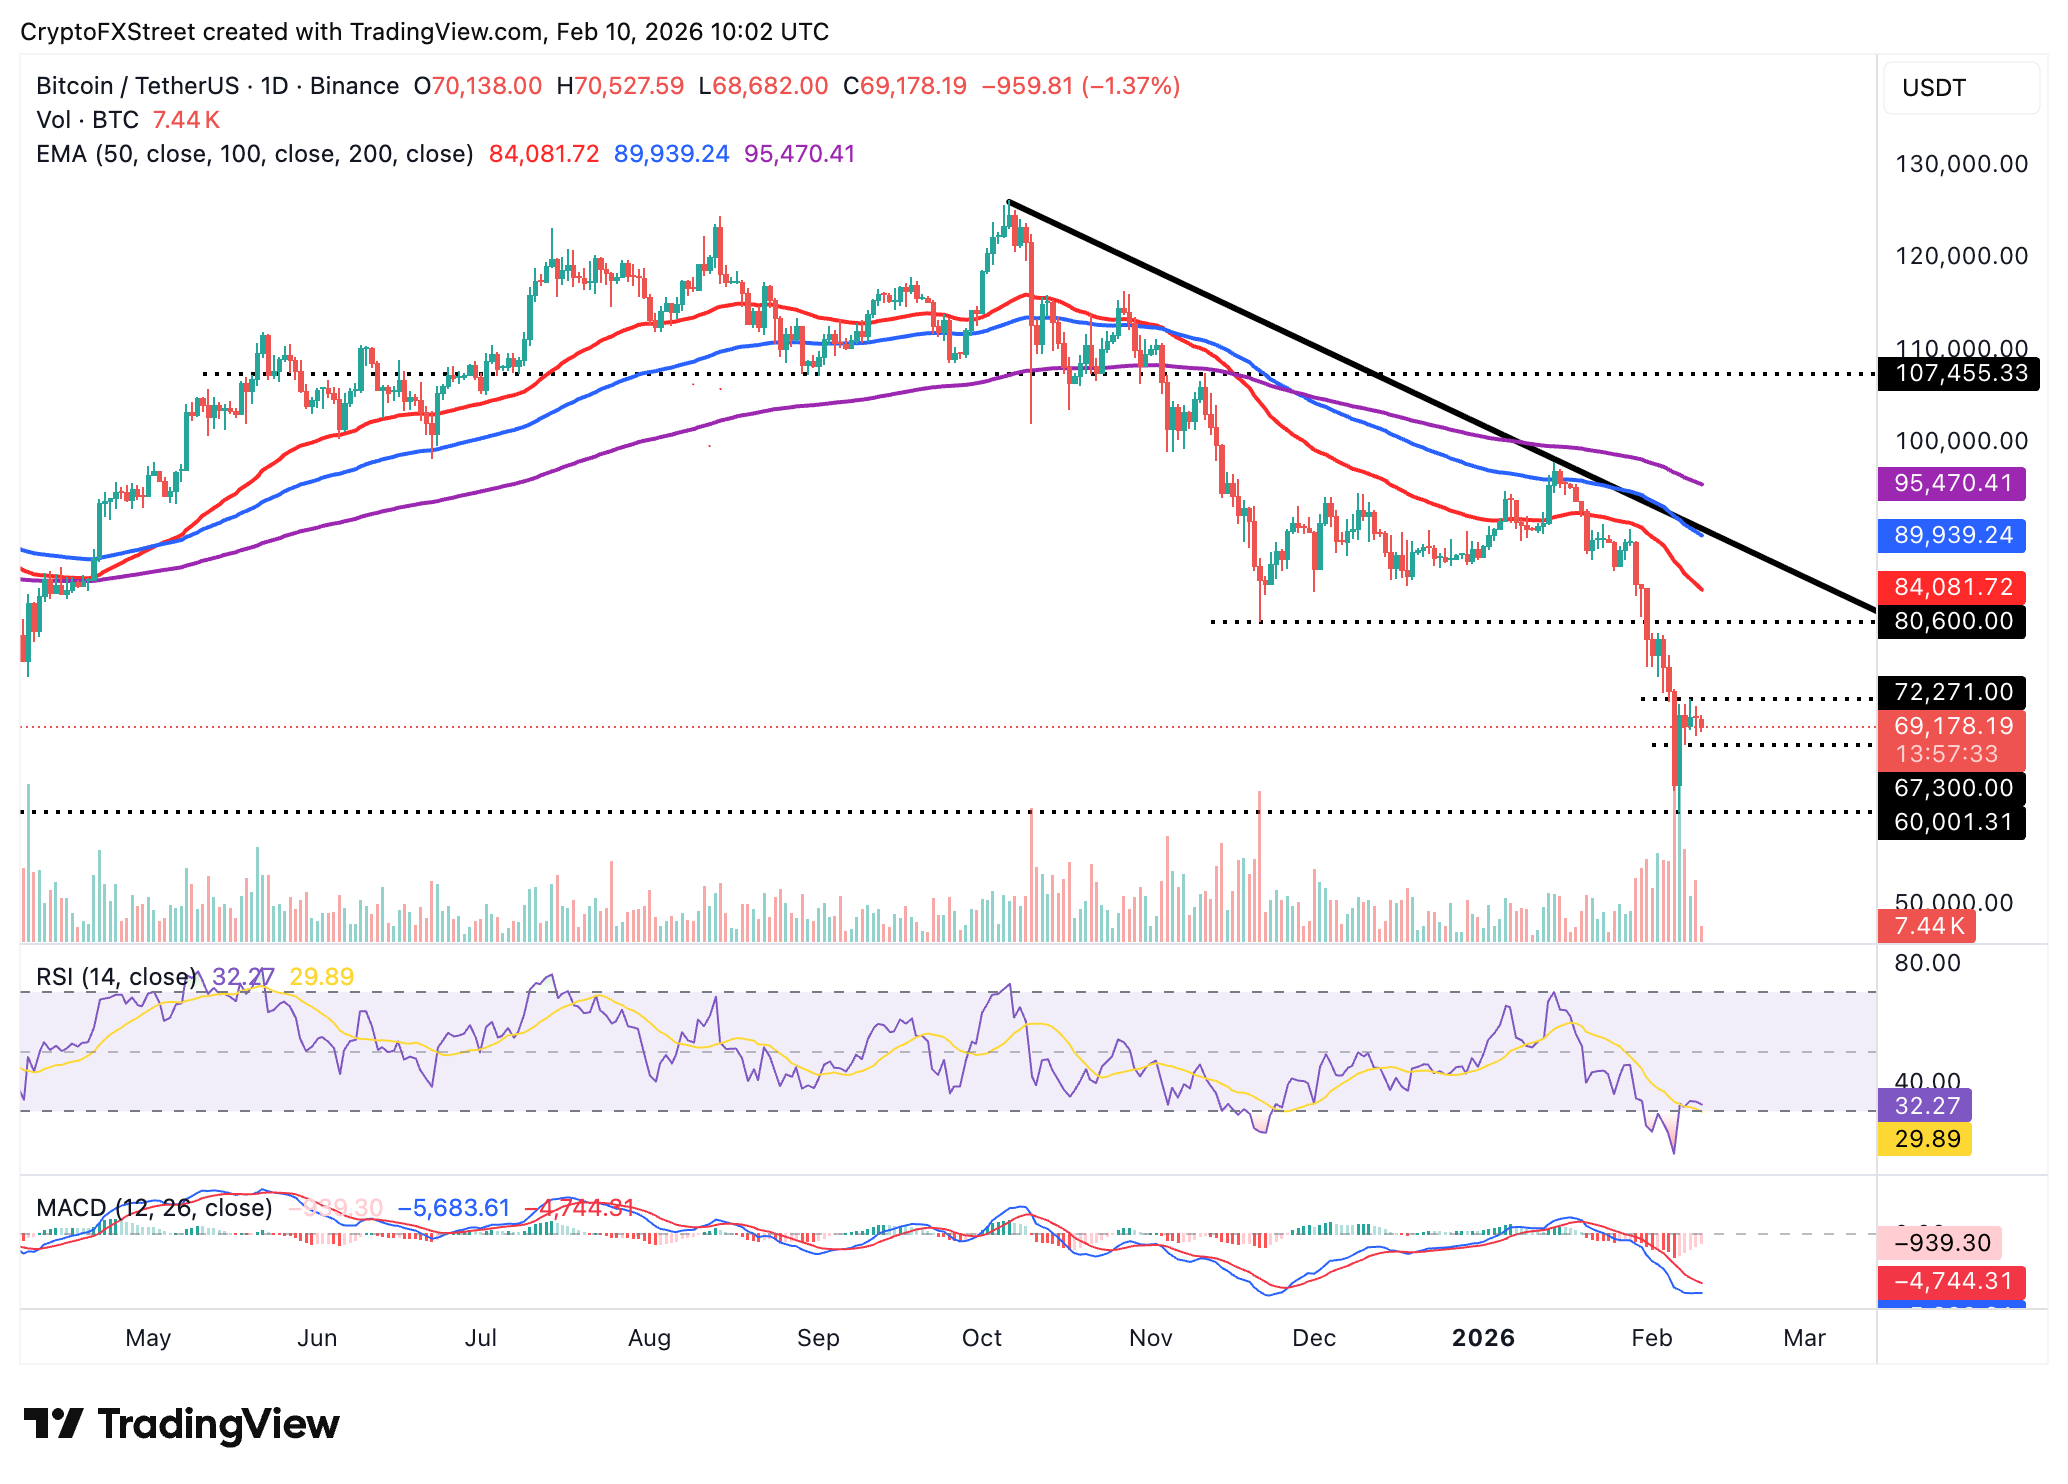
Chart of the day: Bitcoin poised for further decline
Bitcoin is positioned well below the 50-day Exponential Moving Average (EMA) at $84,081, the 100-day EMA at $89,939 and the 200-day EMA at $95,470. All three moving averages are sloping downward, underscoring the bearish momentum likely to keep BTC in a downtrend.
The Moving Average Convergence Divergence (MACD) indicator holds below the signal line on the daily chart, suggesting that investors may continue to reduce exposure. However, the red histogram bars are contracting, implying that bearish momentum could be fading, albeit gradually – a situation that may open the door for a breakout on the upside.
According to the Relative Strength Index (RSI) on the same chart, at 32, bearish momentum is still apparent, and declines may extend in the short term unless the RSI recovers toward the midline. A return to test the support at $67,300 is on the cards, while Sunday’s high of $72,271 is still within reach if bulls can reclaim the $70,000 level.
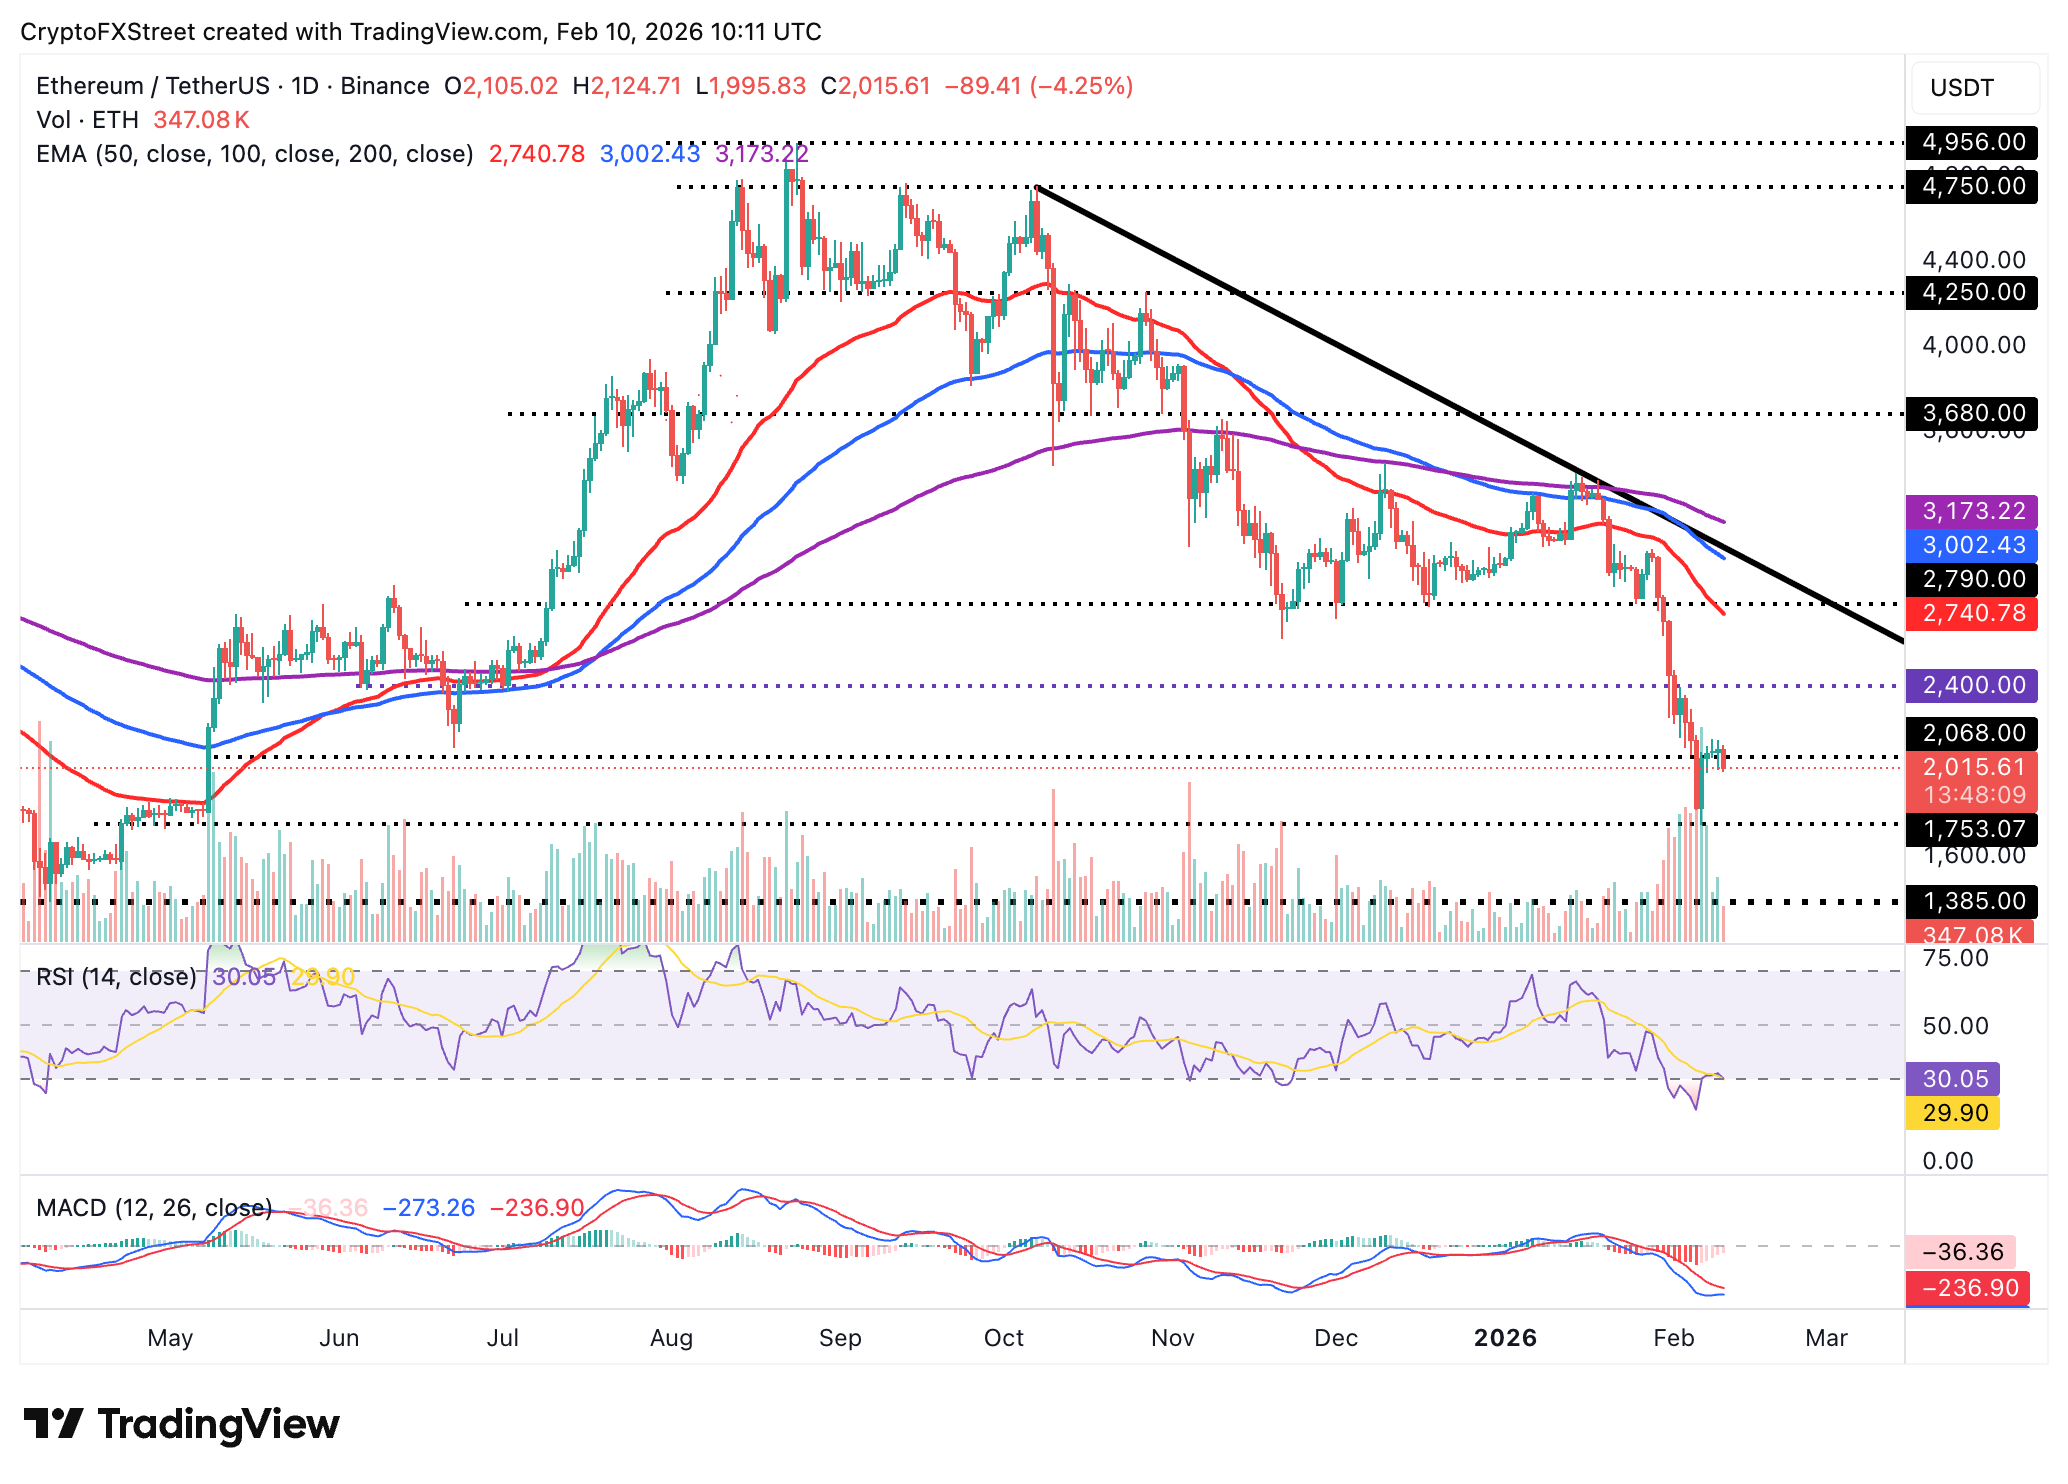
Altcoins technical outlook: Ethereum and XRP test key support levels
Ethereum holds above $2,000 as immediate support, but its short-term technical picture deteriorates. Technical indicators, including the RSI at 30 and edging lower on the daily chart, confirm a continued build-up in bearish momentum.
Similarly, the MACD indicator remains below its signal line on the same chart, prompting investors to reduce their risk exposure. Ethereum also holds significantly below the 50-day EMA at $2,741, the 100-day EMA at $3,002 and the 200-day EMA at $3,173.
As the moving averages slope downward, they limit ETH’s recovery potential. Hence, a close below the $2,000 immediate support may accelerate the downtrend and test Friday’s low at $1,747.
XRP, on the other hand, holds above support at $1.40 with initial resistance at $1.50. The path with the least resistance remains downward, as reflected by the RSI construed below 35 on the daily chart.
If the RSI falls into oversold territory, more investors could turn bearish, adding to the selling pressure. Below the $1.40 support, potential declines may retest $1.37 (Monday’s low) and the October 10 low at $1.25.
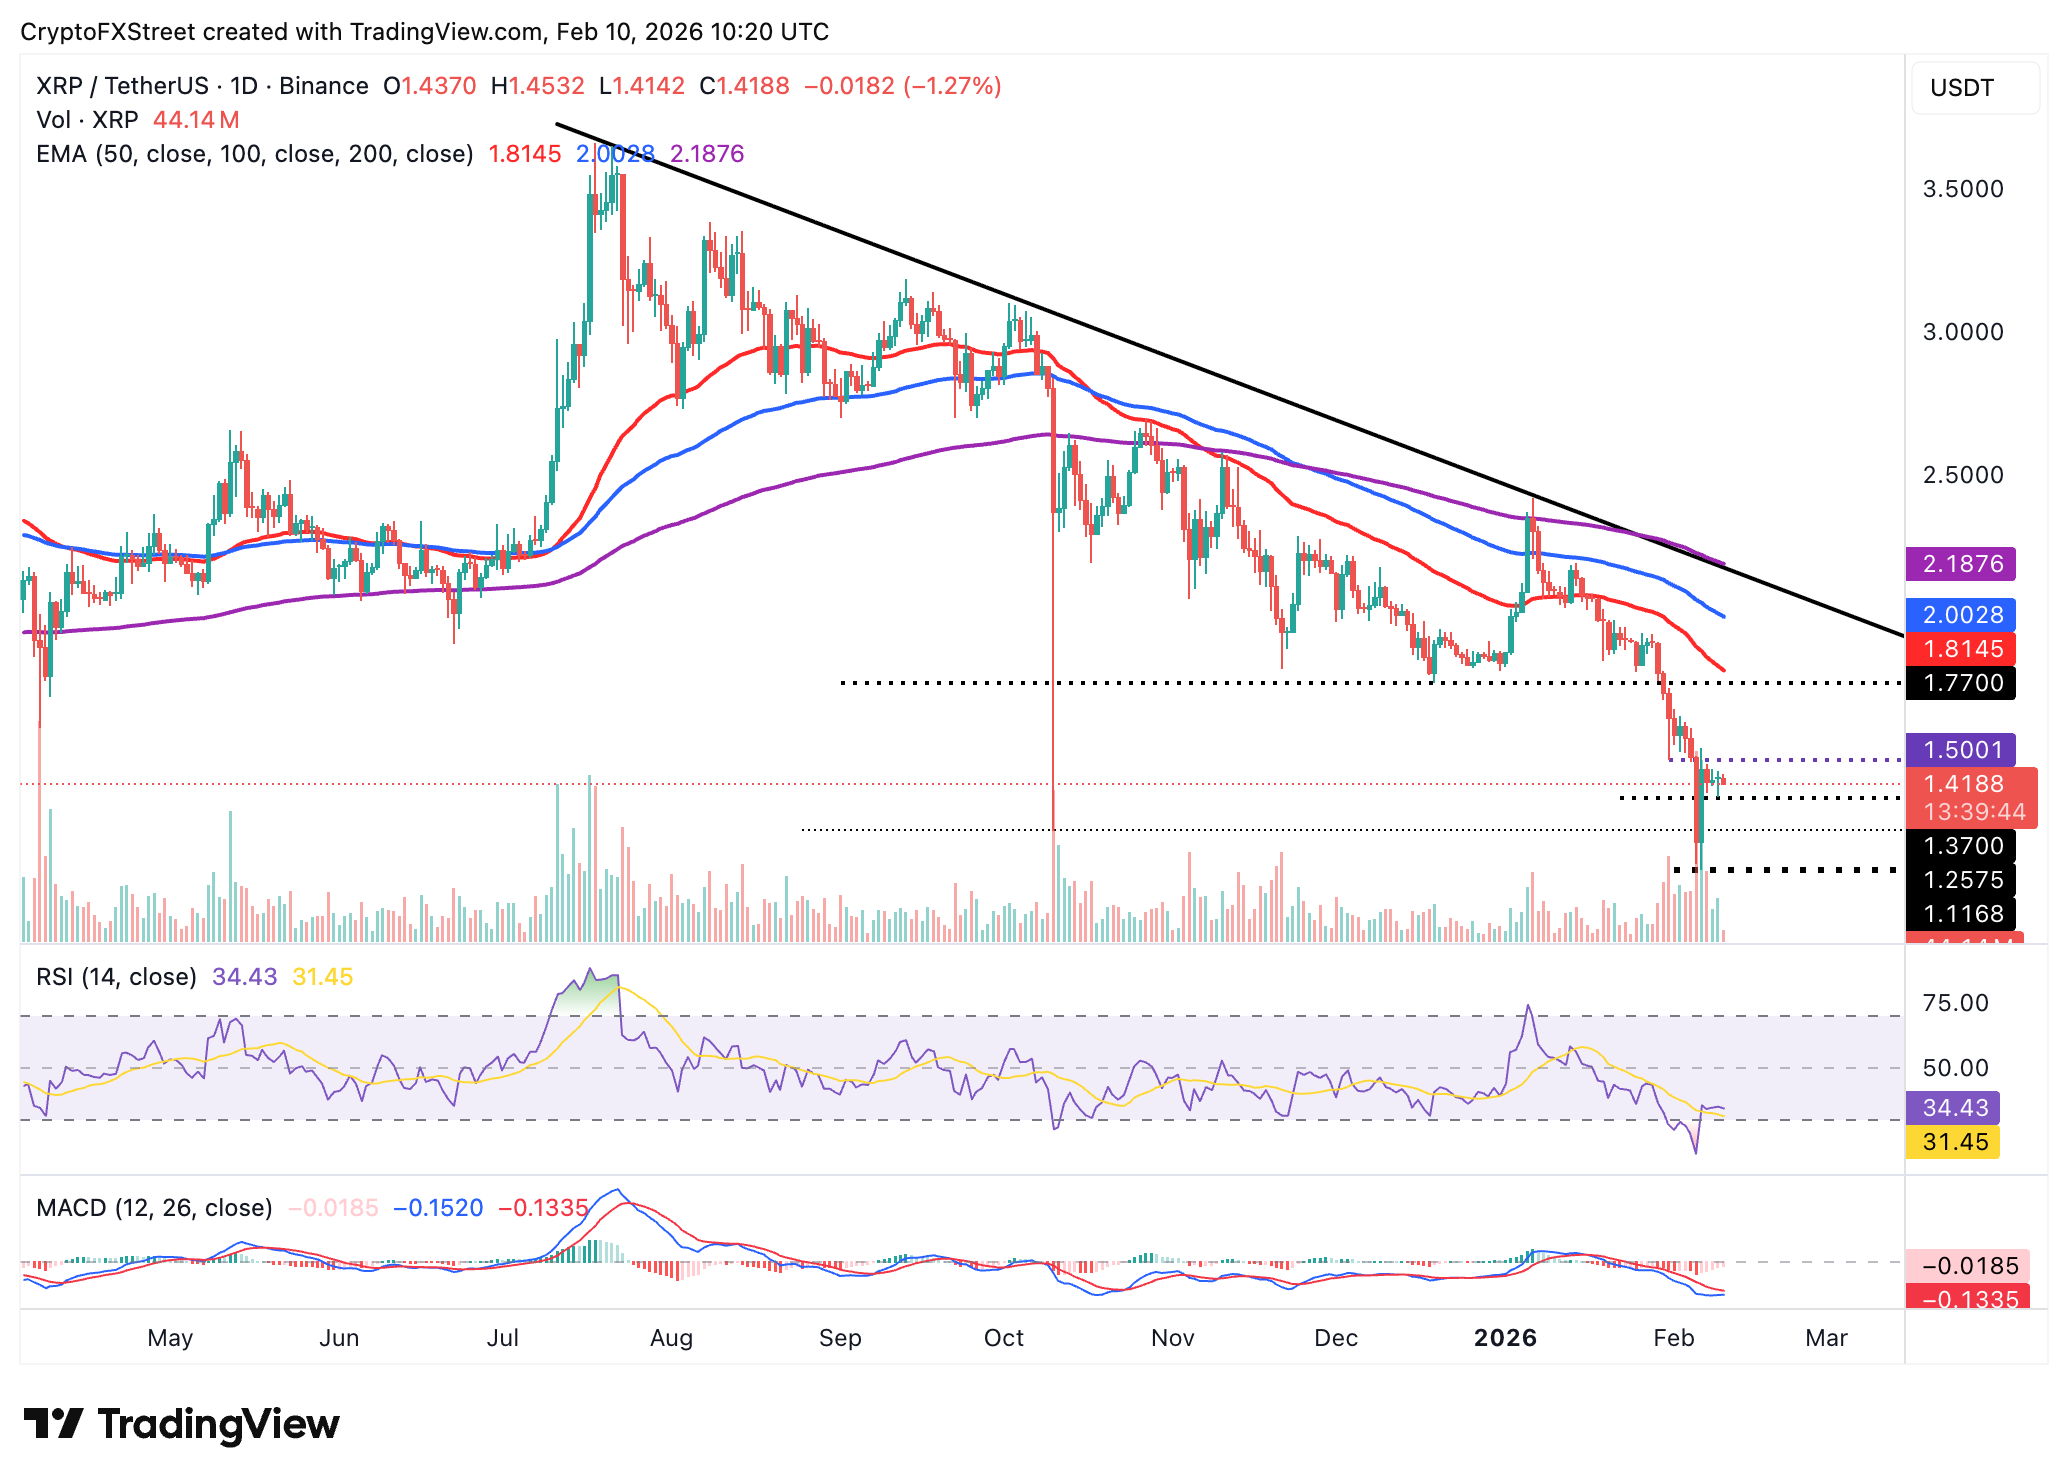
Conversely, the current support at $1.40 hints at stability, which may attract investor interest ahead of a breakout above $1.50.
Crypto ETF FAQs
An Exchange-Traded Fund (ETF) is an investment vehicle or an index that tracks the price of an underlying asset. ETFs can not only track a single asset, but a group of assets and sectors. For example, a Bitcoin ETF tracks Bitcoin’s price. ETF is a tool used by investors to gain exposure to a certain asset.
Yes. The first Bitcoin futures ETF in the US was approved by the US Securities & Exchange Commission in October 2021. A total of seven Bitcoin futures ETFs have been approved, with more than 20 still waiting for the regulator’s permission. The SEC says that the cryptocurrency industry is new and subject to manipulation, which is why it has been delaying crypto-related futures ETFs for the last few years.
Yes. The SEC approved in January 2024 the listing and trading of several Bitcoin spot Exchange-Traded Funds, opening the door to institutional capital and mainstream investors to trade the main crypto currency. The decision was hailed by the industry as a game changer.
The main advantage of crypto ETFs is the possibility of gaining exposure to a cryptocurrency without ownership, reducing the risk and cost of holding the asset. Other pros are a lower learning curve and higher security for investors since ETFs take charge of securing the underlying asset holdings. As for the main drawbacks, the main one is that as an investor you can’t have direct ownership of the asset, or, as they say in crypto, “not your keys, not your coins.” Other disadvantages are higher costs associated with holding crypto since ETFs charge fees for active management. Finally, even though investing in ETFs reduces the risk of holding an asset, price swings in the underlying cryptocurrency are likely to be reflected in the investment vehicle too.
Bài viết đề xuất


