


Bitcoin Weekly Forecast: BTC slips below $90,000 as Trump's tariffs swing, ETF outflows pressure price
- Bitcoin price struggles below $90,000 on Friday, correcting nearly 5% so far this week.
- Trump’s Davos speech on Wednesday, backing away from imposing further tariffs on the EU, triggered market volatility and risk-on mood.
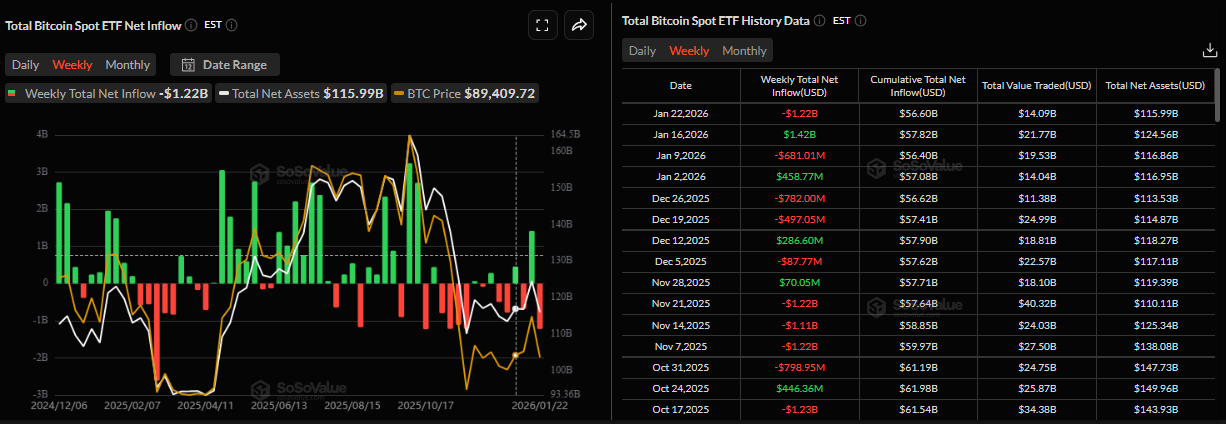
- US-listed spot ETFs posted steady outflows over the week, with withdrawals reaching $1.22 billion through Thursday.
Bitcoin (BTC) is trading below $90,000 at the time of writing on Friday, down nearly 5% this week. Despite a brief improvement in risk appetite following US President Donald Trump’s mid-week speech at Davos, which ended the imposition of new tariffs on European nations in response to their opposition to the US purchase of Greenland, the Crypto King remains under pressure as institutional demand continued to weaken so far this week.
Trade war triggered volatility toward riskier assets
Bitcoin started the week on the back foot, continuing its decline from January 15 and closing at $88,427 on Tuesday. The weekend news of escalating trade-war tensions between the European Union and the United States fueled this correction and dampened risk appetite.
On Wednesday, the largest cryptocurrency by market capitalization recovered slightly after Donald Trump’s speech at the World Economic Forum in Davos. Trump mentioned in his speech that he had reached an agreement with the North Atlantic Treaty Organization (NATO) on a framework for a future deal on Greenland, ending the need to impose new tariffs on European nations. This development briefly lifted risk appetite, with the Crypto King closing the day above $89,400.
Apart from easing geopolitical tension, Trump also said he “Hope to sign bill on crypto soon,” as the US Congress continues to work on a crypto market structure bill that was postponed last week by the Senate Banking Committee, further supporting Bitcoin’s recovery.
Bitcoin behaves like a high-beta risk asset
QCP’s Capital report on Wednesday stated that BTC is trading like a high-beta risk asset rather than behaving as a hedge, and is highly sensitive to rates, geopolitics, and cross-market volatility.
The analyst explained that Japanese bond market news further escalated risk-off sentiment, as 10-year Japanese bond yields rose to around 2.29%, levels not seen since 1999. Rising bond yields triggered a risk-off move, pressuring Bitcoin as investors unwind leverage and retreat from risk assets, while prompting a move toward safe-haven assets such as Gold (XAU) and Silver (XAG), whose prices hit fresh all-time highs while Bitcoin and Stocks pull back sharply.
Fading institutional demand weighs on BTC price
Bitcoin price correction this week was further supported by fading institutional demand. The SoSoValue chart below shows that spot Bitcoin Exchange Traded Funds (ETFs) recorded a total outflow of $1.22 billion through Thursday, the highest weekly withdrawals since November 21. If these outflows continue and intensify, BTC could see further correction.
However, on the corporate front, Strategy (MSTR) announced on Tuesday that the company purchased 22,305 Bitcoin for $2.13 billion, bringing the total holding to 709,715 BTC. This purchase highlights the firm’s continued aggressive accumulation strategy and long-term conviction in Bitcoin despite ongoing market weakness.
Macroeconomics data releases weaken BTC
This week's US macroeconomic data releases failed to support BTC's price. The US Bureau of Economic Analysis published the final reading of third-quarter Gross Domestic Product on Thursday, showing the economy expanded by 4.4%. The reading was slightly better than the second estimate of 4.3% and was also well above the 3.8% growth recorded in the previous quarter.
In addition, a separate report revealed that the US core Personal Consumption Expenditures (PCE) Price Index – the Fed's preferred inflation gauge – rose 2.8% YoY in November, up from 2.7% the previous month. On a monthly basis, the gauge maintained steady growth, rising 0.2%. Moreover, the US Department of Labour reported that initial claims for state unemployment benefits increased 1,000 to a seasonally adjusted 200,000 for the week ending January 17. The print was lower than consensus estimates for a reading of 212,000.
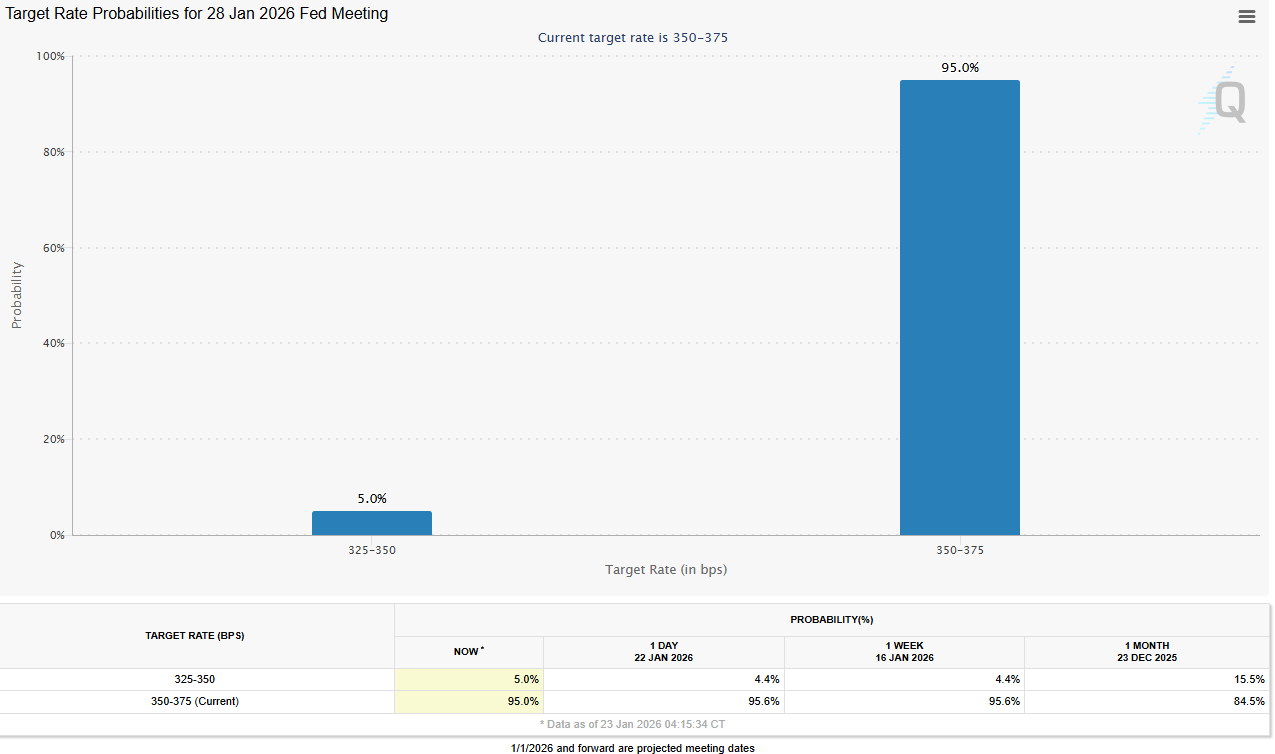
These data releases are currently capping BTC recovery as strong growth and sticky inflation reduce expectations for near-term US Federal Reserve (Fed) policy easing. The CME FedWatch tool, as shown below, indicates that market participants currently price in over a 95% chance that the US central bank will keep rates unchanged at its January 27–28 meeting.
Will BTC hold key supports?
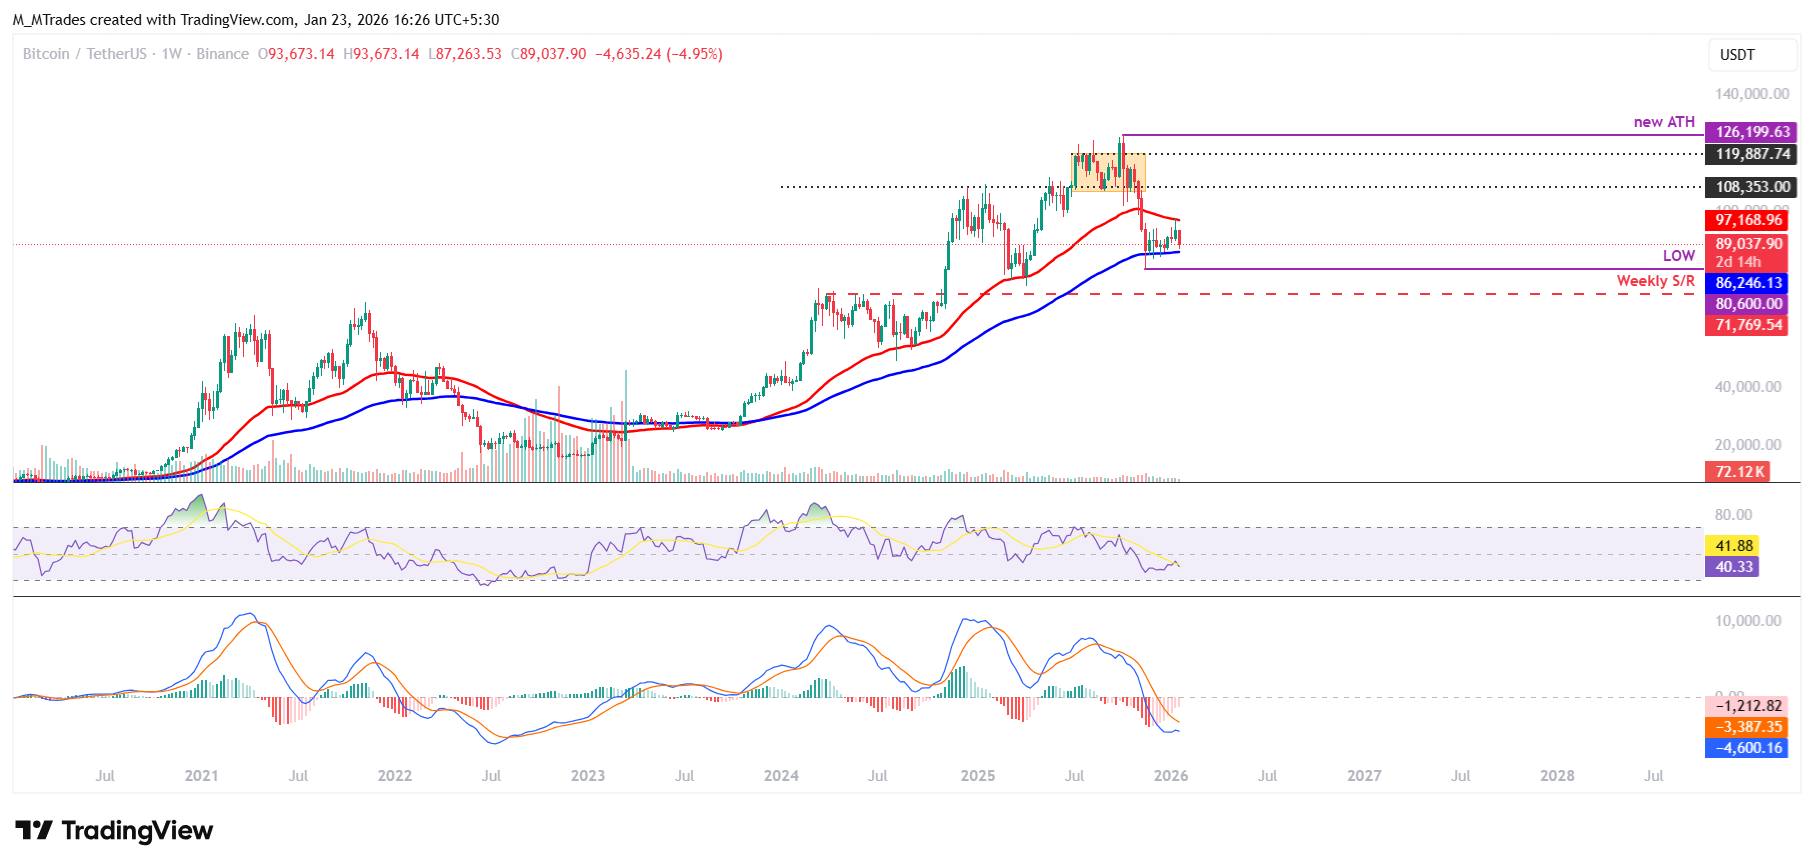
Bitcoin’s weekly chart shows the price was rejected at the 50-week Exponential Moving Average (EMA) last week and declined nearly 5%, nearing the 100-Week EMA at $86,246 on Friday.
If BTC continues its correction, it could extend the decline to retest the key 100-week EMA at $86,246. A close below this level could extend the decline toward the November low of $80,600.
The Relative Strength Index (RSI) on the weekly chart is 40, below the neutral level of 50, and pointing downward, indicating bearish momentum building up. Moreover, the Moving Average Convergence Divergence (MACD) indicator on the weekly chart also showed a bearish crossover in mid-August, which remains intact, further supporting the negative outlook.
At the time of writing on Friday, BTC is struggling below $90,000, after closing below key support levels (the 50-day Exponential Moving Average (EMA) at $91,912 and a previously broken upper consolidation boundary at $90,000) earlier in the week
If BTC closes below the midpoint of the horizontal parallel channel at $87,787 on a daily basis, it could extend the fall toward the lower consolidation boundary at $85,569, which coincides with the 78.6% Fibonacci retracement level from the April 7 low of $74,508 to the all-time high of $126,199 set on October 6.
The RSI on the daily chart is at 42, indicating bearish momentum gaining traction. The MACD showed a bearish crossover on Tuesday, with rising red histogram bars below the neutral level, suggesting downward pressure.
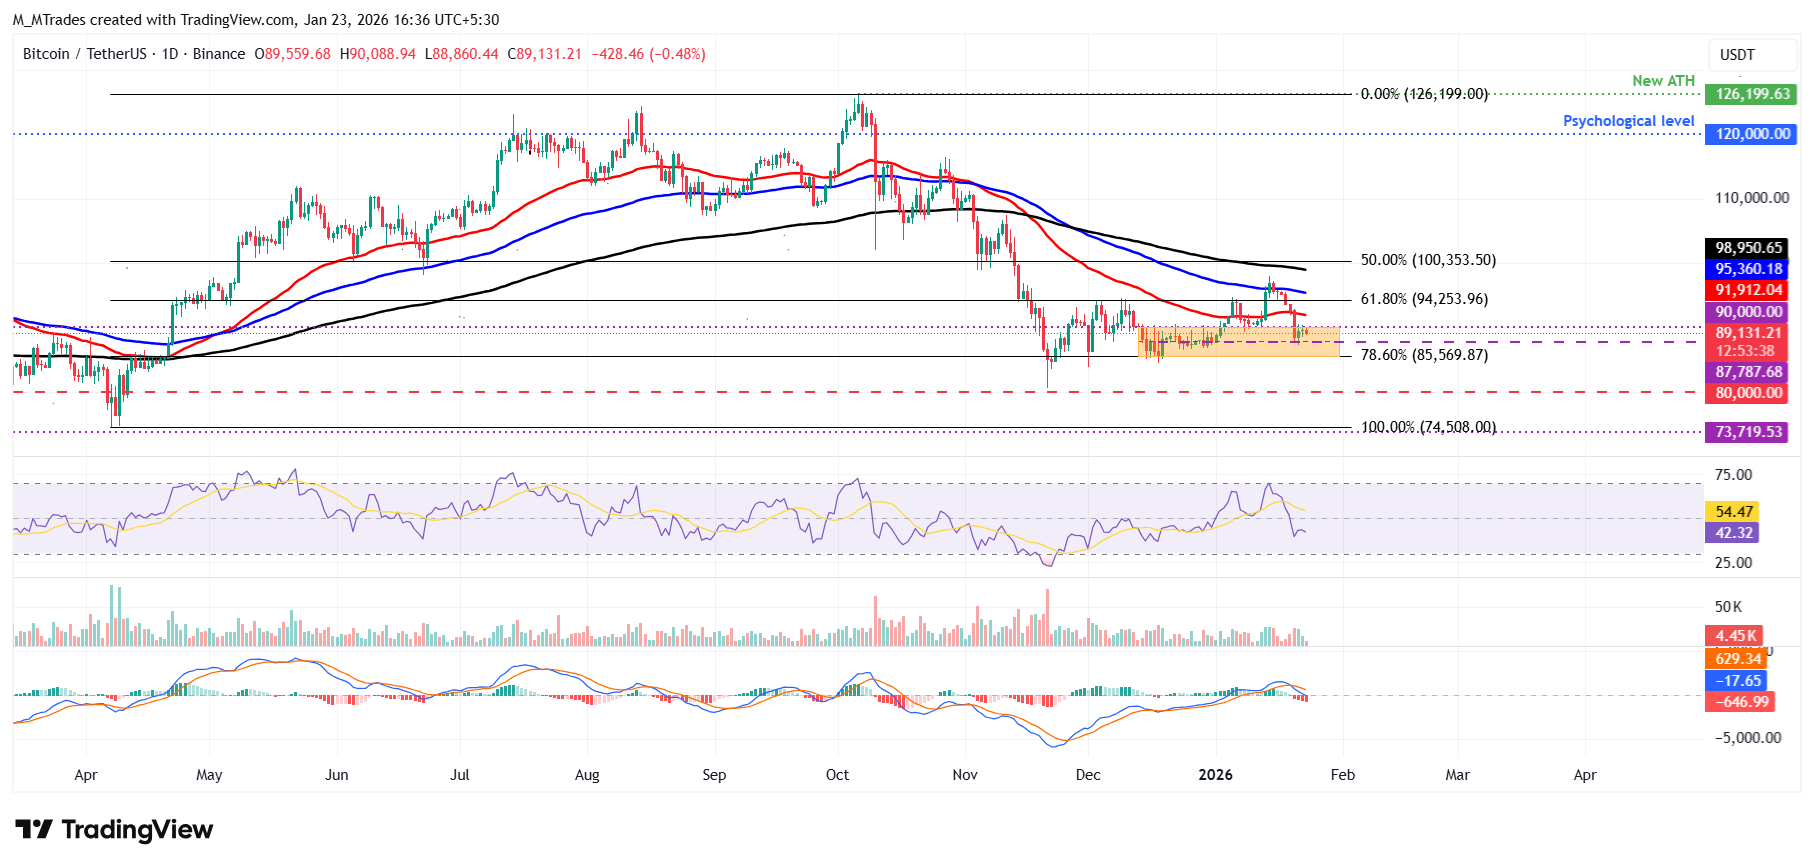
On the other hand, if BTC recovers, it could extend the advance toward the 50-day EMA at $91,912.
Bitcoin, altcoins, stablecoins FAQs
Bitcoin is the largest cryptocurrency by market capitalization, a virtual currency designed to serve as money. This form of payment cannot be controlled by any one person, group, or entity, which eliminates the need for third-party participation during financial transactions.
Altcoins are any cryptocurrency apart from Bitcoin, but some also regard Ethereum as a non-altcoin because it is from these two cryptocurrencies that forking happens. If this is true, then Litecoin is the first altcoin, forked from the Bitcoin protocol and, therefore, an “improved” version of it.
Stablecoins are cryptocurrencies designed to have a stable price, with their value backed by a reserve of the asset it represents. To achieve this, the value of any one stablecoin is pegged to a commodity or financial instrument, such as the US Dollar (USD), with its supply regulated by an algorithm or demand. The main goal of stablecoins is to provide an on/off-ramp for investors willing to trade and invest in cryptocurrencies. Stablecoins also allow investors to store value since cryptocurrencies, in general, are subject to volatility.
Bitcoin dominance is the ratio of Bitcoin's market capitalization to the total market capitalization of all cryptocurrencies combined. It provides a clear picture of Bitcoin’s interest among investors. A high BTC dominance typically happens before and during a bull run, in which investors resort to investing in relatively stable and high market capitalization cryptocurrency like Bitcoin. A drop in BTC dominance usually means that investors are moving their capital and/or profits to altcoins in a quest for higher returns, which usually triggers an explosion of altcoin rallies.
Bài viết đề xuất


