


Ripple Price Forecast: XRP holds losses above $1.90 amid mild ETF inflows, muted retail interest
- XRP holds intraday losses above immediate support at $1.90 as crypto market remains in bears’ control.
- Subdued XRP derivatives signal a lack of investor confidence in the token.
- Mild ETF inflows fail to move prices as XRP declines for a second consecutive day.
Ripple (XRP) is trading under pressure, hovering above the immediate support level at $1.90 at the time of writing on Friday. Despite mild inflows into spot exchange-traded funds (ETFs), XRP has declined for a second consecutive day, reflecting weak retail demand and persistent selling pressure.
XRP struggles as retail interest wanes
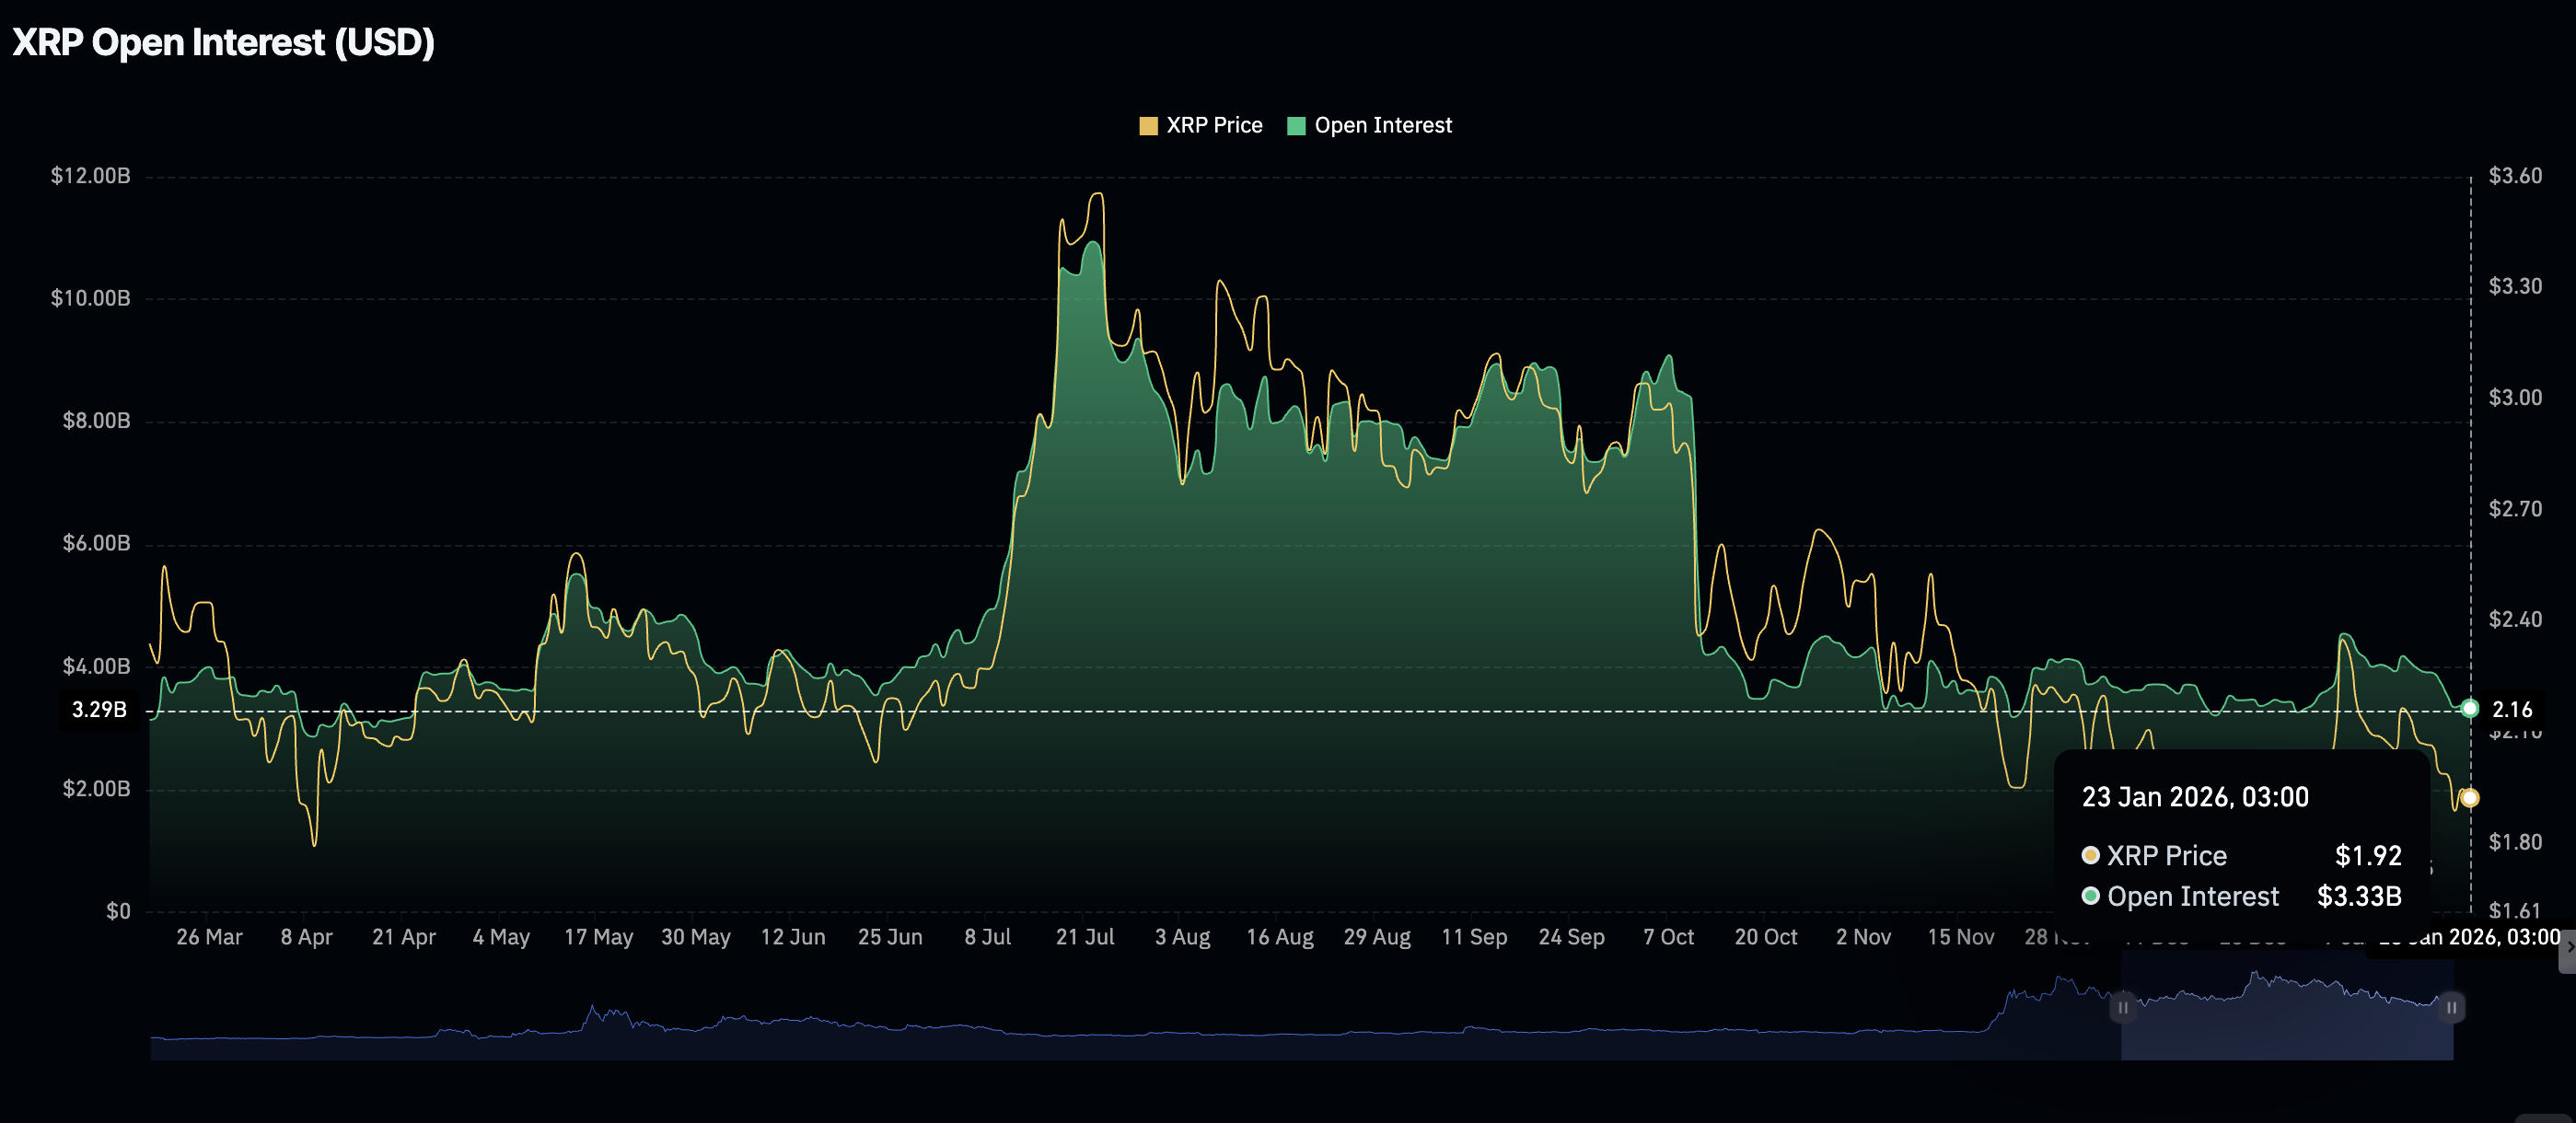
Retail interest weakened significantly since the October crash, which liquidated over $19 billion in crypto assets in a single day. The headwinds affected XRP derivatives, as future Open Interest (OI) tumbled from $8.36 billion on October 10 to $3.33 billion on Friday.
An attempt by the bulls to accelerate demand faltered at $4.55 billion on January 6, leaving XRP vulnerable to further losses. If derivative weakness continues, it could drive prices lower toward the April low of $1.61.
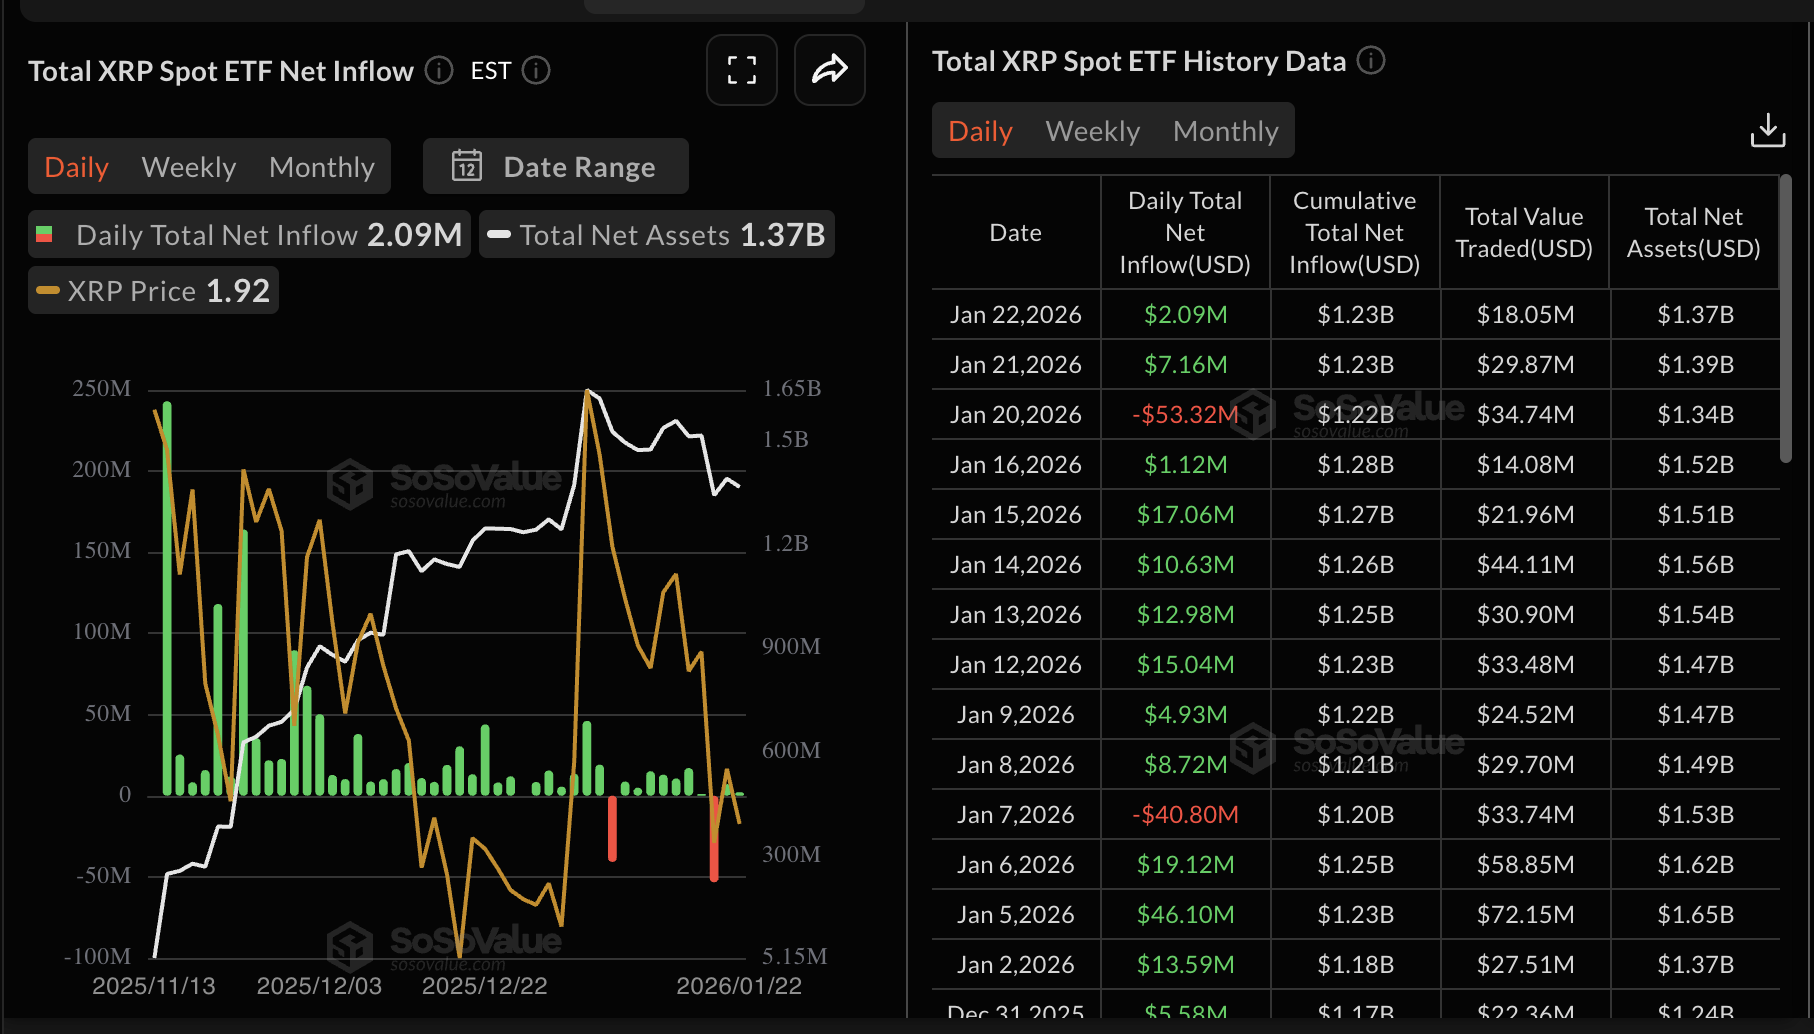
XRP spot ETFs recorded mild inflows of approximately $2 million on Thursday despite risk appetite deteriorating across crypto assets this week. The cumulative total inflow stands at $1.23 billion, and the net assets at $1.37 million, according to SoSoValue data. Demand for US-listed XRP ETFs has remained relatively stable, with only two days of outflows.
Technical outlook: XRP trades amid downtrend pressure
XRP continues to trade below the 50-day Exponential Moving Average (EMA) at $2.05, the 100-day EMA at $2.17, and the 200-day EMA at $2.30, confirming a steady bearish bias.
The immediate support at $1.90 absorbs the prevailing selling pressure. However, the Relative Strength Index (RSI) has declined to 41, indicating that bears are largely in control. An extended drop in the RSI toward the oversold region may accelerate the down leg, testing the Monday low at $1.85 and the April low at $1.61.
The Moving Average Convergence Divergence (MACD) indicator highlights another sell signal, as it holds below the signal line. Traders would be inclined to reduce exposure if the histogram bars below the zero line continue to expand.
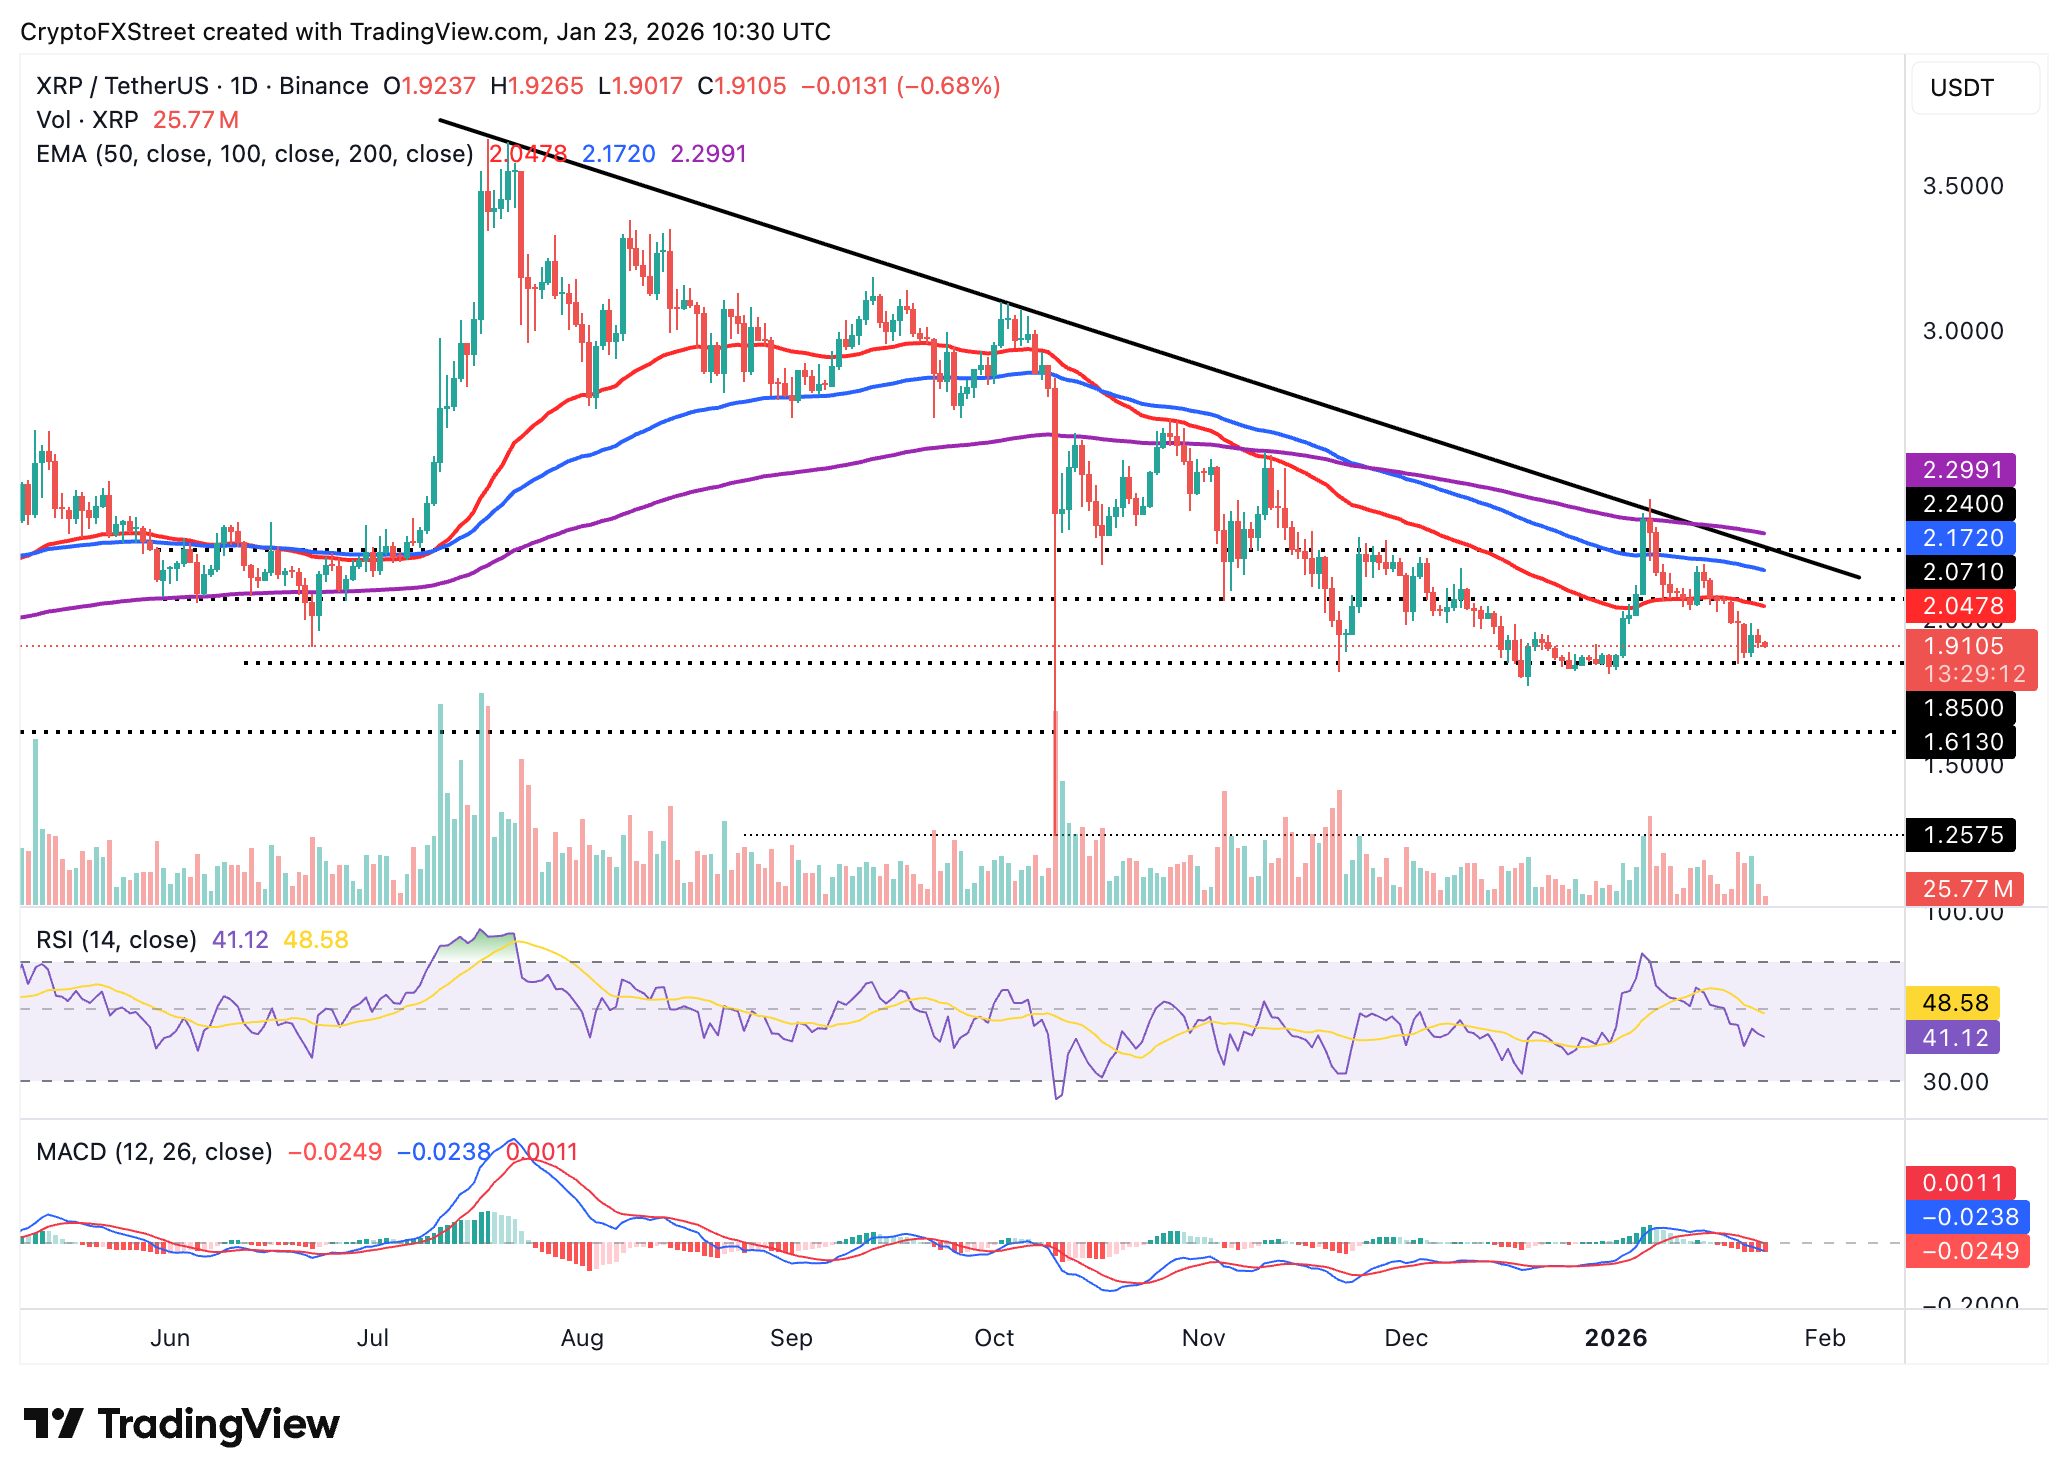
Conversely, the $1.90 support level remains critical for XRP to resume recovery and reclaim the $2.00 psychological threshold. Beyond this range, the 50-day EMA caps the upside at $2.05, the 100-day EMA at $2.17 and the 200-day EMA at $2.30.
Crypto ETF FAQs
An Exchange-Traded Fund (ETF) is an investment vehicle or an index that tracks the price of an underlying asset. ETFs can not only track a single asset, but a group of assets and sectors. For example, a Bitcoin ETF tracks Bitcoin’s price. ETF is a tool used by investors to gain exposure to a certain asset.
Yes. The first Bitcoin futures ETF in the US was approved by the US Securities & Exchange Commission in October 2021. A total of seven Bitcoin futures ETFs have been approved, with more than 20 still waiting for the regulator’s permission. The SEC says that the cryptocurrency industry is new and subject to manipulation, which is why it has been delaying crypto-related futures ETFs for the last few years.
Yes. The SEC approved in January 2024 the listing and trading of several Bitcoin spot Exchange-Traded Funds, opening the door to institutional capital and mainstream investors to trade the main crypto currency. The decision was hailed by the industry as a game changer.
The main advantage of crypto ETFs is the possibility of gaining exposure to a cryptocurrency without ownership, reducing the risk and cost of holding the asset. Other pros are a lower learning curve and higher security for investors since ETFs take charge of securing the underlying asset holdings. As for the main drawbacks, the main one is that as an investor you can’t have direct ownership of the asset, or, as they say in crypto, “not your keys, not your coins.” Other disadvantages are higher costs associated with holding crypto since ETFs charge fees for active management. Finally, even though investing in ETFs reduces the risk of holding an asset, price swings in the underlying cryptocurrency are likely to be reflected in the investment vehicle too.
Bài viết đề xuất


