


PancakeSwap Price Forecast: CAKE extends recovery as derivatives data turn bullish
- PancakeSwap's price extends its recovery on Thursday after finding support at the upper boundary of the horizontal channel.
- The derivatives data back the recovery as funding rates turn positive alongside rising long bets.
- The technical outlook favors further upside toward $2.06 if the key support level holds.
PanckeSwap (CAKE) price extends recovery trading above $1.95 at the time of writing on Thursday, after finding support around a key level the previous day. Derivatives metrics back recovery with CAKE’s funding rates turning positive alongside rising long bets. In addition, the technical analysis suggests further upside if CAKE holds above key support.
CAKE’s derivative metrics support bullish bias
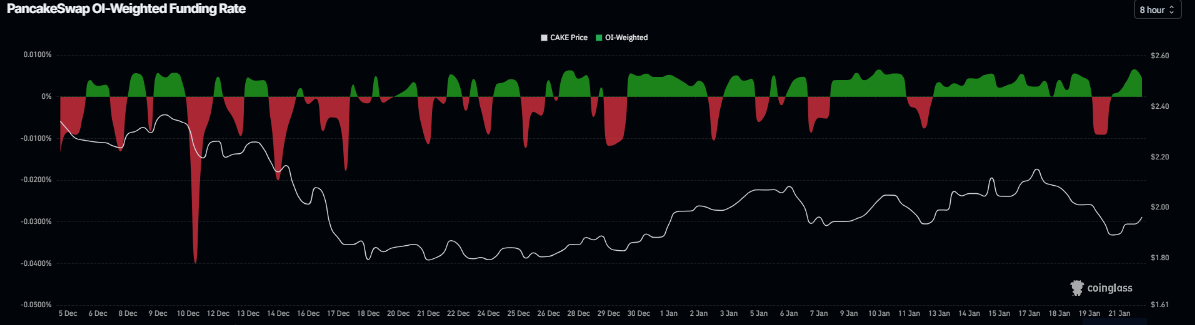
Coinglass’s OI-Weighted Funding Rate data shows that the number of traders betting that the price of CAKE will slide further is lower than that anticipating a price increase. Generally, a positive rate (longs pay shorts) indicates bullish sentiment, while negative numbers (shorts pay longs) indicate bearishness.
The metric has flipped a positive rate on Wednesday and currently reads 0.0046%, indicating that longs are paying shorts. Historically, as shown in the chart below, when the funding rates have flipped from negative to positive, CAKE’s price has rallied sharply, as seen on January 13.
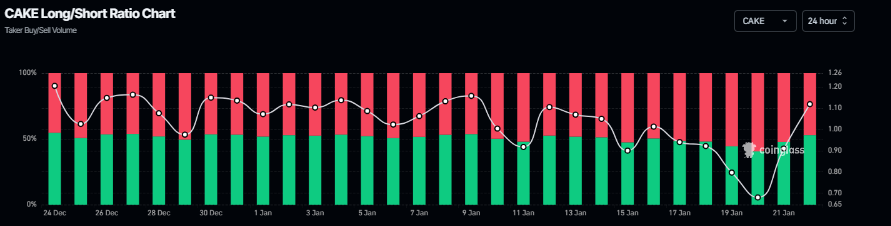
Apart from the positive funding rates, Coinglass’s long-to-short ratio for CAKE reads 1.11 on Thursday, nearing the highest level over a month. The ratio above one suggests that more traders are betting on PancakeSwap’s price to rally.
In addition to bullish derivatives data, CAKE’s max supply reduction proposal passed on Monday. The max supply has been reduced from 450 million to 400 million, and burns consistently outweigh emissions. This development is bullish for CAKE in the long term, as a reduction of the maximum supply and sustained token burns tighten the circulating supply, triggering scarcity and a rally in prices.
PancakeSwap Price Forecast: CAKE could extend recovery toward the $2 mark
PancakeSwap's price was rejected at the weekly resistance level of $2.13 on Saturday and declined nearly 10% over the next three days. On Wednesday, CAKE rebounded slightly after finding support at the upper boundary of the previously broken horizontal channel at $1.88. As of writing on Thursday, CAKE is trading above $1.95.
If CAKE continues its price recovery, it could extend the advance toward the 50-day Exponential Moving Average (EMA) at $2.06.
The Relative Strength Index (RSI) on the daily chart is 45, pointing upward toward the neutral 50 level, indicating fading bearish momentum. For the bullish momentum to be sustained, the RSI must move above the neutral level. However, traders should be cautious, as the Moving Average Convergence Divergence (MACD) indicator showed a bearish crossover on Tuesday, suggesting a mild downward pressure.
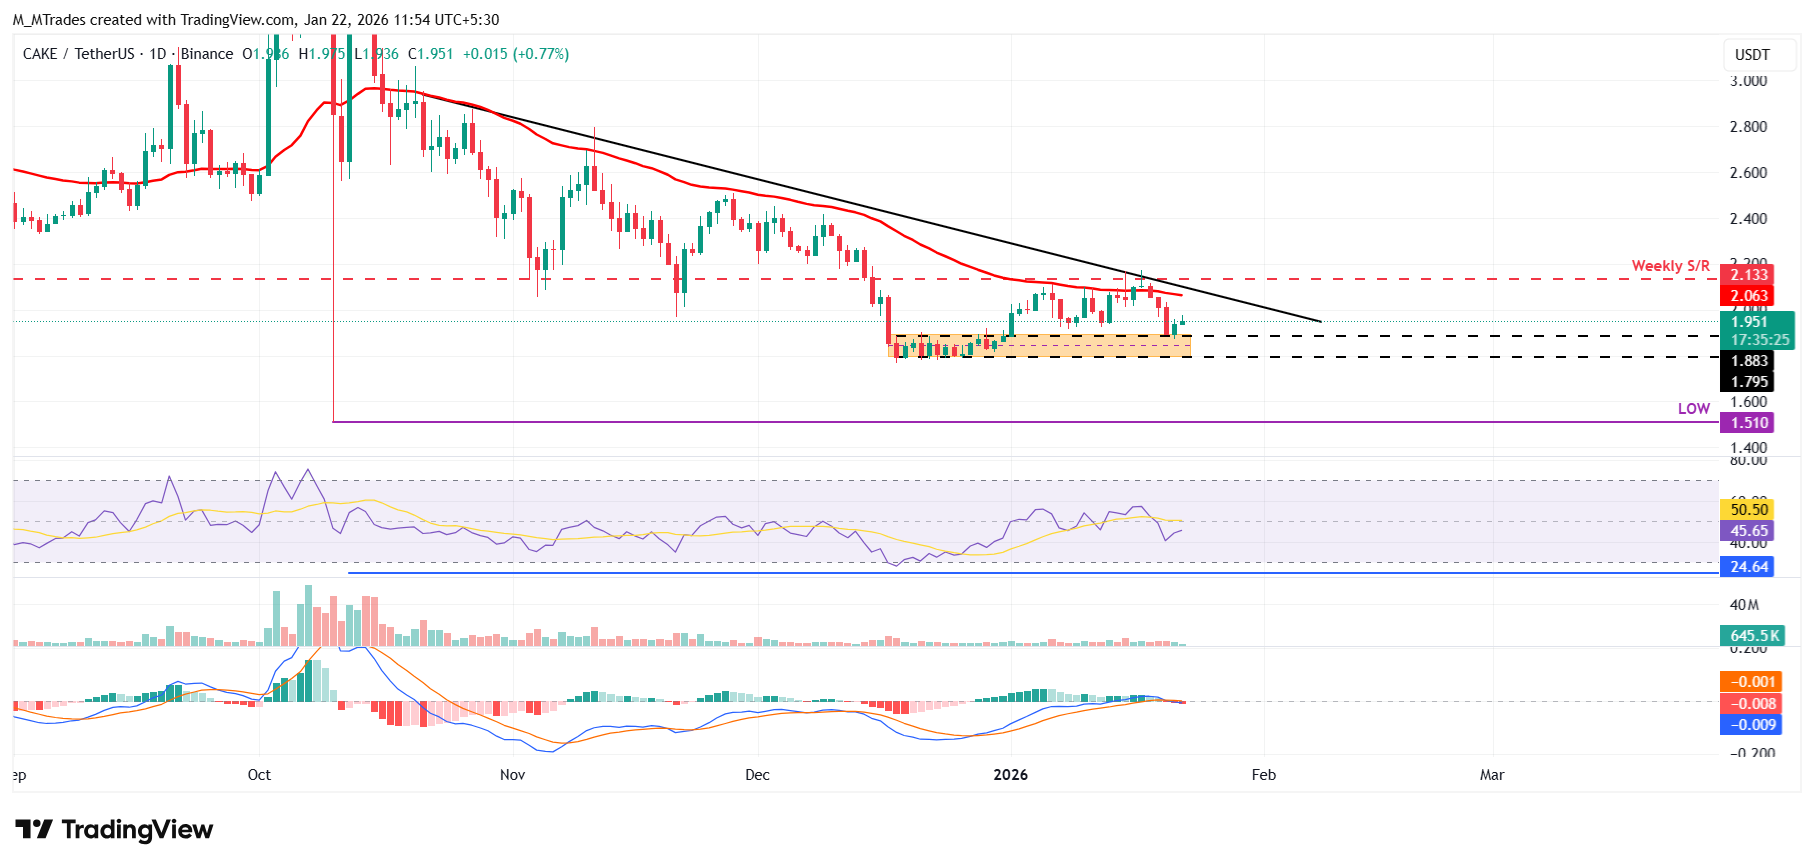
However, if CAKE closes below the upper boundary at $1.88 on a daily basis, it could extend the correction toward the lower boundary at $1.79.
Bài viết đề xuất


